
1. Context
The worldwide prevalence of osteoporosis is rising, primarily due to increased life expectancy and the aging population (1). World Health Organization (WHO) has defined osteoporosis as the “silent illness of the century”, noting its higher prevalence compared to conditions such as allergies and hypercholesterolemia and its significant economic burden on global healthcare services (2). It has been estimated that approximately 20% of the population is affected by osteoporosis and 40% by osteopenia (3).
Osteoporosis has numerous risk factors, including female sex, advanced age, low Body Mass Index (BMI), prior fractures, excessive alcohol consumption, smoking, and the use of certain medications, notably glucocorticoids (4). In addition, various comorbidities such as autoimmune diseases (e.g., multiple sclerosis, systemic lupus erythematosus, rheumatoid arthritis), endocrine disorders (e.g., diabetes mellitus, premature menopause, hyperthyroidism, hypogonadism), chronic liver disease, and malignancies like prostate cancer can contribute to or exacerbate bone loss (5-7). Clinically, osteoporosis is often asymptomatic until the occurrence of fragility fractures, predominantly affecting the vertebrae, hip, and wrist (8). These fractures are associated with significant morbidity, diminished quality of life, and increased mortality, particularly among the elderly (9). Epidemiological data indicate that up to one in three women and one in five men over the age of 50 are likely to experience an osteoporotic fracture during their lifetime (10). Notably, hip fractures are linked to a 15% increase in one-year mortality and various degrees of long-term functional impairment in 70% of survivors (11). As a result, early detection and diagnosis of osteoporosis become crucial for preserving bone mineral density (BMD), timely intervention, preventing complications, and reducing the overall disease burden (12).
Artificial intelligence (AI), including machine learning (ML) and deep learning (DL), is defined as a computational program that can imitate intellectual human behavior in resolving complex real-world problems (13). The AI techniques are considered an appropriate approach for identifying unexpected risk factors in preventive medicine (14). The AI has also been used in different aspects of medicine throughout education, the screening process, diagnosis, classification, and management (15-18). In osteoporosis, AI algorithms have shown excellent capacity in automatically extracting complex patterns from large datasets to support clinical decision-making in different aspects, from screening to management, and even help in scientific writing (19-21). The current study aims to review the recent advancements of AI-based approaches to osteoporosis, providing insights into their clinical potential and, ultimately, outlining future directions toward integrated AI systems to improve osteoporosis care.
2. Evidence Acquisition
2.1. Search Strategy
We conducted a comprehensive search of English language articles published from January 2019 to December 2024 on AI applications for osteoporosis assessment using the PubMed, Scopus, and Google Scholar databases. To identify relevant studies, we conducted a thorough search query using the following keywords: “Artificial Intelligence”, “Machine Learning”, “Deep Learning”, “Computational Intelligence”, “Osteoporosis, Osteoporosis”, “Age-Related Bone Loss”, “Age-Related Bone Losses”, “Senile Osteoporosis”, and “Senile Osteoporosis”.
2.2. Inclusion Criteria and Screening Process
Our search focused exclusively on articles involving human subjects classified as meta-analyses, systematic reviews, and original studies. The titles and abstracts of the search results were carefully reviewed to identify relevant articles and to gain a comprehensive understanding of the topic and study designs. Following a thorough full-text evaluation of the selected articles, 39 studies were ultimately included according to the author's opinion. We selected the most recent and comprehensive articles. The methodology of this study is illustrated concisely in Figure 1.
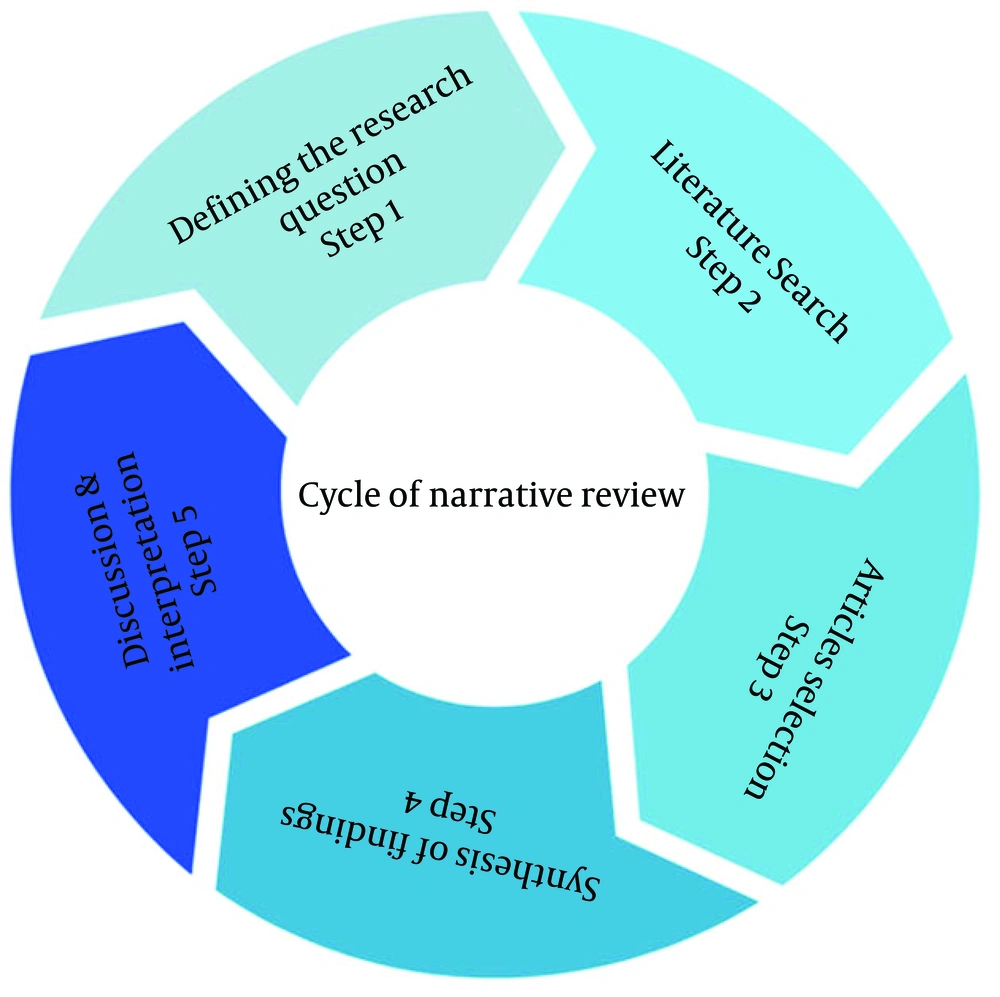
Figure 1.
Stages involved in composing a narrative review
3. Results
3.1. Artificial Intelligence Application for Screening and Diagnosis of Osteoporosis Based on Dual-energy X-ray Absorptiometry
Since dual-energy X-ray absorptiometry (DXA) of key skeletal sites, typically the lumbar spine and hip, has long been the gold standard for the classification and diagnosis of osteoporosis, early studies primarily focused on developing AI models to analyze DXA scans. Rahim et al. (22) conducted a systematic review evaluating ML algorithms for osteoporosis detection using hip DXA scans, finding a pooled sensitivity of 0.84 and specificity of 0.78 across studies. Their subgroup analysis revealed notable variations in sensitivity across algorithm types: Decision tree (DT) models achieved the highest sensitivity (0.94), while logistic regression (LR) showed the lowest (0.77). In contrast, their findings showed no statistically significant difference in the specificity of different ML algorithms (P = 0.308).
While DXA scans are precise, they have notable limitations. They only measure 2D areal BMD, missing details of bone microstructure and true volumetric density, which limits the accuracy (Acc) of fracture risk prediction. Moreover, DXA cannot distinguish between cortical and trabecular bone, limiting its predictive Acc. Soft tissue interference, especially in obese patients, can also affect the results (23, 24). Furthermore, DXA reference standards are mainly based on postmenopausal Caucasian women, making them less reliable for men and other ethnic groups. The requirement for expensive, specialized equipment also restricts access in rural and developing regions. For instance, India, with 140 million postmenopausal women — nearly half residing in rural areas — has only about 700 - 800 DXA devices nationwide (25). Additionally, DXA screening is significantly underused (26). To address these gaps, alternative imaging modalities and regions of interest are being investigated for opportunistic screening.
3.2. Artificial Intelligence Application for Screening and Diagnosis of Osteoporosis Based on Opportunistic Imaging
In this study, we classified the literature about osteoporosis opportunistic screening tools based on anatomical regions (Table 1). This helps determine which skeletal sites are most frequently studied, revealing underexplored regions where osteoporosis detection could be improved.
Table 1.
Artificial Intelligence Application for Screening and Diagnosis of Osteoporosis by Opportunistic Imaging
| Descriptive Characteristics | Model Characteristics | Results of the Best | |||||||
|---|---|---|---|---|---|---|---|---|---|
| Authors, y | Region | Sample Size, Female (%) | Dataset | Model | ROI and Imaging Modality | The Gold Standard | Training | Testing | External Validation |
| Fang et al., 2021 (27) | China | 1449, 55 | Clinical data and CT images, including the lumbar spine from 1 center | CNN (DenseNet-121) | Lumbar spine (L1 - L4), CT scan | QCT | NA | DOC 0.823 and 0.786 | DOC 0.782 |
| Tariq et al., 2023 (28) | United States | 4406, 65 | Demographic data and 6083 CT scans from 4 centers | CNN (DenseNet-121) | Coronal and axial views of L3 | DXA | NA | Fusion model: AUROC 0.86, Acc 79%, | Fusion model: AUC-ROC ranging between 0.84 and 0.92 |
| Sebro and De la Garza-Ramos, 2023 (29) | United States | 253, 63 | Cervical spine CT scans | RF, SVM, XGBoost, and Naive Bayes | C1-T1, clivus, and first ribs | DXA | NA | SVM: AUC 0.75 | SVM: Acc 0.81 |
| Mohammadi and Sebro, 2023 (30) | United States | 812, 84 | 2388 hand radiographs (PA, oblique, and lateral) of patients with osteopenia/osteoporosis from 1 center | CNN | Hand | DXA | Acc 94.37%, AUC 0.95 | Acc 82.00%, AUC 0.74 | NA |
| Oulhaj et al., 2017 (31) | NA | 174 | Anisotropic and isotropic features extracted from X-ray | SVM | Calcaneus | NA | NA | AUC 0.93 | NA |
| Nasser et al., 2017 (32) | France | 87 | Features extracted from bone X-ray images of both osteoporotic and control patients from 1 center | DL (a Stacked Sparse Autoencoder) and an SVM classifier | Whole body | NA | NA | Linear SVM: Acc 95.5% | NA |
| Wani and Arora, 2023 (33) | Singapore and India | 240, 55 | Knee X-rays and clinical factors from 2 centers and their branches | CNN (AlexNet, VggNet-16, ResNet, and VggNet-19) | Knee | QUS | Alexnet: Acc 91.1% | Alexnet: Acc 78.95% | NA |
Abbreviations: ROI, region of interest; CNN, conventional neural network; QCT, quantitative computed tomography; NA, not available; DOC, dice coefficient; CT, computed tomography; DXA, dual-energy X-ray absorptiometry; AUROC, area under receiver operating characteristic; Acc, accuracy; AUC, area under curve; RF, random forest; SVM, support vector machine; DL, deep learning; QUS, quantitative ultrasonography.
3.2.1. Hip and Spine
Many studies have focused on hip and spine images since these are the main skeletal sites to measure BMD and are frequently done in elderly patients. For example, Fang et al. proposed a fully automated deep convolutional neural network (CNN) for segmenting lumbar vertebrae computed tomography (CT) scans and osteoporosis detection. It is noticeable that the L4 vertebra was the most sensitive region for investigating osteoporosis in their model (27). Moreover, Tariq et al. used axial and coronal images from contrast-enhanced abdominopelvic CT scans at the L3 level combined with demographic data extracted from electronic medical records, including age, sex, body dimensions, etc., to train a CNN model for osteoporosis diagnosis. They compared four distinct models in their study: The EMR-based model, the CT-axial view-based model, the CT-coronal view-based model, and the fusion model. They found that the fusion of imaging and demographic information yielded the highest Acc in detecting osteoporosis [area under the receiver operating characteristic (AUROC): 0.86, Acc: 79] (28). Other studies have also developed AI models based on vertebral images ranging from the cervical region to the upper thoracic area. For instance, Sebro and De la Garza-Ramos examined cervical vertebral bodies, T1, clivus, and posterior thirds of the first ribs, as well as patients’ demographic data. The findings of their work showed that C3 was the most predictive cervical vertebra for osteoporosis, combined with patient demographics (29). It should be noted that DL models are more frequently used for image processing tasks and have shown better outcomes. A meta-analysis by Amani et al. evaluated the Acc of DL models trained on X-rays and CT scans of the spine and hip regions in the detection of osteoporosis. Their study showed a high pooled area under the curve (AUC), sensitivity, and specificity (0.94, 0.85, and 0.89, respectively) (34). Another study by Yen et al., which reviewed the Acc of DL algorithms on plain radiographs from different regions, showed similar results (35). These two studies demonstrated higher Acc for DL compared to ML techniques.
3.2.2. Chest
Chest X-rays and CT scans are valuable tools for opportunistic osteoporosis screening due to their widespread availability, routine clinical application, and incidental visualization of spinal structures. A systematic review and meta-analysis by Yamamoto et al. assessed the diagnostic performance of AI models trained by these modalities for osteoporosis diagnosis. Their findings indicated a sensitivity comparable to hip X-rays (0.83), but lower specificity (0.76). Additionally, the study concluded that chest X-rays showed higher sensitivity (0.83 versus 0.75) than chest CT scans, making them more effective for opportunistic osteoporosis screening (36).
3.2.3. Dental
Dental radiographs improve osteoporosis screening by providing a detailed assessment of bone architecture, including differentiation between trabecular and cortical bone, which DXA cannot adequately assess. Khadivi et al. reviewed the Acc of various AI models in osteoporosis diagnosis using dental images. In their study, AI models facilitated osteoporosis diagnosis by measuring various indices, including mental cortical width (MCW), Mandibular Cortical Index (MCI), Panoramic Mandibular Index (PMI), Computed Tomography Cortical Index (CTCI), mandibular ratio, and segment-based diagnosis. Their meta-analysis reported a pooled sensitivity of 0.85 and a pooled specificity of 0.95. Notably, conventional ML models demonstrated slightly lower sensitivity (0.82 vs. 0.87) but marginally higher specificity (0.96 vs. 0.92) compared to deep CNN models (37). Before this study, a meta-analysis by Calciolari et al. (38) identified the PMI with a cut-off value of 0.3 as the most sensitive indicator of decreased BMD. Additionally, the MCW Index proved to be a valuable tool for excluding high-risk patients with low BMD, as 90% of individuals with an MCW Index wider than 4 mm exhibited normal BMD values.
3.2.4. Extremities
Extremities imaging can also serve as an effective opportunistic screening tool. In a study by Mohammadi and Sebro (30), a CNN method was used to classify osteoporosis using hand X-rays, which showed promising results with an Acc of 82% and a sensitivity of 87%. Calcaneus imaging has been used in different studies. For example, in a survey by Oulhaj et al. (31), a support vector machine (SVM) reached an Acc of 91.3% and a sensitivity of 92.0%. Moreover, studies from Zheng et al. (39) and Nasser et al. (32) also reached promising results with accuracies of 90.9% and 95.5% using calcaneus images. On the other hand, Wani and Arora (33) used knee X-rays to detect osteoporosis, which achieved an Acc of 91%.
3.3. Artificial Intelligence Application for Bone Mineral Density Prediction
Epidemiologic studies have shown that only about 21% of individuals who have suffered osteoporotic fractures had previously undergone BMD assessment or received treatment for low BMD, highlighting a significant gap in preventive care (40). Early intervention, when initiated based on timely BMD prediction, has been associated with reducing the risk of fragility fractures and improving BMD status (41). Since the introduction of AI into medical imaging, numerous studies have leveraged AI techniques to estimate BMD across a variety of imaging modalities, subsequently using these measurements to evaluate osteoporosis risk (Table 2). The AI-driven methods have been applied to analyze X-ray images, CT scans, DXA, and clinical or demographic datasets. This section systematically categorizes studies on AI tools for BMD prediction according to their training data sources and imaging modalities.
Table 2.
Artificial Intelligence Application for Bone Mineral Density Prediction
| Descriptive Characteristics | Model Characteristics | Results of the Best | |||||||
|---|---|---|---|---|---|---|---|---|---|
| Authors, y | Region | Sample Size, Female (%) | Dataset | Model | ROI and Imaging Modality | The Gold Standard | Training | Testing | External Validation |
| Zhou et al., 2025 (42) | China | 453 | Biplanar X-ray images and clinical information from 1 center | Hybrid DL framework | L1-L3 | QCT | NA | AUC 0.97, Acc 93%, sensitivity 0.84, specificity 0.96, and F1 score 0.93 | NA |
| Sato et al., 2022 (43) | Japan | 17899, 84 | Chest X-rays, age, and sex of the patient from 6 centers | DL (ResNet-50) | Chest | DXA | NA | AUC: 0.84, Acc: 76%, sensitivity: 0.81, specificity: 0.73 | NA |
| Hsieh et al., 2021 (44) | China | 5164 hip X-ray ,77%, and 18175 spine X-ray patients, 79% | 10797 hip X-rays and 25482 spine X-rays, age, and sex of patients from 7 centers | DL (VGG-16) | Hip (bilateral) and lumbar spine (L1-L4) | DXA | NA | Hip: Acc 91.7%, sensitivity 0.80, and specificity 0.94; spine: Acc 86.2%, sensitivity 0.83, and specificity 0.88 | Hip: AUROC 0.96, Acc 91.4%, sensitivity 0.78, and specificity 0.94; spine: AUROC 0.92, Acc 87.6%, sensitivity 0.80, and specificity 0.90 |
| Lee et al., 2020 (45) | Korea | 334, 30 | X-ray features | VGGnet, AlexNet, Inception-V3, and ResNet-50 with SVM, KNN, and RF classifiers | Spine X-ray (L4) | DXA | VGGnet and RF: AUC 0.74, Acc 65%, sensitivity 0.69, specificity 0.62, and F1-score 0.66 | VGGnet and RF: AUC 0.74, Acc 71%, sensitivity 0.81, specificity 0.60, and F1-score 0.73 | NA |
| Tseng et al., 2024 (46) | Taiwan | 5122, 78 | X-ray features | DenseNet-121 was used to develop a DL model (VeriOsteoTM OP) | T12-L1 in chest X-ray images | DXA | NA | AUC 0.94, Acc 84.5%, sensitivity 86.2%, and specificity: 83.8% | AUC 0.94, Acc 89%, sensitivity 0.88, and specificity 0.89 |
| Pan et al., 2020 (47) | China | 574: 200 for training and 374 (47) for testing | Low-dose chest CT features | 3D CNN (U-net) | T1-L2 | QCT | NA | AUC 0.92, sensitivity 0.85, and specificity 0.99 | NA |
| Peng et al., 2024 (48) | China | 1219 | CT features | VB-Net and DenseNet | L1-L3 in lumbar and abdominal CT | QTC | AUC 0.99, F1 score 0.98, and Acc 98% | AUC 0.97, F1 score 0.90, and Acc 90% | AUC 0.93, F1 score 0.79, and Acc 81% |
| Xu et al., 2025 (49) | China | 48.8% | CT features | A multi-stage DL model | T11-L4 vertebrae on CT | QCT | NA | Acc 91% | NA |
| Yasaka et al., 2020 (50) | Japan | 278 (60), 1665 CT images | Axial CT images | CNN | L1-L4 | DXA | NA | AUC 0.96 | AUC 0.97 |
| Breit et al., 2023 (51) | Switzerland | 109, 82.5 | CT features | CNN | Chest CT | DXA of the hip and spine | NA | Acc 75%, sensitivity 0.93, and specificity 0.61 | NA |
| Park et al., 2024 (52) | Korea | 420 patients, 442 CT (159 chest, 156 abdominal, and 107 lumbar spine) from 2 centers | CT features | DL (2D U-Net) | T12-L2 vertebral bodies from chest, abdomen, and lumbar CT | DXA | NA | AUC 0.77 sensitivity 0.65, specificity 0.70, and Acc 69.7% | NA |
| Kang et al., 2022 (53) | Korea | 547, 51 | CT features | CNN (U-Net) | L1 from chest, abdominal, or spine CT | DXA | NA | Acc 86%, specificity 0.79, sensitivity 0.93, and F1 score 0.87 | NA |
| Ruhling et al., 2022 (54) | Germany | 193, 25% | CT features | 2D DenseNet with random slice selection, 2D DenseNet with anatomy-guided slice selection, and 3D DenseNet | Abdominal CT | NA | NA | 2D DenseNet with anatomy-guided slice selection: Acc 98%, F1 score 0.98 | Public dataset: Acc 94%, F1 score 0.93 |
| Tang et al., 2021 (55) | China | 213, 82 | CT features | CNN (MS-Net and BMDC-Net) | L1 on chest CT | DXA | NA | AUC 0.92, Acc 76.6% | NA |
| He et al., 2025 (56) | China | 1182, 100 | Age, BMI, race, smoking, serum calcium, serum cholesterol, etc. | DTR, RFR, SVR, etc. | NA | DXA | RFR: R2 0.218 | NA | NA |
| Inui et al., 2023 (57) | Japan | 2541, 100 | Age, BMI, and blood test data | LR, DT, RF, GBT, and LightGBM | NA | NA | GBT: Acc 83%, AUC 0.96 | NA | NA |
Abbreviations: ROI, region of interest; DL, deep learning; QCT, quantitative computed tomography; NA, not available; AUC, area under curve; Acc, accuracy; DXA, dual-energy X-ray absorptiometry; AUROC, area under receiver operating characteristic; SVM, support vector machine; KNN, k-nearest neighbors; RF, random forest; CT, computed tomography; CNN, conventional neural network; BMI, Body Mass Index; DTR, decision tree regressor; RFR, random forest regressor; LR, logistic regression; DT, decision tree; GBT, gradient boosting tree.
3.3.1. Computed and Quantitative Computed Tomography
Recent research underscores the role of AI in predicting BMD from CT imaging, a promising alternative to traditional DXA scans. For example, a CNN model using axial views of lumbar vertebrae CT scans with DXA as reference data achieved exceptionally high diagnostic performance, with AUCs of 0.96 - 0.97 in internal and external validations on a total of 95 patients. This study also showed that the BMD estimates generated by the CNN were strongly correlated with actual DXA values (50). Kang et al. introduced an explainable AI model that utilized L1 vertebral axial cuts from CT scans, cross-referenced with DXA data, to predict BMD across chest, abdominal, or spine CTs containing a complete L1 axial cut (53). Similarly, Pan et al. leveraged low-dose CT for opportunistic BMD prediction and osteoporosis screening in patients who underwent CT and quantitative computed tomography (QCT) for lung cancer screening. Their model demonstrated an AUC of 0.94, a sensitivity of 99.68%, and a specificity of 98.08% (47). Other groups have explored more advanced DL architectures for BMD prediction. Xu et al. used a multi-stage DL approach with transfer learning (TL), reporting consistent accuracies of 0.88 to 0.91 across three different datasets of CT and QCT images (49). Studies combined a segmentation CNN (MS-Net) and a classification network (BMDC-Net) on 2D CT slices, achieving 76.65% Acc and 0.916 AUC for BMD estimation (44). These studies collectively highlight that AI-driven approaches, particularly those based on DL, can accurately and efficiently estimate BMD from standard CT scans.
3.3.2. X-rays
Several studies have shown that the prediction of BMD from plain X-rays by AI can be a practical and scalable alternative to traditional DXA scans. A recent study developed a neural network to predict BMD by analyzing paired chest X-ray images and DXA scans filtered by t-score criteria. Preclinical trials demonstrated strong performance (AUC: 0.940, 84.5% Acc), while clinical validation achieved even higher reliability (AUC: 0.946, 89% Acc). Approved by a national regulatory agency, this tool shows significant potential for BMD prediction, offering precise sensitivity (88.7%), specificity (89.4%), and positive and negative predictive values (91.7% and 85.7%), to streamline osteoporosis diagnostics (46). Beyond this, some models incorporate patient demographics such as age and sex alongside X-ray features to improve classification by t-score, though their predictive power can be limited by the scope of features used (43). Another study used spine X-ray images to develop a DL model for BMD prediction. Image features were analyzed with a VGGnet model, and then they were classified into normal or abnormal BMD with a random forest (RF) algorithm. Their goal was to use simple spine X-rays to identify the high-risk population with abnormal BMD (45). Hsieh et al. used the VGG-16 neural network to automate BMD measurement and fracture risk assessment from hip and lumbar spine X-rays, achieving high Acc, sensitivity, and specificity for both sites (91.7% Acc, 80.2% sensitivity, and 94.9% specificity for hip, and 86.2% Acc, 83.5% sensitivity, and 88.3% specificity for spine). Their model also classifies 84.8% of osteoporosis patients with a 95% positive and negative predictive value in comparison to DXA (44).
3.3.3. Clinical Data
Recent research has also explored the use of ML models trained solely on clinical and laboratory data to predict BMD. He et al. developed a random forest regressor (RFR) model that predicts BMD using patient clinical information, omitting the need for imaging altogether. Their model, trained on data from elderly men, delivered strong results with an R2 of 0.712, a mean squared error of 0.005, and a root mean squared error of 0.072. However, because the training data included only male patients, the model’s clinical applicability remains limited to that demographic (56). Similarly, Inui et al. created five different ML models — including DT, LR, gradient boosting, RF, and LightGBM — using variables such as age, BMI, and routine blood test results. Among these, the LightGBM model performed best, achieving an Acc of 83.4% and an AUC of 0.961. Their analysis highlighted age, BMI, platelet count, and ALT as the most important predictors of low BMD. Yet, this model was developed exclusively with data from elderly women, which again restricts its generalizability (57).
3.4. Artificial Intelligence Application in Risk Prediction and Detection of Osteoporotic Fractures
The aging of the global population has precipitated a significant increase in osteoporotic fractures, the most common complication of osteoporosis (58). These fractures represent a critical public health challenge, characterized by substantial clinical and economic implications (8). Fracture risk assessment is a crucial preventive strategy, as identifying high-risk individuals allows healthcare systems to implement proactive treatment protocols to preserve bone health and minimize fracture risk. The fracture risk assessment tool (FRAX), one of the most validated fracture risk assessment methods, predicts 10-year probabilities of hip or major fractures by analyzing BMD measurements and selected clinical risk factors. However, exclusive reliance on femoral neck BMD obtained with DXA and QCT techniques and incomplete risk factor integration may lead to limited and suboptimal risk calculations. Emerging AI predictive models represent a promising technological solution, offering advanced computational capabilities to process complex, multivariable datasets and overcome traditional assessment limitations. Furthermore, it is assumed that AI-based diagnostic systems can address critical challenges in osteoporotic fracture detection. Current clinical standards require multidisciplinary efforts between different specialties, leading to a significant proportion of vertebral osteoporotic fractures not being detected at the time of injury and left untreated (59). In this section, several studies regarding AI applications in the prediction and diagnosis of osteoporotic hip and vertebral fractures are reviewed and summarized in Table 3.
Table 3.
Artificial Intelligence Application in Risk Prediction and Detection of Osteoporotic Fractures
| Descriptive Characteristics | Model Characteristics | Results of the Best | ||||||||
|---|---|---|---|---|---|---|---|---|---|---|
| Authors, y | Region | Aim | Sample Size, Female (%) | Dataset | Model | ROI and Imaging Modality | The Gold Standard | Training | Validation | External Validation |
| Engels et al., 2020 (60) | Germany | Osteoporotic HF prediction without BMD within 4 y f/u | 288086, 48.8 | Administrative claims data: Age, gender, prior fracture history, and medication | LR, RF, SVM, RUSBoost, XGBoost, and super learner | NA | Hospital admission with a diagnosis of HF within 4 y f/u | XGBoost, AUC 0.725 | LR, AUC 0.704 | NA |
| Kruse et al., 2017 (61) | Denmark | Osteoporotic HF prediction within 5 y f/u | 5439, 86.8 | A national dataset including 74989 predictors: DXA-derived BMD, comorbidity, medication use, biochemistry data, etc. | 24 ML including LR, RF, XGBoost, KNN, BagFDA, etc. | NA | Hospital admissions or ER visits where the ICD10 code defined hip and/ or femoral region fractures recorded within 5 y of f/u | NA | Female: bagFDA, AUC 0.92; male: XGBoost, 0.89 | NA |
| Li et al., 2023 (62) | China | Osteoporotic HF prediction without BMD within 10 y f/u | 161051, 57; external validation: 3046, 66.9 | CDARS records include 232 predictors: Age, past medical history, medication, etc. | LR, GBM, RF, XGBoost, and single-layer NN | NA | Hospital admissions or ER visits where the ICD-9-CM code defined hip and/or femoral region fractures were recorded within 10 y f/u | Female: RF, AUC 0.996; male: RF, AUC 0.996 | Female: LR, AUC 0.815; male: LR, AUC 0.818 | Female: LR, AUC 0.815; male: LR, AUC 0.898 |
| Kong et al., 2022 (63) | Korea | Osteoporotic VF prediction by spinal X-rays within 5 y f/u | 1595, 74.4 | Data from a 5-year cohort in one center, including AP and lateral spine X-rays and clinical data (age, sex, BMI, glucocorticoid use, and secondary osteoporosis) | DL (DeepSurv) | L1-L5 vertebral bodies | FRAX and a built proportional hazard model | Deepsurv: C-Index ranging from 0.740 to 0.764 | Deepsurv: C-Index ranging from 0.612 to 0.614 | NA |
| Ulivieri et al., 2021 (64) | Italy | Osteoporotic VF prediction by DXA and BSI within 4 y f/u | 174, 100 | Data from a multi-center cohort including spinal X-rays, lumbar and femoral DXA for BMD and BSI | ANN | NA | AP and/or lateral spinal X-ray at the beginning and at the end to investigate the presence of VFs | Sensitivity 0.785, specificity 0.817, Acc 80%, and AUC 0.82 | Sensitivity 0.798, specificity 0.783, Acc 79%, and AUC 0.80 | NA |
| Ryu et al., 2023 (65) | Korea | Diagnosis VF using lateral lumbar spine X-rays | 1102 patients with VF, 1171 controls | Data from one center, including 2273 lateral lumbar spine radiographs | DL (multitask learning with U-Net) | L1-L5 vertebral bodies | Human radiological reports on lumbar spine radiographs; fracture/non-fracture | NA | Per patient: Acc %92, sensitivity 0.944, specificity 0.917, and AUROC 0.953; per vertebrae: Acc %94, sensitivity 0.628, specificity 0.977, and AUROC 0.861; fracture level: Acc %96 | Per patient: Acc %71, sensitivity 0.979, specificity 0.447, and AUROC 0.779; per vertebrae: Acc %82, sensitivity 0.937, specificity 0.820, and AUROC 0.906; fracture level: Acc %94 |
| Li et al., 2021 (66) | Taiwan | Diagnosis VF using lateral lumbar spine X-rays | 941, 70 | Data from one center, including 941 lateral lumbar spine radiographs, 1101 vertebrae with VFs, and 6358 normal vertebrae | TL and CNN | T7-L5 vertebral bodies | Human interpretation of CT or MRI scans for VF diagnosis | NA | Acc %92, sensitivity 0.91, and specificity 0.93 | Acc %89, sensitivity 0.83, and specificity 0.95 |
| Biamonte et al., 2022 (67) | Italy | Extracting radiomic features from lumbar spine CT to diagnose VF | 240, 45.83 | 93 radiomic features extracted from the lumbar spine CT of a single center | SVM and pyradiomics library | L1-L5 vertebral bodies | An experienced clinician assessed T4-L5 VF on spinal CT or lateral X-rays | ROC 0.839 | ROC 0.789 | NA |
| Del Lama et al., 2022 (68) | Brazil | Extracting radiomic features from lumbar spine MRI to diagnose VF | 61, with 189 spinal MRI windows obtained by segmentation | 106 radiomic features and raw images from spinal MRIs with VF and clinical information of patients from one center | CNN, MLP, and pyradiomics library | L1-L5 vertebral bodies | A board-certified radiologist with 17 y of experience classifying vertebral bodies | NA | ROC ranging from 0.90 to 0.98 | NA |
Abbreviations: HF, hip fracture; BMD, bone mineral density; f/u, follow-up; LR, logistic regression; RF, random forest; SVM, support vector machine; RUSBoost, random under-sampling boost; XGBoost, extreme gradient boosting; NA, not available; AUC, area under the curve; DXA, dual-energy X-ray absorptiometry; ML, machine learning; KNN, k-nearest neighbors; BagFDA, bootstrap aggregated flexible discriminant analysis; CDARS, clinical data analysis and reporting system; GBM, gradient boosting machine; VF, vertebral fracture; DL, deep learning; FRAX, fracture risk assessment tool; ANN, artificial neural network; BSI, Bone Strain Index; Acc, accuracy; AUROC, area under the receiver operating characteristic curve; TL, transfer learning; CNN, convolutional neural network; CT, computed tomography; MLP, multi-layer perception.
Over the past decade, ML models for osteoporotic fracture prediction have become a significant research domain. One of the pioneers in this field was a survey by Kruse et al., which provided comparisons of different ML models' performance for hip osteoporotic fracture prediction and utilized an extensive set of features derived from a large Danish national dataset, including both BMD and clinical information. A key strength of their study was conducting feature importance analysis and removing near-zero variance features. They found that when their best models were limited to a refined set of high-ranked features, they exhibited comparable performance to more complex, untuned models. Their findings suggest that strategic feature selection can maintain predictive performance, and model expansion should only be pursued when performance has not reached a ceiling (61). However, given the practical limitations of widespread DXA tests and BMD measurements, research has increasingly focused on clinical records and alternative imaging modalities, such as X-rays, for ML-based osteoporotic fracture prediction. While some studies have explored newer and more complex algorithms for this purpose, these often showed limited performance improvements over older ones when using clinical records (60). For example, in a retrospective cohort study, the LR model demonstrated superior discrimination (AUC ranging from 0.815 to 0.898) compared to four other newer ML algorithms, all trained on 395 features retrieved from the clinical data of 161,051 individuals (62). This highlights the importance of selecting the most suitable algorithm based on specific tasks and data characteristics. In clinical predictor-based models, LR and DT are predominantly utilized, whereas imaging-based predictions increasingly leverage DL technologies (69). A notable longitudinal study by Kong et al. comparing a CNN model with conventional FRAX risk assessment demonstrated the potential of advanced DL approaches, with the DeepSurv model significantly outperforming traditional risk calculation methods (C-Index 0.612 vs. 0.547) (63). The large number of studies in the field of osteoporotic fracture prediction in recent years has led to systematic reviews and valuable meta-analyses. A meta-analysis by Wu et al. on ML performance to predict the risk of vertebral and hip osteoporotic fractures revealed pooled C-indices ranging from 0.73 to 0.87 in 66 training and 32 validation sets. However, significant methodological heterogeneity and statistical bias in their included studies necessitate cautious interpretation of the results and the need to develop standardized reporting guidelines for risk prediction studies at the time (69).
A multitude of studies have evaluated the application of AI for osteoporotic fracture detection. A recent meta-analysis of 11 studies by Li et al. found that ML achieved a sensitivity of 0.93 and specificity of 0.96 in diagnosing osteoporotic vertebral fractures. Subgroup analysis showed that DL and X-ray-based techniques particularly excelled, showing near-perfect summary receiver operating characteristic (SROC) curves of 0.99 (70). In another meta-analysis, AI demonstrated remarkable diagnostic capabilities for osteoporotic vertebral fractures with a pooled AUROC of 0.92 (71). Ryu et al. developed a multi-task DL model for vertebral segmentation and the detection of osteoporotic vertebral fractures and fracture level simultaneously in lateral lumbar spine X-rays, without dependence on adjacent vertebral bodies, capable of assisting radiologists in real-life imaging readings. The model achieved impressive performance metrics, with an AUC of 0.906 when evaluating fractures per patient and an AUC of 0.826 when evaluating fractures per vertebral body (65). Another study revealed AI’s superior diagnostic precision and its ability to speed up the imaging reading process in comparison to human observers, with inter-observer reliability kappa values ranging from 0.72 to 0.77 across thoracic and lumbar vertebrae, and a 90-second reading process (66). The emerging field of radiomics has further enhanced the extraction of predefined quantifiable texture features from medical imaging, enabling sophisticated ML models to identify subtle indicators of vertebral fragility. Biamonte et al. conducted radiomics analysis on lumbar spine CT images and identified radiomics features associated with altered trabecular microarchitecture to develop an ML model reaching high levels of AUROC for vertebral fracture detection (67). Notably, a study suggested that integrating diverse data sources — including CNN-extracted features, radiomics, and clinical data — can significantly improve vertebral fracture classifier Acc, presenting a promising paradigm for advanced diagnostic strategies (68). Overall, different strategies such as using more diverse high-quality data, engineering relevant features, optimizing hyperparameters, rigorous validation, and sensitivity analyses are widely implemented to further enhance AI models’ performance.
4. Discussion
This is a broad review of the latest AI applications in managing osteoporosis, focusing on three main areas: Osteoporosis diagnosis and classification, BMD prediction, and prediction and detection of osteoporotic fractures. There are several performance metrics that were used in the included studies. Below, you can find how to interpret and when to use each metric’s results.
1. The AUROC: One of the most widely used measures of a model’s discriminative ability; AUROC is an estimate of the trade-off between sensitivity (true positive rate) and 1-specificity (false positive rate) for numerous different thresholds of classification, with higher values near 1 indicating improved separation between classes. The AUROC was commonly employed throughout the reviewed studies to quantify general model performance, particularly in diagnostic prediction or binary classification tasks.
2. The AUC: Often used interchangeably with AUROC in this kind of study, but occasionally referring to other curves (e.g., precision-recall), depending on what the study is analyzing.
3. Accuracy: The proportion of accurate predictions
4. Sensitivity: True positive rate capture, essential to accurately identify the positive cases
5. Specificity: Indicates the actual negative rate, crucial in properly classifying negative cases
6. F1 score: Harmonic mean of recall and precision, particularly for datasets with class imbalance. Higher values near 1 indicate better results (72).
Although AI has shown promising performance across these areas, several critical factors must be considered. Firstly, a variety of techniques, including data preprocessing, feature engineering, advanced model architectures, etc., have been employed in the included studies to improve the performance of models. However, this diversity in methodologies makes it challenging to compare different models. It also highlights the need for healthcare professionals and researchers to continuously update their knowledge of advancements in the ML field (73). Secondly, in this review, some studies relied on opportunistic datasets that often contained poor-quality and missing data. While data augmentation methods, such as oversampling and undersampling, were commonly employed, single-center studies frequently lacked population diversity, leading to potential biases in results. To overcome these limitations, multi-center collaborations are vital for pooling diverse datasets that more accurately reflect real-world conditions and enhance the generalizability of ML models (74).
Thirdly, the lack of transparency in documenting the utilized datasets and model development process remains a significant obstacle to comparing and validating studies. To address this issue, the introduction of standardized reporting checklists is essential. Such tools also allow future researchers to build upon existing work more effectively (75). A notable review by Smets et al., which evaluated the reporting and methodological quality of studies on AI applications for osteoporosis up to December 2020, used a simplified version of the minimum information about clinical artificial intelligence modeling (MI-CLAIM) checklist. Their findings revealed a wide range of study quality, with most studies rated as moderate. One of the most commonly identified issues was the lack of reporting on the choice of models used (76). It should be noted that understanding each ML model’s logical assumptions, strengths, and limitations is indispensable to ensure that the chosen models are well-suited to their intended purposes.
Fourthly, evaluating the performance of ML models in clinical settings requires careful selection of metrics tailored to the specific task. For example, regression tasks like assessing BMD often use metrics such as mean absolute error (MAE) and mean square error (MSE) to measure the precision of continuous value predictions (56). On the other hand, classification and prediction tasks typically rely on the AUC to evaluate how well a model distinguishes between classes (77). Moreover, relying on a single metric is insufficient. Instead, many studies adopt multiple performance metrics to account for task complexity, data imbalance, and clinical implications such as false positives or negatives (78). Furthermore, using an established reference standard as a benchmark allows for an objective assessment. In osteoporosis research, BMD measurements obtained through DXA and QCT or fracture risk predictions from FRAX could serve as the standard benchmarks for comparison.
Fifthly, validation methods like cross-validation and external validation are essential for assessing a model’s robustness. Another review, conducted three years later as an update to Smets et al.’s work, showed improvements in study quality, largely due to better validation practices and more frequent use of external validation (76). This progression highlights a growing methodological sophistication in AI research. However, our review showed that external validation was notably absent in most studies included. Finally, ensuring that ML models are interpretable is crucial for their successful adoption in clinical practice and for building trust in the reliability of AI-driven decisions (53). To improve interpretability, some studies have utilized techniques such as model-agnostic explanation tools, explainable AI methods, and sensitivity analysis.
The increasing interest in this field has led to several systematic reviews and meta-analyses in recent years, focusing on specific ML models (e.g., DL), particular applications (e.g., diagnostic Acc, fracture classification, etc.), or specific data types (e.g., CT scans or X-rays). These specialized studies provide deeper insights into AI’s role in targeted aspects of osteoporosis care and have been incorporated into various sections of this research to enrich findings.
This review has several limitations. First, the search strategy was confined to PubMed, Scopus, and Google Scholar, potentially excluding relevant studies from other databases. This restricted scope may have resulted in an incomplete overview of the current state of AI applications in osteoporosis. Second, while the performance metrics were summarized in tables, these summaries primarily emphasized the best-performing results. This selective reporting may not fully capture the variability or limitations in model performance observed across different studies, potentially leading to an incomplete understanding of the strengths and weaknesses of AI models in this field. Lastly, the assessment of study design and reporting quality was conducted without the use of a standardized checklist, relying instead on the subjective judgment of the authors. This approach may introduce variability in how studies were evaluated.
In conclusion, this review highlights the promising potential of AI in the management of osteoporosis. While AI has demonstrated remarkable promise in this field, it is a relatively nascent area of research. Consequently, further studies are needed to address current limitations and refine AI methodologies.