


1. Background
Varicocele is a treatable cause of male infertility (1). Varicocele, characterized by an anomalous enlargement and winding of the pampiniform plexus of veins, veins that drain the testis, is present in approximately 15% of the overall population and exhibits a pronounced preference for the left side (2). Varicoceles are one of the main risk factors for male infertility, which is present in both primary and secondary infertility, with an estimated prevalence of 50% and 81%, respectively (3). Between 60 and 80 million individuals globally experience infertility at a certain stage in their lives, affecting approximately 8% to 12% of all couples (4). Varicocele is a multifactorial disorder, involving multiple anatomical, physiological, and genetic factors that contribute to its onset and impact on males (5). Ultrasound has been established as the imaging modality of choice for diagnosing varicoceles (6-8). Its high accuracy in evaluating the vascular anatomy of the spermatic cord has solidified its position as the gold standard in this field. Physical examination is the initial diagnostic method for varicocele (9). Color Doppler ultrasonography can confirm the diagnosis and provide further information regarding the presence of venous reflux and venous diameter (6-8). Following the classification system established by Dubin and Amelar in 1970, varicoceles are clinically diagnosed and categorized into three grades of severity (10). Varicoceles can be classified into three grades based on clinical examination. A Grade 1 varicocele is only palpable within the scrotum during the Valsalva maneuver while standing. A Grade 2 varicocele is palpable even at rest while standing, and a Grade 3 varicocele is sufficiently large to be visible through the scrotal skin.
Varicocelectomy is justifiable due to its ability to improve hormonal and semen parameters, thereby increasing fertility rates and success rates in assisted reproduction (1). Magnification during varicocelectomy with preservation of testicular vessels has been associated with improved semen parameters and reduced complications (11). Numerous studies have highlighted the utility of surgical microscopes and loupes in magnifying the surgical field (12). However, the requirement for the use of papaverine persists (12). Although the operating microscope is considered the gold standard for performing varicocelectomy, its use is costly, not readily available in many healthcare settings, time-consuming, and requires a high level of surgical expertise and experience (13). The objective of varicocelectomy is to improve spermatogenesis in infertile men with clinical varicocele and impaired semen quality, or to alleviate symptoms in symptomatic patients (14). However, only 35 - 50% of men undergoing varicocele treatment experience improvements in semen parameters, while the remainder may not respond favorably due to varicocele recurrence, underlying genetic abnormalities, or surgical complications (15). An ideal varicocelectomy procedure should yield the best outcomes with minimal complications (16). Varicocele has been shown to have a significant impact on semen quality and male infertility. To date, no study has specifically compared the effects of papaverine and hydrodissection. Therefore, this study was conducted to compare these two methods to investigate the improvement of sperm parameters following open varicocelectomy.
2. Objectives
Access, enlargement, and dissection of the spermatic cord vessels in varicocelectomy have always been a topic of discussion because postoperative complications due to damage to the testicular artery and intraoperative vascular spasm lead to post-surgical outcomes. Therefore, this study was conducted to investigate the interventional effect of papaverine and hydrodissection of the spermatic cord with the aim of enlarging and providing easier access to the vessels and thus improving sperm parameters.
3. Methods
3.1. Study Design and Settings
This prospective randomized clinical trial was conducted at Shahid Beheshti Specialty Hospital and Ofogh Clinic in Iran's Hamadan province without blinding (IRCT20240916063070N1 on 2024-6-30). The study enrolled patients from April to July 2023 through the convenience sampling procedure. Participants were randomized into three groups (A, B, and C) using a block randomization design with six blocks. Participants per block, resulting in an equal allocation ratio of 1:1:1 across the groups.
Group A: Varicocelectomy with open inguinal approach without intervention;
Group B: Varicocelectomy with open inguinal approach with Papaverine solution, 40 mg/mL;
Group C: Varicocelectomy with open inguinal approach with Papaverine solution, 40 mg/mL, and hydrodissection.
The number of patients participating in this study was 114 patients who presented with primary infertility associated with varicocele. Baseline characteristics, including age, BMI, varicocele grade, and employment status, were reported for all groups. While age was comparable between groups, BMI, varicocele grade, and employment status showed significant differences and were considered in subsequent analyses.
A follow-up was carried out by clinical examination and Doppler ultrasonography to detect any postoperative complications for three months. The manuscript was prepared following the integrated standards outlined in the CONSORT (Consolidated Standards of Reporting Trials) guidelines (17).
3.2. Sample Size Calculation
An extensive search of the literature did not yield any similar studies investigating the outcomes of using papaverine in the treatment of varicocele. Therefore, the researchers utilized data from patients who had undergone surgery in the previous months at Shahid Beheshti Hospital, Hamedan. Approximately 10% of patients who received papaverine and 40% of those who did not experience recurrence. Considering these parameters, a power of 80% and a type I error rate of 0.05, the required sample size for each group was calculated to be 38 using the following formula.
3.3. Inclusion and Exclusion Criteria
3.3.1. Inclusion Criteria
Impaired semen parameters: Primary varicocele; left-sided varicocele; patients who presented with infertility and a low sperm count following a semen analysis; sexually active male patients.
3.3.2. Exclusion Criteria
Previous surgery: Varicocelectomy; associated diseases (hydrocele, hernia).
3.4. Surgical Technique
The same surgeon performed all procedures. A patient underwent spinal or general anesthesia according to the surgeon and anesthetist's decision. Then, a three-cm skin incision was made transversely over the external inguinal ring. This incision dissected the Camper's and Scarpa's fascia to reach the spermatic cord, which was situated over a Penrose drain using Babcock forceps. These veins were tied by 3-0 or 2-0 silk sutures according to the size of ligated veins and sparing the artery with assistance.
3.4.1. Intervention B
In group B, papaverine was employed to identify the pulsating arteries using saline injection introduced directly into the cord by an insulin syringe with a needle (Figure 1).
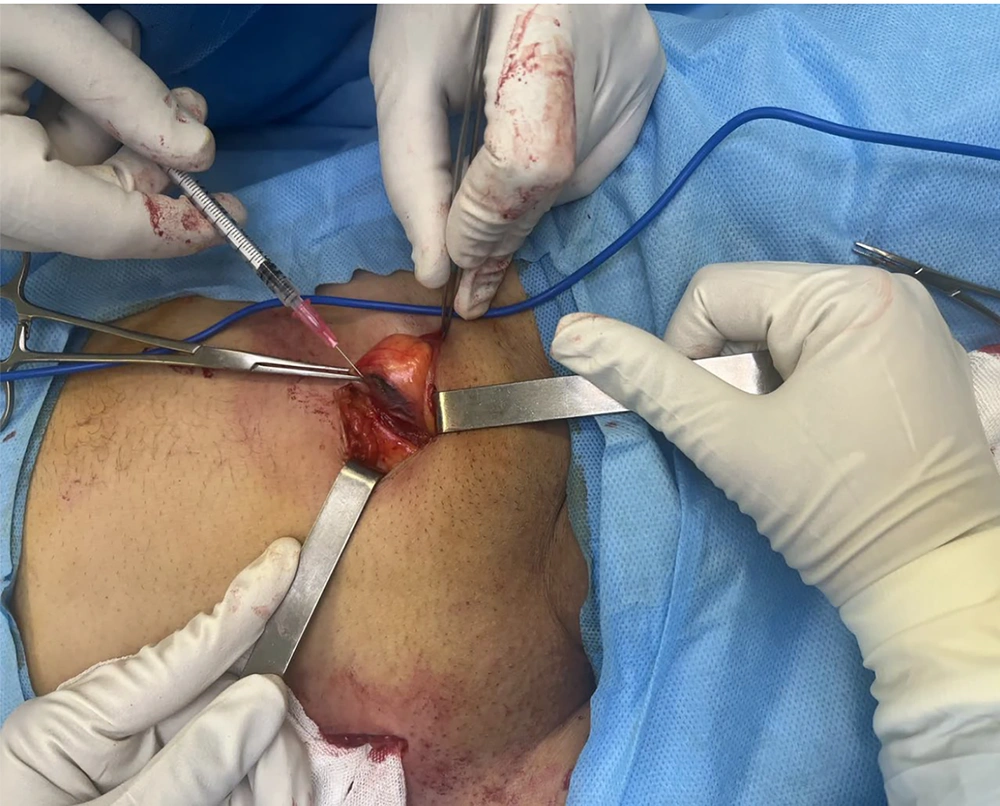
Figure 1.
Papaverine injection
3.4.2. Intervention C
In group C, papaverine and hydrodissection were employed to identify the pulsating arteries using saline injection introduced directly in the cord by syringe without a needle (Figure 2).
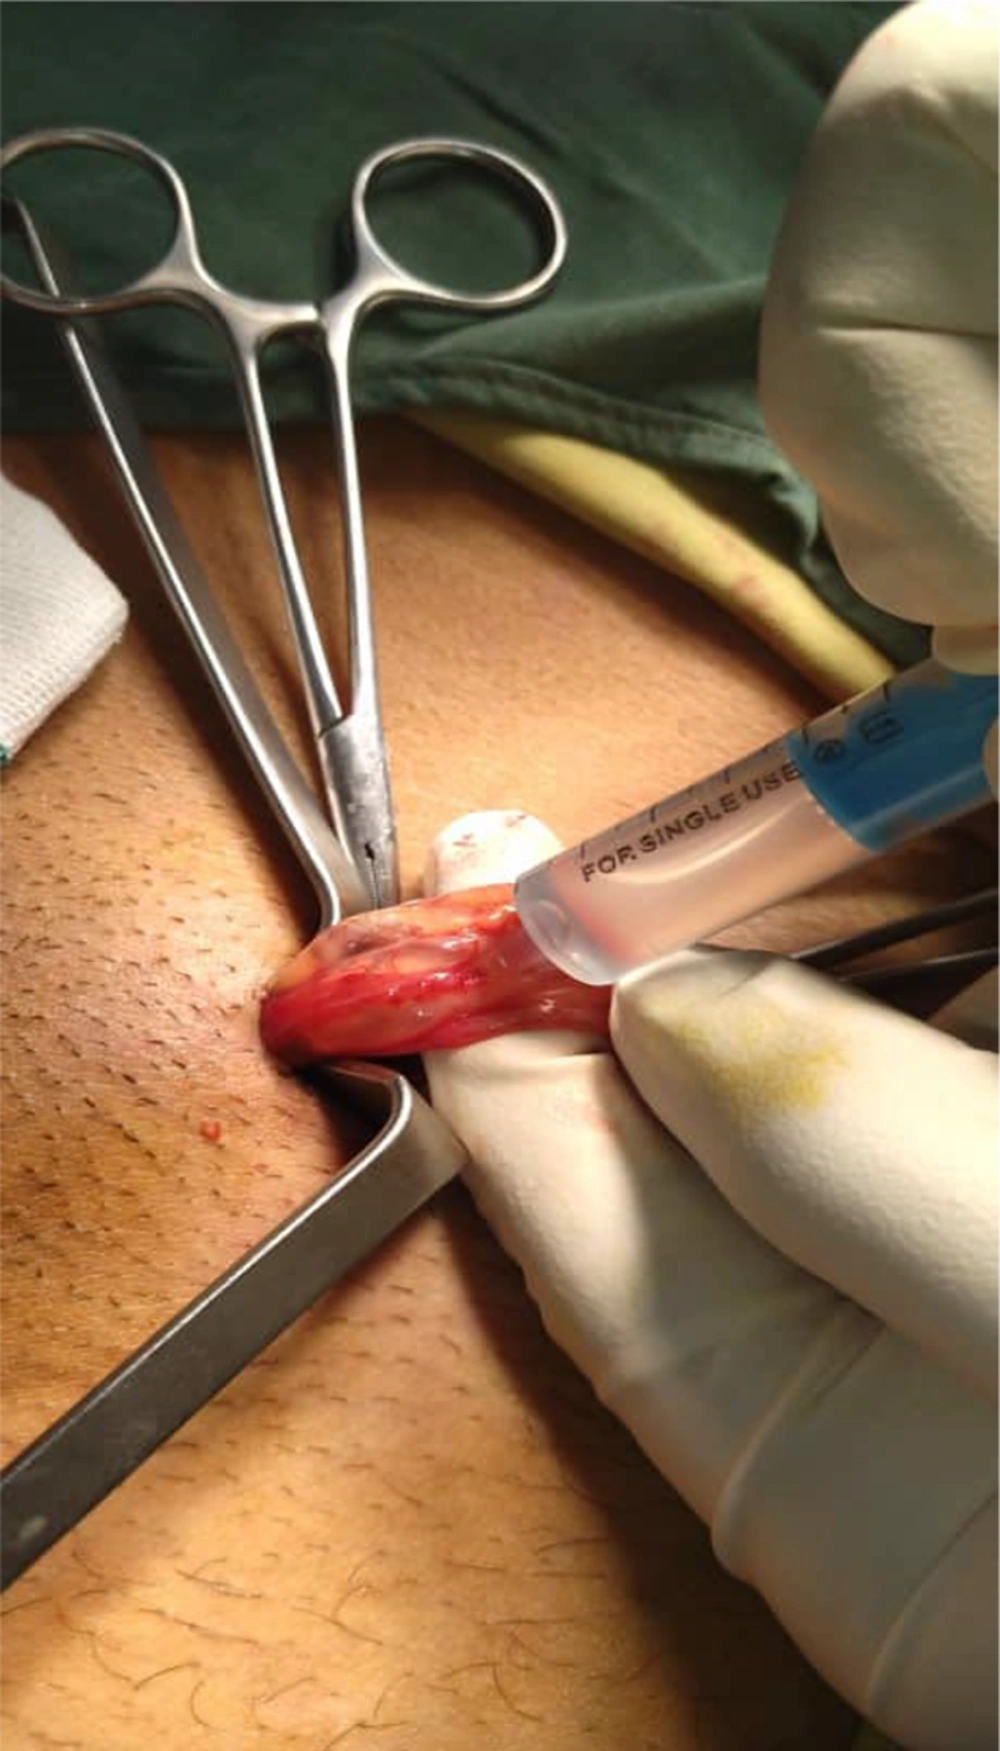
Figure 2.
Hydro dissection and papaverine injection
We closed the fascia, subcutaneous tissue, and the skin using 2-0 Vicryl sutures and subcuticular 2-0 Nylon respectively, and a dry sterile dressing was applied.
Semen analysis was repeated after 3 months of operation and was compared to pre-operative data. The results of the three groups were compared.
3.5. Clinical Assessment
Clinical assessment included operation time and difficulty of surgery.
3.6. Doppler Ultrasonography Assessment
After the surgery, a color Doppler ultrasound was carried out to evaluate how effective the procedure was and to determine whether the artery had been successfully preserved.
3.7. Statistical Analysis
Data analysis was performed using SPSS version 16 software. First, the data (demographic and clinical characteristics) were analyzed using Levene's and the Shapiro-Wilk tests for equality of variance and normality assumption, both at P > 0.05. Continuous data are expressed as mean ± SD. The significance level of reporting for the continuous data of demographic and clinical characteristics of patients before surgery was smaller than the error level of 0.05. Therefore, a one-way ANOVA test was used. Categorical variables were presented as numbers (%) and tested using the chi-square test. Therefore, preoperative to postoperative sperm parameter changes within each group were analyzed using a one-way ANOVA test. The results show a significant difference was detected between the groups. Then, a one-way ANOVA test for the individual comparisons was performed for the 3 comparisons (control, papaverine, papaverine, and hydrodissection). Also, a linear regression test was performed to adjust the effect of dependent variables based on BMI and employment status.
4. Results
4.1. Baseline Characteristics
A total of 114 patients were included in the study according to the criteria (38 patients in each group). Three months following the surgery, 2 patients were excluded from the study due to migration, unwillingness to follow up, absence of access to patients, and other factors (Figure 3). These patients were categorized as follows: Two in the control group. Table 1 demonstrates the characteristics of the patient groups in the study. The groups were comparable in age (P = 0.33). However, there were statistically significant differences in body mass index and employment status between the groups (P < 0.001). Regarding varicocele grade, there was no significant difference between the two groups (Table 1).
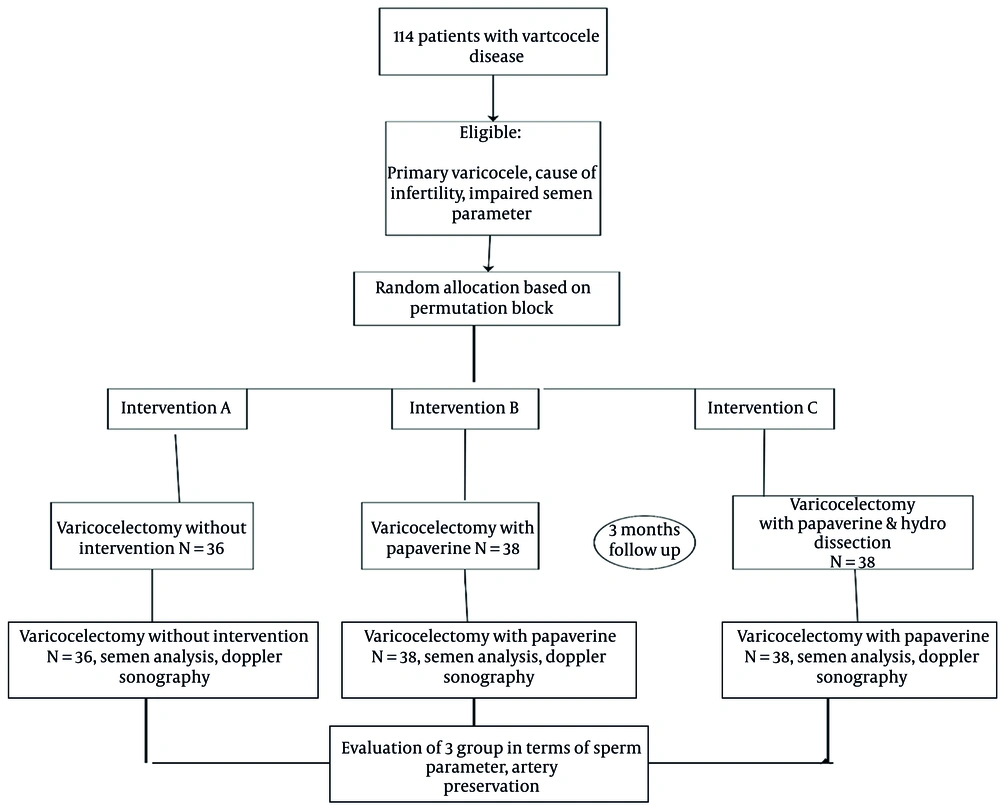
Figure 3.
Consort flow diagram of the study
| Characteristics | Control (n = 36) | Papaverine (n = 38) | Papaverine and Hydrodissectio (n = 40) | P-Value |
|---|---|---|---|---|
| Age (y) | 29.41 ± 5.00 | 30.60 ± 4.92 | 30.97 ± 4.31 | 0.33 c |
| Employment status | < 0.001 d | |||
| Unemployed | 0 (0.00) | 0 (0.00) | 8 (20.00) | |
| Employed | 36 (100.00) | 38 (100.00) | 32 (80.00) | |
| BMI (Kg/m2) | 16.12 ± 0.99 | 19.52 ± 2.34 | 17.69 ± 2.82 | < 0.001 c |
| Varicocele Grade | 0.003d | |||
| Grade 1 | 0 (0.00) | 2 (5.26) | 1 (2.56) | |
| Grade 2 | 27 (75.00) | 19 (50.00) | 12 (30.77) | |
| Grade 3 | 9 (25.00) | 17 (44.74) | 26 (66.67) |
Abbreviation: BMI, Body Mass Index.
a Values are expressed as No (%) or mean ± SD.
b Statistical significance is P < 0.05.
c One-way ANOVA test.
d Chi-square test.
The three groups showed significant differences in mean operating time. Additionally, there was a statistically significant difference in surgical difficulty among the three groups (Table 2).
| Characteristics | Control (n = 36) | Papaverine (n = 38) | Papaverine and Hydrodissection (n = 40) | P-Value |
|---|---|---|---|---|
| Motility (%) | 44.73 ± 13.72 | 40.60 ± 5.05 | 49.42 ± 4.99 | 0.02c |
| Count (million per mL) | 0.89 ± 1.59 | 0.88 ± 1.55 | 0.88 ± 1.51 | 0.99 c |
| Morphology (%) | 53.80 ± 4.04 | 54.18 ± 3.10 | 52 ± 6.80 | 0.12 c |
| Operative time in minutes | 17.02 ± 1.10 | 22.78 ± 2.38 | 23.27 ± 3.12 | < 0.001 c |
| Difficulty of surgery | < 0.001 d | |||
| Easy = 1 | 0 (0.00) | 38 (100) | 0 (0.00) | |
| Moderate = 2 | 12 (33.33) | 0 (0.00) | 40 (100) | |
| Hard = 3 | 0 (0.00) | 0 (0.00) | 24 (66.67) |
a Values are expressed as No (%) or mean ± SD.
b Statistical significance is P < 0.05.
c One-way ANOVA test.
d Chi-square test, Fisher's Exact test.
4.2. Clinical Outcomes
The results of the study showed that the mean of motility in the hydrodissection plus papaverine group was significantly higher compared to the other groups [69.34 (60.00) vs 62.70 (5.39) and 54.77 (14.48), P < 0.001]. Also, the three groups showed significant differences in the mean count of sperm. The highest count of sperm was observed in the papaverine plus hydrodissection group. This difference was statistically significant [65.96 (56.20) vs 39.25 (30.52) and 26.83 (21.65), P = 0.0001]. There was a difference in sperm morphology between the three groups after three months of surgery. Still, this difference was not statistically significant (P = 0.07).
In terms of arterial preservation, as assessed by Doppler ultrasound, the mean arterial preservation in the papaverine plus hydrodissection group was superior to the other groups [0.59 (0.04) vs 0.46 (0.14) and 0.50 (0.02), P < 0.001] (Table 3).
| Characteristics | Control (n = 36) | Papaverine (n = 38) | Papaverine and Hydrodissectio (n = 40) | P-Value |
|---|---|---|---|---|
| Motility (%) | 54.77 ± 14.48 | 62.70 ± 5.39 | 69.34 ± 60.00 | < 0.001 |
| Count (million per mL) | 26.83 ± 21.65 | 39.25 ± 30.52 | 65.96 ± 56.20 | 0.0001 |
| Morphology (%) | 57.78 ± 12.87 | 51.89 ± 9.93 | 55.17 ±10.60 | 0.07 |
| Artery preservation | 0.50 ± 0.02 | 0.46 ± 0.14 | 0.59 ± 0.04 | < 0.001 |
a Values are expressed as mean ± SD.
b Statistical significance is P < 0.05.
c One-way ANOVA test.
The linear regression analysis, adjusted for BMI and occupation, revealed a statistically significant association between the study groups and motile sperm count at three months. Participants in the papaverine group had, on average, 8.68 units higher motile sperm count compared to those in the reference group (control group) (95% CI: 3.35 to 14.00; P = 0.002). A stronger association was observed for the hydrodissection plus papaverine group, which showed an average increase of 14.03 units in motile sperm count compared to the control group (95% CI: 9.44 to 18.62; P < 0.001).
The linear regression analysis, adjusted for BMI and occupation, indicated a statistically significant association between the study groups and sperm count at three months. Participants in the papaverine group showed a non-significant increase in sperm count compared to the control group, with an average difference of 11.60 units (95% CI: -10.90 to 34.10; P = 0.309). However, a statistically significant improvement was observed in the hydrodissection plus papaverine group, which demonstrated an average increase of 40.44 units in sperm count compared to the control group (95% CI: 21.03 to 59.86; P < 0.001).
After adjusting for BMI and occupation, the regression analysis demonstrated a significant association between the study groups and sperm morphology at three months. Participants in the papaverine group had, on average, a 7.95-unit lower percentage of normal sperm morphology compared to the control group (95% CI: -14.26 to -1.64; P = 0.014). In contrast, the hydrodissection plus papaverine group exhibited a non-significant reduction in normal morphology by 3.48 units compared to the control group (95% CI: -8.93 to 1.96; P = 0.207).
The regression analysis adjusted for BMI and occupation revealed a significant association between study groups and the resistance index. The papaverine group demonstrated a statistically significant decrease in arterial preservation by an average of 0.061 units compared to the control group (95% CI: -0.110 to -0.012; P = 0.016). Conversely, participants in the hydrodissection plus papaverine group showed a statistically significant increase of 0.088 units in arterial preservation compared to the control group (95% CI: 0.045 to 0.131; P < 0.001) (Table 4).
| Characteristics and Group | Coefficient (β) | 95% Confidence Interval | P-Value |
|---|---|---|---|
| Motile sperm (3 months) | |||
| Group 1 | Reference | ||
| Group 2 | 8.68 | (3.35, 14.00) | 0.002 |
| Group 3 | 14.03 | (9.44, 18.62) | < 0.001 |
| Sperm count (3 months) | |||
| Group 1 | Reference | ||
| Group 2 | 11.60 | (-10.90, 34.10) | 0.309 |
| Group 3 | 40.44 | (21.03, 59.86) | < 0.001 |
| Morphology (3 months) | |||
| Group 1 | Reference | ||
| Group 2 | -7.95 | (-14.26, -1.64) | 0.014 |
| Group 3 | -3.48 | (-8.93, 1.96) | 0.207 |
| Artery preservation (3 months) | |||
| Group 1 | Reference | ||
| Group 2 | -0.061 | (-0.110, -0.012) | 0.016 |
| Group 3 | 0.088 | (0.045, 0.131) | < 0.001 |
a The regression models for each dependent variable were adjusted for BMI and Employment status.
b Group1: Control; Group2: Papaverine; Group3: Papaverine and hydrodisection
c Statistical significance is P < 0.05.
5. Discussion
Data on the use of papaverine in patients with varicocele as a cause of infertility and the evaluation of the effect of the use of agents that lead to surgical field enlargement on surgical outcomes are scarce and controversial. Therefore, the present study was conducted to compare the methods of using papaverine combined with hydrodissection and using only local papaverine and varicocelectomy alone without magnifying agents in patients with infertility. Data analysis showed the highest values in terms of spermogram parameters, such as motility and sperm count, three months after surgery, in the papaverine plus hydrodissection group, followed by the papaverine group. However, no statistically significant difference was observed in terms of sperm morphology.
In this regard, Shebl et al. believed there were statistically significant differences regarding the spermogram parameters such as motility and sperm count, in intraoperative Doppler plus hydrodissection (12). Although they used intraoperative Doppler ultrasonography in their study, they showed that the rate of artery preservation and improvement of spermogram parameters improved with magnification of the surgical site and increased accuracy, which is similar to the results of our study. Additionally, the hypoxia brought on by artery damage during surgery interferes with energy metabolism, which damages spermatogenesis (18). As a result, numerous efforts have been undertaken to lower the rates of complications and recurrences after surgery, enabling improved preservation of the lymphatic and testicular arteries as well as a decreased incidence of hydrocele (12). A dissection technique that protects the spermatic artery and all of its branches is preferred because ligation of the testicular artery can jeopardize the seminiferous tubules even in the absence of testicular atrophy (19). According to studies, unintentional occlusion of the spermatic artery can lead to a lack of improvement in fertility and suboptimal improvement in spermogram parameters (20). According to a recent systematic review, microsurgical varicocelectomy dramatically increases spermatogenesis, as evidenced by biomarkers of infertile men such as sperm DNA fragmentation and semen parameters (21).
In the present study, we used saline infusion to try and clearly identify the spermatic cord lymphatics during a standard varicocelectomy. It just took a few milliliters of saline infusion to distinguish between the spermatic cord's lymphatic and vascular components. Therefore, it was simple to delineate the cord lymphatics and to visualize them with the unaided eye. Thus, just the spermatic cord veins were tied by hydrodissection. It was clearly observed that the combination of hydrodissection and papaverine significantly enhanced postoperative outcomes and semen parameters compared to the use of papaverine alone. In this regard, Atteya et al. (22) concluded that hydrodissection with a saline infusion into the spermatic cord resulted in the separation of the vessels from each other; with this method, the internal cord structure may be seen through hydrodissection, negating the need for a surgical opening of the spermatic cord.
Since the first varicocelectomy was demonstrated to improve semen parameters in 1952 (23), researchers have extensively tested this treatment. It is well known that microsurgical varicocelectomy improves semen parameters (24). The number of veins ligated intraoperatively did not appear to impact this improvement in this investigation.
Subinguinal varicocelectomy under a microscope is now the most successful treatment for varicocele (25). As already indicated, the possibility of harming the spermatic artery, which might hinder spermatogenesis, is one of the biggest obstacles surgeons must overcome (26). Doppler ultrasound is currently utilized during surgery to prevent this problem, but just a few hospitals use it, and its availability is restricted in many parts of Iran. It is necessary to find a more efficient and less expensive technique. Overall, the combination of hydrodissection with papaverine demonstrated superior surgical outcomes in infertile patients compared to other investigated methods. This improvement is attributed to enhanced surgical visualization, increased surgeon precision, and better differentiation of spermatic cord elements.
5.1. Limitation
Several constraints should be considered when interpreting the findings of this study. First, the primary outcome relied on semen analysis parameters, which serve as a surrogate marker for future pregnancy; a comprehensive evaluation would require a longitudinal investigation tracking actual conception rates. Second, the sample size of the current study may have been inadequate to definitively detect clinically meaningful differences between the groups. While statistical findings benefit from increased sample accuracy with larger cohorts, reported variations in certain statistics suggest that the study was potentially underpowered. Consequently, further research utilizing a larger sample size is warranted. Third, the study's narrow scope constitutes a major drawback. Outcome variability may be influenced by various uncontrolled factors, including the surgical technique employed, surgeon proficiency (speed), and the amenities/facilities of the treatment centers, all of which were not standardized. Finally, a key methodological limitation was the statistically significant difference observed between groups regarding the baseline variables of employment status and BMI. Although attempts were made to control for these, future studies are advised to employ more sensitive matching strategies to ensure robust group comparability.
5.2. Conclusions
The combination of papaverine and hydrodissection in unilateral inguinal varicocelectomy led to improved semen parameters, including sperm motility and count, despite a slightly longer operative time. No postoperative complications were reported. Moreover, this technique reduced the need for advanced imaging modalities like Doppler ultrasound and microscopes, although the risk of vascular injury remained and the use of vasodilators such as papaverine was still necessary.
