


1. Background
Carpal tunnel syndrome (CTS) is the most prevalent entrapment neuropathy resulting from the compression of the median nerve in the wrist. It is estimated to involve 4 - 5% of the world population, primarily affecting individuals around 40 - 60 years old, with a higher prevalence among women, especially in the age group of 45 - 54 years (9.2% in women vs. 6% in men) (1). The symptoms include numbness, paresthesias, and pain in the median nerve distribution, which can progress to thenar muscle weakness over time (2). The diagnosis is typically made based on clinical history, physical findings, and electrodiagnostic assessment. Sensory nerve conduction velocity (NCV) is one of the most sensitive diagnostic tools, reported with a sensitivity of 98% - 99% (3).
The choice of therapy can depend on the severity of the disease. Minor to moderate cases are usually treated with conservative medication, immobilization, corticosteroid injections, and physical therapy. When conservative therapy is ineffective or symptoms progress, operative decompression is advocated, although it can be associated with complications such as infection, keloid formation, and residual pain (2, 4).
Rosuvastatin, a hydrophilic statin, is commonly used for its lipid-lowering and cardiovascular protective effects. Nevertheless, there is growing evidence for other pleiotropic effects, such as anti-inflammatory and antioxidant properties, and neuroprotective effects, which may reduce median nerve edema, improve microvascular function, and facilitate axonal recovery (5). Studies have also shown that statins might promote nerve regeneration, inhibit inflammation, and improve nerve conduction in different types of neuropathy, such as diabetic neuropathy, chemotherapy-induced peripheral neuropathy (CIPN), and rat sciatic nerve injury (6, 7).
While previous CTS studies have used 20 mg/day of rosuvastatin (6, 7), one study selected 40 mg/day as it is the highest clinically approved dose. This choice allowed them to investigate the potential pleiotropic and neuroprotective effects of rosuvastatin in CTS within a validated and widely recognized dosing range (8).
2. Objectives
Because of the widespread prevalence of CTS, subsequent disability, and unsatisfactory management options, one such study was planned to evaluate the role of rosuvastatin in alleviating symptoms and improving electro-diagnostic parameters in moderate CTS. Here, we suggest that a non-invasive strategy, such as rosuvastatin, could be used as an adjunct to traditional treatments, potentially reducing the requirement for surgery and, therefore, surgical complications.
3. Methods
This double-blind, placebo-controlled randomized clinical trial was carried out at the Electromyography Clinic of Booali Sina Hospital (Qazvin, Iran) from 2023 to 2025. Sixty-seven patients with mild to moderate CTS, according to clinical and electrodiagnostic criteria, were recruited. Inclusion criteria included age ranging from 18 to 65 years, a confirmed diagnosis of moderate CTS for more than 1 year determined by electrodiagnostic studies, and no history of statin use. Exclusion criteria were concomitant neurological diseases (such as hypothyroidism, diabetes mellitus, connective tissue diseases, and rheumatoid arthritis), malignancies, recent injury, pregnancy, hemodialysis, and severe CTS requiring surgery.
Subjects were randomly assigned to the treatment group (rosuvastatin 40 mg/day, n = 32) or the control group (placebo, n = 35). Pre-intervention assessments of lipid profile, liver enzymes, and electrodiagnostic parameters were performed for all subjects. Follow-up measurements were taken at 3 months post-intervention. Patients did not receive simultaneous physiotherapy during the trial. Symptom severity was rated with the Boston CTS Questionnaire (9), measured with respect to pain and paresthesia during the day and night. Electrodiagnostic variables comprised amplitude, peak latency, and distal latency of the median nerve. We used electrodiagnostic criteria for classifying CTS as mild, moderate, or severe (10). Lipid profiles were checked at baseline and follow-up to ascertain safety and metabolic changes (including LDL, HDL, and triglycerides), and liver function tests (AST and ALT) were maintained.
Randomization was conducted using a balanced block design (block size = 9). Based on the study of Poursadeghfard et al. (11), and assuming a 20% attrition rate, a sample size of 36 patients per group was calculated to ensure adequate statistical power. The significance level (α) was set at 0.05, and the power (1 - β) was set at 80%, corresponding to a beta value of 0.2. Thus, a total of 36 patients were included in each group. However, four patients from the interventional group and one patient from the control group were excluded from the analysis due to severe medication side effects.
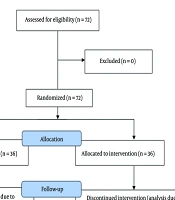
This study adheres to CONSORT guidelines, and a completed CONSORT checklist is provided as an additional file (Figure 1). To ensure data reliability, patient assessments were independently verified by two blinded neurologists, and electrodiagnostic results were re-checked for consistency.

Figure 1.
The CONSORT flow diagram of our study
Statistical analysis was performed using SPSS software version 26. Summary statistics were applied to describe demographic and clinical features. Continuous variables were assessed using an independent samples t-test or Mann-Whitney U test, and categorical variables were evaluated using the chi-square test. Pre- and post-intervention parameters were compared with repeated measures ANOVA or Friedman tests for intragroup, and for intergroup analysis. A P-value < 0.05 was defined as statistically significant.
This study was conducted in accordance with the ethical principles outlined in the Declaration of Helsinki. The research protocol was approved by the Ethics Committee of Qazvin University of Medical Sciences (ethics approval code: IR.QUMS.REC.1402.184) Prior to participation, all patients were provided with detailed information regarding the objectives, procedures, potential risks, and benefits of the study. Written informed consent was obtained from all participants before enrollment.
4. Results
The mean age in the intervention group was 52.47 ± 10.63 years, and 42.74 ± 9.66 years in the control group. Most participants were female (87.5% in the intervention group vs. 85.7% in the control group). Statistically significant differences were observed between groups before treatment in age, baseline AST, and baseline LDL (P < 0.05). No significant differences were found in other baseline variables (Table 1).
| Variables | Intervention Group | Control Group | P-Value |
|---|---|---|---|
| Age (y) | 52.47 ± 10.63 | 42.74 ± 9.66 | < 0.001 c |
| Baseline AST (U/L) | 33.38 ± 6.7 | 28.97 ± 5.14 | 0.003 c |
| Baseline LDL (mg/dL) | 97 ± 13.63 | 90.94 ± 8.28 | 0.02 c |
| BMI (kg/m2) | 28.88 ± 3.84 | 27.51 ± 5.15 | 0.22 |
| Baseline pain score | 3.01 ± 0.84 | 2.88 ± 0.64 | 0.44 |
| Baseline paresthesia | 3.18 ± 0.68 | 2.91 ± 0.66 | 0.1 |
| Baseline Boston score | 2.59 ± 0.55 | 2.4 ± 0.46 | 0.13 |
| Right median motor | |||
| Baseline AMP (mV) | 6.72 ± 1.89 | 7.32 ± 2.09 | 0.27 |
| Baseline DL (ms) | 4.42 ± 1.22 | 4.09 ± 0.8 | 0.19 |
| Right median sensory | |||
| Baseline AMP (µV) | 30.57 ± 10.29 | 35.31 ± 14.66 | 0.13 |
| Baseline PL (ms) | 4.77 ± 3.87 | 3.86 ± 0.52 | 0.17 |
| Left median motor | |||
| Baseline AMP (mV) | 6.68 ± 2.03 | 7.57 ± 4 | 0.26 |
| Baseline DL (ms) | 4.09 ± 0.78 | 4.01 ± 0.78 | 0.65 |
| Left median sensory | |||
| Baseline AMP (µV) | 32.03 ± 11.13 | 39.62 ± 12.5 | 0.01 c |
| Baseline PL (ms) | 3.97 ± 0.92 | 3.75 ± 0.64 | 0.24 |
Abbreviations: AMP, amplitude; DL, distal latency; PL, peak latency.
a Values are expressed as mean ± standard deviation (SD).
b Boston Questionnaire (pain/paresthesia severity).
c Statistically significant (P < 0.05).
Statistically significant differences were observed between groups after treatment in follow-up AST, follow-up pain score, follow-up paresthesia, and follow-up Boston score (P < 0.05). No significant differences were found in other baseline variables (Table 2).
| Variables | Intervention Group | Control Group | P-Value |
|---|---|---|---|
| Follow-up AST (U/L) | 31.47 ± 5.41 | 28.63 ± 5.23 | 0.03 c |
| Follow-up LDL (mg/dL) | 93.94 ± 12.84 | 90.91 ± 7.7 | 0.24 |
| Follow-up pain score | 1.68 ± 0.52 | 3.01 ± 0.43 | < 0.001 c |
| Follow-up paresthesia | 1.82 ± 0.61 | 3 ± 0.54 | < 0.001 c |
| Follow-up Boston score | 1.55 ± 0.35 | 2.15± 0.36 | < 0.001 c |
| Right median motor | |||
| Follow-up AMP (mV) | 7.8 ± 2.2 | 7.33 ± 2.04 | 0.35 |
| Follow-up DL (ms) | 4.13 ± 1.26 | 4.02 ± 0.87 | 0.68 |
| Right median sensory | |||
| Follow-up AMP (µV) | 34.35 ± 12.9 | 33.85 ± 13.5 | 0.87 |
| Follow-up PL (ms) | 3.86 ± 0.8 | 3.73 ± 0.58 | 0.44 |
| Left median motor | |||
| Follow-up AMP (mV) | 7.95 ± 2.23 | 8.95 ± 7.78 | 0.48 |
| Follow-up DL (ms) | 3.86 ± 0.73 | 3.89 ± 0.7 | 0.87 |
| Left median sensory | |||
| Follow-up AMP (µV) | 38.31 ± 11.4 | 36.76 ± 14.44 | 0.62 |
| Follow-up PL (ms) | 3.71± 0.96 | 3.66 ± 0.7 | 0.79 |
Abbreviations: AMP, amplitude; DL, distal latency; PL, peak latency.
a Values are expressed as mean ± standard deviation (SD).
b Boston Questionnaire (pain/paresthesia severity).
c Statistically significant (P < 0.05).
The results of the analysis of covariance (ANCOVA) indicated that, after adjusting for age, there was a statistically significant difference between the two groups in terms of follow-up pain score (F = 132.75, P < 0.001). Age also demonstrated a significant effect (F = 4.85, P = 0.031). For the follow-up paresthesia, a significant intergroup difference was observed after controlling for age (F = 59.41, P < 0.001), whereas the effect of age was not significant (F = 0.37, P = 0.544).
Regarding follow-up AST, no significant difference between groups was found after adjusting for age (F = 0.20, P = 0.656), while the effect of age on this variable was significant (F = 47.68, P < 0.001). Furthermore, for the follow-up Boston score, a significant difference between groups was observed (F = 106.81, P < 0.001), whereas the effect of age was not significant (F = 1.51, P = 0.223).
5. Discussion
The present study showed that the clinical and electrodiagnostic features regarding mild to moderate CTS improve markedly with rosuvastatin (40 mg/day). These findings are consistent with previous experimental and clinical reports demonstrating that statins have neuroprotective and anti-inflammatory effects beyond their lipid-lowering effect (6-8).
Potential mechanisms for the favorable effect of rosuvastatin on CTS include:
1. Anti-inflammatory action: Statins inactivate inflammatory mediators, leading to a reduction in nerve edema and demyelination.
2. Neuroprotection: Statins reduce ischemic damage to the median nerve by decreasing the generation of nitric oxide and acting as antioxidants.
3. Enhanced endothelial function: By enhancing the blood supply to the nerve, statins may reduce pressure-related damage in the carpal tunnel (12, 13).
These results align with data from other studies that demonstrated enhanced nerve regeneration after statin treatment. For instance, Emad et al. reported an improvement in sural sensory and peroneal motor amplitudes with statins in non-diabetic subjects, without evidence of neuropathy development (14). Similarly, Namazi et al. found that simvastatin facilitated the recovery of injured rat sciatic nerve, consistent with the functional improvement observed in human patients (15). Moreover, Aizawa et al. found that statins do not increase CIPN in cancer patients and could potentially improve survival for men receiving paclitaxel, further supporting the neuroprotective action of statins (16).
Abdolmaleki et al. observed that rosuvastatin enhanced sciatic nerve recovery in rats, which aligns with our human data (6). Conversely, Svendsen et al. (17) and Aizawa et al. (16) also reported no significant increase in peripheral neuropathy with statin use, which adds to the safety signal of our study. Compared with conservative treatments currently available, rosuvastatin may provide a new, safe, and well-tolerated alternative that could postpone or avoid surgery.
Corticosteroids have been used as a relatively quick way to relieve pain, but their sustained use is often not feasible due to adverse effects. Compliance is needed with physical therapy and splinting, which often results in only partial improvement. Rosuvastatin thus becomes a potential coadjutant or substitute for these treatments (15).
However, our research also has certain limitations. It must be emphasized that the number of cases was small and the observation time was short, only 3 months. While patients reported significant symptomatic improvement, some electrodiagnostic parameters, such as right sensory peak latency, did not show parallel changes. This discrepancy may reflect the short follow-up duration, limited sample size, or the fact that functional recovery and subjective relief may precede measurable electrophysiological improvement. Large, long-term trials comparing various types and doses of statins are needed to validate these findings.
In addition to the existing limitations, several advantages of this study can be highlighted compared to other studies. The investigation of the neuroprotective effect of statins on patients with neuropathy is considered one of the strengths of this study, as most studies on nerve damage have been conducted on animal models. Another strength of the current study is the use of paraclinical methods, such as examining the electrodiagnostic parameters of the median nerve, which has strengthened and reinforced the results of our study.
Rosuvastatin (40 mg/day) induced clinical and electrodiagnostic improvement in mild to moderate CTS during a 3-month follow-up. These findings are consistent with the idea that statins are anti-inflammatory and neuroprotective, and would benefit patients with peripheral nerve compression syndromes. Integrating rosuvastatin into the treatment armory for patients with CTS might be one step toward lowering rates of surgical complications and achieving better patient outcomes.