1. Background
Deficiency of available beds in the intensive care units as well as ventilation equipment shortage in hospitals especially in our country, has always been considered as an important and routine problem in the health systems (1). Therefore, being aware of the hospitalization duration in the intensive care units and mechanical ventilation weaning risk factors in parallel with finding appropriate techniques to shorten the hospitalization and on-mechanical ventilation period, will help reduce the healthcare costs and plan an optimal consumption of the existing resources (2). Mechanical ventilation has beneficial effects on the pathophysiology of acute respiratory failure, by increasing FiO2, re dilating the alveolar collapse and providing adequate alveolar ventilation. But this is associated with complications such as increased risk of sinusitis, airway injury, thromboembolism, Gastrointestinal bleeding, risk of pneumonia, ventilator dependency and etc. (3, 4). The weaning process is evaluated by daily readiness tests, Obviation level of respiratory failure, respiratory muscle function retrieve and the patient’s ability to start spontaneous breathing (4, 5).
Choosing the right time for a successful mechanical ventilation disruption, in the light of available physiologic and laboratory factors, has remained a challenge. Weaning decisions based only on expert clinical judgments are not always right. Premature extubation followed by reintubation is associated with severe stress on the respiratory and cardiovascular systems, whereas unnecessary delays can cause atrophy of the diaphragm which can worsen its force generation and the maximal inspiratory pressure. Studies have shown that respiratory muscle fatigue during unsuccessful weaning can result in prolonged mechanical ventilation and weaning failure, long-term hospitalization and increased morbidity and mortality. In general, the etiology of unsuccessful weaning is imbalance between respiratory muscle pump and respiratory muscle load (3, 6, 7). The probability of weaning success was 75% or higher in more than half of the studies investigated on the weaning-predictor tests (8).
Weaning process requires a multidisciplinary care team, including the anesthesiologist, nurse, respiratory therapist, physical therapist, and nutritionists and nurses have the coordinating role in this team (4, 9, 10). Readiness assessment of weaning is carried out a few hours after the onset of mechanical ventilation in patients with quickly reversible diseases such as cardiac-pulmonary edema and drug overdose. For other causes of acute respiratory failure, full-support ventilation and respiratory muscle rest are performed for 24 to 48 hours, and the spontaneous breathing ability is evaluated afterwards (10). Patients who meet the following satisfactory criteria are considered to be ready for weaning: Underlying disease process that necessitated ventilation has been resolved or improved; SaO2 ≥ 90% with FiO2 ≤ 0.4, PaO2 ≥ 60 mmHg, positive end-expiratory pressure ≤ 8 cmH2O, f/Vt ratio < 105, none or a minimal dose of vasoactive or sedative drugs administered, body temperature < 38.5°C and hemoglobin ≥ 8 g/dL (6, 11).
In addition to readiness criteria for discontinuation from mechanical ventilation, it is best to use predictor indexes to decide arounnd weaning. Most international weaning researchers have attempted to find better indexes or parameters which can predict the weaning outcome in the best possible way. In 1986, Milic-Emili first proposed an inspiratory effort quotient to predict unsuccessful weaning ([(0.75 TV/C dyn) * (Ti/T tot)] / MIP) (12). Yang and Tobin developed the Compliance, Respiratory Rate, Oxygenation, and Pressure (CROP = [Cdyn *MIP *(PaO2/PAO2)] / RR) index that yielded a positive predictive value of 0.71 and a negative predictive value of 0.70 (12, 13). In the same year, Jabour and colleagues examined the weaning index, the product of a modified pressure time index and an index of gas exchange efficiency that had a positive predictive value of 0.70 (12, 14). One of the most accurate indexes is the rapid shallow breathing index (RSBI) or the f/Vt ratio that was introduced by Yang and colleagues, in1991 that had a positive predictive value of 0.85 (6, 12, 15). In 2009, Nemer and coworkers reported a new integrative weaning index (IWI) that had a positive predictive value of 0.99 and a negative predictive value of 0.86 (6).
IWI =Cst rs* SaO2 / (f/TV)
Several reasons concurred to the choice of the abovementioned parameters: Cst, rs more than 30 mL/cmH2O is associated with a shorter weaning time; SaO2 has proven to be useful for weaning readiness evaluation and Rapid Shallow Breathing Index (f/Vt) is considered the best or one of the best indexes for the weaning outcome evaluation. By multiplying the static compliance by SaO2, we can detect patients who can or cannot maintain a good oxygenation, despite good or bad respiratory mechanics. Dividing this product by the f/Vt ratio, we can detect those patients who will or will not be able to maintain unassisted breathing. However, 15% of the patients who can complete an SBT require re-intubation in the following 48 hours after extubation. This indicates that there are patients that tolerate short SBTs, but not long ones, and required re-intubation (6).
2. Objectives
The objective of this study is to determine the validity of the integrative weaning index (IWI) in Iran with high accuracy for the weaning protocol.
3. Patients and Methods
This was a prospective clinical -one blind- multicenter study in which 124 adult patients, who were mechanically ventilated for more than 24 hours, were evaluated. Inclusion criteria were: Patients 18 to 80 years old, none of them suffering from neurological and neuromuscular diseases, none or a minimal dose of sedative drugs being used with the instructions according to hemodynamic conditions and needs of patients and putting them in the light relaxation phase (15 - 18 points based on Palma and Cook criteria), non-addict, heavy smokers (not consuming more than one pack of cigarettes a year: (packs smoked per day) × (years as a smoker)), not admitted in ICU-OH and no clinical signs of sinusitis (thick nasal secretions, discolored nasal secretions, fever with no underlying cause). The study was conducted from November 2011 to December 2012 in six ICUs (Surgery - Trauma - Medical -Poisoning) of selected hospitals in Tehran, totaling 60 beds. The ventilators used were from Rafael brand. All records and measurements were conducted by the researcher.
To determine the sample size using likelihood ratios according to the sensitivity of 0.97 and specificity of 0.94 derived from the study of Nemer (6), 124 patients were needed. Data was collected using patients’ medical records to compare patients in the two phases with continuous variables presented as mean and standard deviation, as well as categorical variables including frequencies and percentages. P values less than 0.05 were considered significant. In this study, the threshold values of each index were considered by physicians as follows: PaO2/FiO2 ratio ≥ 150 mmHg; Cst, rs of ≥ 30 mL/cmH2O; RSBI < 105 and CROP ≥ 13 mL/cmH2O breaths/minute/liter.
Reactivity of mechanically-ventilated patients in response to external stimuli was determined by Glasgow Coma Scale modified by Palma & Cook (GCSC). This scale was described by Cook in 1987. Opening of the eyes is considered to be indicative for higher function, and motor response is evaluated on the basis of somatic stimulation. It causes minimal additional discomfort for the patient. GCSC scored four parameters that have open eyes (1 to 4), response to nursing procedures (1 of 5), cough (1 to 4), and breathing (1 to 5). The Minimum and maximum points of this scale are 4 and 18 (16). The above-cited study confirmed the reproducibility of this scale, with good agreement between observers (Cohen κ index 0.94; P < 0.0001) that the scale is valid for clinical researches (17-19). The Persian version of GCSC has been shown to be valid and reliable for measuring patients’ sedation in ICU units (20).
The Ethics Committee of Baqiyatallah Medical University approved the research proposal. After providing Physician with absolute information on the purpose of the study and before intervention, informed consent was obtained from the physicians. They were assured of their confidentiality and anonymity and would not have any detrimental effects in terms of the essential or regular hospital treatments and services received. No risks associated with the use of IWI measurement as an intervention were identified in the previous studies. Measurement of physiological parameters and sedation scores were one part of routine ICU care consequently and no additional burden was put on the patients. Furthermore, the previously described inclusion criteria were chosen so as not to load an additional burden on unstable patients and their relatives.
To match the patients before the weaning trial, all of them were ventilated in PSV = 8 to 10 cmH2O and PEEP = 5 cmH2O with FiO2 ≤ 0.4. Mechanical ventilation discontinuation was attempted when the physician in charge, judged that the patient was ready to be weaned, according to criteria listed above. During the first minute before discontinuation, while the patient was on spontaneous mode, PS turned to zero and by doing ABG, the amounts of SaO2 and PaO2/FiO2 were recorded. The static compliance of the respiratory system (Cst, rs) was measured after an inspiratory hold for 0.5 to 1 second and could be concieved from the data on the screen. The amounts of TV expiratory and spontaneous breathing were recorded and RSBI index was obtained by dividing f by spontaneous tidal volume (VT in liters) and IWI = (Cst, rs *SaO2)/(f/TV) was calculated by the researcher.
A Spontaneous breathing trial (SBT) was then evaluated by means of a 2-hour T-piece. In case of desirable conditions, the decision of extubation was made by the physician in charge (who was completely blind to the study and the results of the indexes Evaluated). After extubation, the patient's clinical status was studied for 48 hours. The decision to return to mechanical ventilation was made by the physician in charge. The experiment was terminated if any of the following poor tolerance criteria were met: SaO2 < 90%, PaO2 < 60 mmHg with FiO2 < 0.5 (or SaO2 < 88%, PaO2 < 55 mmHg with FiO2 < 0.5 in COPD patients); PaCO2 > 50 mmHg (or increased by 8 mmHg or more in COPD patients); arterial PH ≤ 7.33 or decreased by 0.07 or more; f > 38 breaths / minute or change in f > 50% above baseline for 5 minutes; HR > 140 beats / minute or sustained increase or decrease in HR of > 20%; systolic BP >180 mmHg or < 90 mmHg; or in the presence of paradoxical breathing (signs of increased breathing), diaphoresis, agitation, disorientation or depressed mental status.
When one of the following criteria happens, weaning is considered as unsuccessful: failed SBT; re-intubation or requiring ventilator support within 48 hours after successful extubation; or death within 48 hours after extubation. The statistical analysis was performed using spss 16 and Medcalc 9.2. Sensitivity (SE = true positive/true positive + false negative), specificity (SP = true negative/true negative + false positive), diagnostic accuracy (DA) = (true positive + true negative)/(true positive + true negative + false positive + false negative), positive predictive value (PPV = true positive/true positive + false positive) and negative predictive value (NPV = true negative/true negative + false negative) were used to evaluate each index. The predictive performance of each index was also evaluated by calculating the area under the Receiver Operator Characteristic (ROC) curves.
The area under the ROC curves was calculated by the nonparametric method of Hanley and McNeil for each index (21). Area under the curve equal to 0.5 is an invalid result; area under the curve > 0.5 and < 0.7 is less accurate; area under the curve > 0.7 and < 0.9 is moderately accurate; area under the curve > 0.9 and < 1 is highly accurate; and area under the curve equal to 1 is a complete and valid test. We used Bayes' theorem to assess the performance of each test in predicting weaning outcome as a function of the prevalence of weaning success or failure in the two phases (6). Bayes' theorem allows the calculation of success or failure of weaning after performance of a test (post-test probability) (22). Integrative Weaning Index was evaluated on 124 adult patients in two consecutive 24-hour phases, without informing the physician from the acquired scores, and then acquired scores were compared to scores from selected indexes of physician for weaning from mechanical ventilation.
4. Results
One hundred and twenty four patients were evaluated in phase one and 80 in phase two for prospective validation. In the first phase (24 hours) 44 patients (35.5%) and in the second phase (48 hours) eight patients (10%) did not tolerate the SBT and required re-intubation after extubation (extubation failure). Patients in the first phase included 86 males and 38 females (53 males and 27 females in the successful group as well as 33 males and 11 females in the unsuccessful group); the second phase consisted of 47 males and 25 females in the successful group as well as 6 males and 2 females in the unsuccessful one. Ages of patients in the first phase were 60.24 ± 20.83 and 63.97 ± 20.70 as well as in the second phase were 59.33 ± 21. 41 and 68.25 ± 12.90 in the successful and unsuccessful groups respectively; , the disease severity in the first phase according to APACHE II Scale were 16.27 ± 6.30 and 17.33 ± 5.23, in successful and unsuccessful groups respectively.; in the first phase GCS was 9.35 ± 1.45 in successful and 9.76 ± 1.38 in unsuccessful group; in the second phase it was 9.54 ± 1.22 and 7.75 ± 2.31in the successful and unsuccessful groups, respectively., admission to the intensive care unit in the first phase was Surgery 37, Medical 14, Trauma 14, Poisoning 14 in the successful group and Surgery 35, Medical 2, Trauma 2, Poisoning 6 in the unsuccessful group; in the second phase it was Surgery 35, Medical 8, Trauma 14, Poisoning 14 in the successful group and Surgery 2, Medical 6, Trauma 0, Poisoning 0 in the unsuccessful group.
Performance of the each index was measured by diagnostic tests in the two phases. IWI presented the highest true positive, lowest false negative. Diagnostic Test Performance calculating each index in two phases is shown in Table 1. The accuracy, likelihood ratio and probability for weaning success used to predict the weaning outcome in the two phases are shown in Table 2. IWI presented the highest SE (94.59), SP (66.67), PPV (97.22), NPV (50), DA (92.5), LR + (2.84) besides the lowest LR - (0.08). The areas under the curves (ROC) for each index in the second phase are shown in Table 3. The area under the ROC curve for IWI was 0.967 ± 0.020, 95% Confidence interval of 0.899 to 0.993 and Significance level of P = 0.001. The comparisons among the areas under the ROC curves for all the indexes in the second phase are shown in Figure 1. The area under the ROC curve for IWI is significantly higher than the area of PaO2/FIO2 (0.967 ± 0.020× 0.736 ± 0.08 respectively; P = 0.001) and also significantly higher than the other indexes.
Table 1.
Diagnostic Test Performance Calculated Each Index in the two Phases
| Criteria | A, True + a | B, False + b | C, False - c | D, True - d | Test + e | Test - f | Weaning + g | Weaning - h | Diagnostic odds ratio i | Total |
|---|---|---|---|---|---|---|---|---|---|---|
| IWI, phase 1, ≥ 25 | 72 | 8 | 8 | 36 | 80 | 44 | 80 | 44 | 90 | 124 |
| IWI, phase 2, ≥ 25 | 70 | 2 | 4 | 4 | 72 | 8 | 74 | 6 | 97 | 80 |
| RSBI, phase 1, < 105 | 68 | 12 | 12 | 32 | 80 | 44 | 80 | 44 | 85 | 124 |
| RSBI, phase 2, < 105 | 58 | 8 | 6 | 8 | 66 | 14 | 64 | 16 | 88 | 80 |
| PaO2/FiO2, phase, 1, ≥ 150 | 76 | 9 | 21 | 18 | 85 | 39 | 97 | 27 | 89 | 124 |
| PaO2/FiO, phase 2, ≥ 1502, phase 2, ≥ 150 | 50 | 11 | 6 | 13 | 61 | 19 | 56 | 24 | 82 | 80 |
| CSTATIC, phase 1, ≥ 30 | 68 | 2 | 12 | 42 | 70 | 54 | 80 | 44 | 97 | 124 |
| CSTATIC, phase 2, ≥ 30 | 54 | 2 | 8 | 16 | 56 | 24 | 62 | 18 | 96 | 80 |
| CROP, phase 1, ≥ 13 | 76 | 16 | 4 | 28 | 92 | 32 | 80 | 44 | 83 | 124 |
| CROP, phase 2, ≥ 13 | 61 | 3 | 6 | 10 | 64 | 16 | 67 | 13 | 95 | 80 |
aTrue + = True Positive (test + and weaning +).
bFalse + = False Positive (test + and weaning -).
cFalse - = False Negative (weaning- and test +).
dTrue - = True Negative (weaning – and test -).
eTest += (True Positive+ False Negative).
fTest - = (False Positive + True Negative).
gWeaning + = (True Positive+ False Positive).
hWeaning - = (False Negative + True Negative).
iDiagnostic odds ratio = (True +/False -) / (False+/ True -).
Table 2.
Accuracy, Likelihood Ratio and Probability for Weaning Success Used to Predict the Weaning Outcome in the Two Phases
| Criteria | Y a | DA a | SE a | SP a | PPV a | 95% CI | NPV a | 95% CI | LR+ a | LR- a | prevalence |
|---|---|---|---|---|---|---|---|---|---|---|---|
| IWI , phase 1, ≥ 25a, phase 1, ≥ 25 | 71.82 | 87.1 | 90 | 81.82 | 90 | 81.48 - 94.84 | 81.82 | 68.03 - 90.48 | 4.95 | 0.12 | 64.52 |
| IWI, phase 2, ≥ 25 | 61.29 | 92.5 | 94.59 | 66.67 | 97.22 | 90.42 - 99.23 | 50 | 21.52 - 78.47 | 2.84 | 0.08 | 92.5 |
| RSBI , phase 1, < 105a, phase 1, < 105 | 57.73 | 80.65 | 85 | 72.73 | 85 | 75.58 - 91.20 | 72.73 | 58.5 - 83.65 | 3.12 | 0.21 | 64.52 |
| RSBI, phase 2, < 105 | 40.63 | 82.5 | 90.63 | 50 | 87.88 | 77.76 - 93.72 | 57.14 | 32.59 - 78.61 | 1.81 | 0.19 | 92.5 |
| PaO2/FiO2b, phase 1, ≥ 150 | 45 | 75.8 | 78 | 67 | 89 | 81 - 94 | 46 | 31 - 61 | 2.35 | 0.32 | 64.52 |
| PaO2/FiO2, phase 2, ≥ 150 | 43 | 78.7 | 89 | 54 | 82 | 70 - 89 | 68 | 0.46 - 0.84 | 1.95 | 0.20 | 92.5 |
| Cst, rs , phase 1, > 30a, phase 1, > 30 | 80.45 | 88.71 | 85 | 95.45 | 97.14 | 90.16 - 99.21 | 77.78 | 65.06 - 86.80 | 18.7 | 0.16 | 64.52 |
| Cst, rs , phase 2, > 30a, phase 2, > 30 | 75.99 | 87.5 | 87.1 | 88.89 | 96.43 | 87.88 - 99.01 | 66.67 | 46.7 - 82.02 | 7.84 | 0.15 | 92.5 |
| CROP , phase 1, > 13a, phase 1, > 13 | 58.64 | 83.87 | 95 | 63.64 | 82.61 | 73.6 - 89 | 87.5 | 71.93 - 95.02 | 2.61 | 0.08 | 64.52 |
| CROP, phase 2, > 13 | 67.96 | 83.75 | 91.04 | 76.92 | 95.31 | 87.1 - 98.39 | 62.5 | 38.64 - 81.51 | 3.95 | 0.12 | 92.5 |
aAbbreviations: Y, Youden's J statistic (sensitivity + specificity – 1); DA, diagnostic accuracy; SE, sensitivity; SP, specificity; PPV, positive predictive value; NPV, negative predictive value; LR +, likelihood ratio of positive test; LR-, likelihood ratio of negative test; IWI, integrative weaning index; RSBI, rapid shallow breathing index (frequency to tidal volume ratio); Cst, rs, static compliance of the respiratory system; CROP, compliance Rate O2 pressure index.
bPaO2/FiO2 ratio = ratio of arterial oxygen tension to fraction of inspired oxygen.
Table 3.
Area Under the Receiver Operator Characteristic Curves and Standard Error for Each Index in the second Phase
| Index | Area Under the ROC Curve | Standard Error | 95% Confidence Interval | Significance Level P (Area = 0.5) |
|---|---|---|---|---|
| IWI ≥ 25a ≥ 25 | 0.967 | 0.020 | 0.899 to 0.993 | 0.0001 |
| RSBI < 105a < 105 | 0.827 | 0.092 | 0.726 to 0.903 | 0.0004 |
| PaO2/FiO2b≥ 150 | 0.736 | 0.080 | 0.625 to 0.829 | 0.0031 |
| CROP > 13a > 13 | 0.901 | 0.041 | 0.813 to 0.957 | 0.0001 |
| Cst,rs > 30a > 30 | 0.785 | 0.070 | 0.678 to 0.870 | 0.0001 |
aAbbreviations: IWI, integrative weaning index; RSBI, rapid shallow breathing index; CROP, compliance Rate O2 pressure index; Cst, rs, static compliance of the respiratory system.
bPaO2/FiO2 ratio = ratio of arterial oxygen tension to fraction of inspired oxygen.
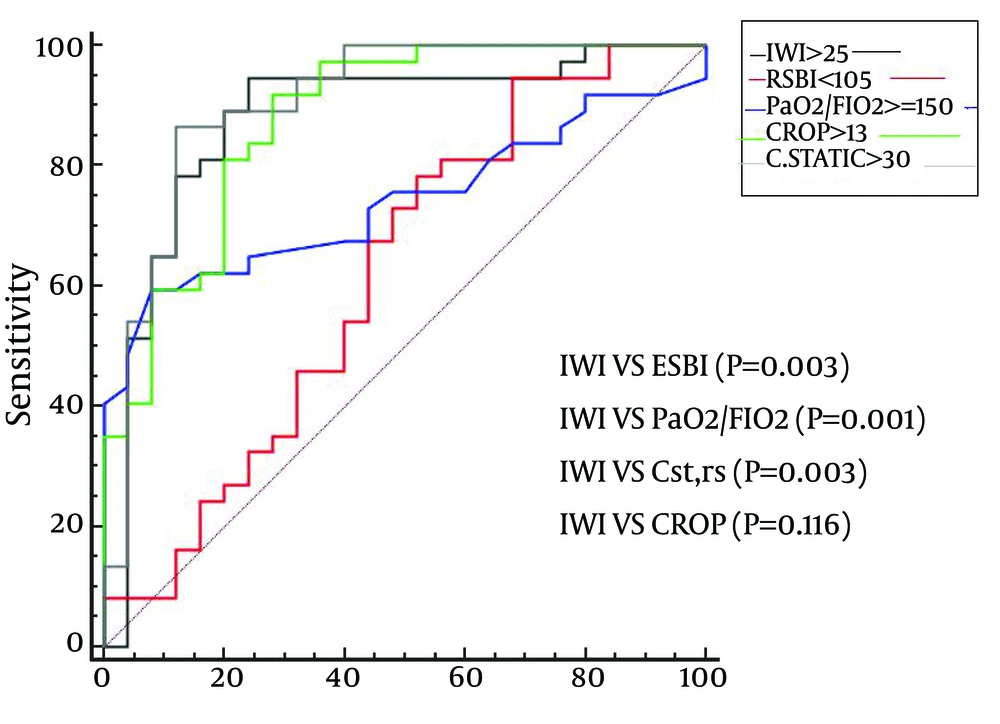
Figure 1.
Comparison of the Areas Under the Receiver Operator Characteristic Curves (P Value for the Two-Tailed Test
5. Discussion
In a cohort study by Frutos-Vivar et al., extubation failure occurred in 121 of the 900 patients (13.4%) that completed the SBT. Among the routinely measured clinical variables, f/Vt ratio, positive fluid balance 24 hours prior to extubation, and presence of pneumonia at the beginning of mechanical ventilation were the best predictors of extubation failure. This fact reinforces the hypothesis that not only the clinical evaluation, but also the evaluation of weaning indexes (as the f/Vt ratio) could be helpful (23). In a cross-sectional study by Eskandar et al. it was concluded that as many as 20% of mechanically ventilated patients, however, will fail their first attempt of weaning, plus more than 40% of the total duration of mechanical ventilation is spent in the weaning process and Rapid Shallow Breathing Index is the best predictor of the weaning outcome (7). In the evidence-based study of Epstein , as a routine use of weaning predictors, from 1986 to 2009, it was concluded that among the indexes that had been introduced until that time, IWI was the best index for predicting weaning with a sensitivity of 0.97 (12). In the Nemer et al. study, 18% of patients who tolerated the SBT, were re-intubated. IWI index predicted extubation failure in nine out of 10 patients who presented unsuccessful extubation. IWI presented the highest probability of weaning success when the test was positive (0.99) and the lowest probability of weaning success when the test was negative (0.14). The likelihood ratios of IWI positive and negative tests were 16.05 and 0.03 respectively. The area under the ROC curves for IWI was (0.96 ± 0.02) (6).
According to our results, Integrative Weaning Index compared to the physicians’ selected indexes had higher sensitivity, specificity, positive and negative predictive values, positive and negative likelihood ratios and accuracy. However, reminding that this judgment may be incomplete and require further research, for predicting successful weaning, in addition to clinical signs, a valid predictor index is required. From 1991 to 2009, RSBI with a sensitivity of 95% was introduced as the best index and in 2009 the Integrative Weaning Index with sensitivity of 97% and positive predictive value of 99% was introduced and considered as the best index due to its three components of oxygen saturation, static compliance and RSBI.
To determine the validity of this scale, it was studied for 13 months in six ICU patients with different characteristics, and sensitivity of 94.59, Specificity equal to 66.67, positive predictive value of 97.22, negative predictive value equal to 50, positive likelihood ratio of 2.84, negative likelihood ratio equal to 0.08 and accuracy of 92.5 were obtained; this was consistent with Nemer's study in 2009 and could prove persistence of successful weaning in a 48-hour period with an accuracy above 90%. In our study, the comparison of IWI to current indexes showed that IWI had better predictive validity for weaning patients from mechanical ventilation in the Iranian intensive care units than the routine indexes and by using this index, intubation and its complications can be reduced.
5.1. Main Limitations of the Study
According to several medical centers, it was tried to use the similar sampling equipment, but not necessarily the same ones.