
1. Background
Chronic obstructive pulmonary disease (COPD) is a progressive disease with significant morbidity and mortality worldwide. It is the most common cause of death among respiratory diseases, and its related mortality account for 41.9 per 100,000 individuals among all deaths (1). With frequent exacerbations, COPD patients encounter a serious challenge in increasing mortality in both short- and long-term periods after an exacerbation. Several studies have been planned to determine the prognostic factors of patients with exacerbated COPD (2). The World Health Organization predicts that deaths from the disease will continue to rise by 2030 (2).
About 5% of patients admitted to hospitals with a COPD exacerbation died during hospital stay, and long-term mortality rates reported in the literature are quite variable (3). The respiratory rate at the time of admission, age, and comorbid factors, including diabetes, are some of the influential factors in prognosis (4). Singanayagam et al., in a review study, determined the predictors of mortality in short-, medium-, and long-term follow-ups in hospitalized adults with acute exacerbation of COPD (5). Some determining factors in the short-term mortality were age, low body mass index, and high troponin I level.
Since there are several factors influencing the in-hospital prognosis of exacerbated COPD whose role is not precisely identified or their impact has not been definitively determined, further studies in this field will shed light on better management of hospitalized patients with COPD exacerbation. Knowledge about the involved factors in increasing mortality can help physicians to adjust conditions by intervening in a timely manner. Despite the studies conducted to date, it is still not possible to provide a comprehensive guideline in this regard, and further studies are needed in this regard.
2. Objectives
The present study will investigate disease-related factors, including the COPD Assessment Test (CAT) and shortness of breath based on the standard, modified Medical Research Council (mMRC) questionnaire, concomitant with inflammatory markers concerning the in-hospital outcomes of hospitalized patients with COPD exacerbation.
3. Methods
The present prospective cross-sectional study was conducted on 74 known cases of COPD admitted to Vali-e-Asr Hospital in Birjand (affiliated with Birjand University of Medical Sciences, Birjand, Iran) due to COPD exacerbation. Chest X-ray was performed to rule out acute typical bacterial pneumonia. The inclusion criteria were inpatients due to COPD exacerbation characterized by lack of a concomitant significant end-organ disease, such as diabetes, kidney failure, heart failure, cirrhosis, or cancer. The participants entered the study based on a simple census available method with informed consent. This project was reviewed and approved by the Ethics Committee of Birjand University of Medical Sciences (code: IR.BUMS.REC.1398.248).
Oxygen saturation was measured by pulse oximetry at the time of admission; however, the patient had not received oxygen for at least 15 minutes. Blood samples were obtained from each patient and tested for complete blood count, C-reactive protein (CRP), and procalcitonin (PCT). Venous blood samples were also obtained to measure the partial pressure of carbon dioxide (pCO2), pH, and HCO3 under standard conditions. Vital signs (i.e., blood pressure, respiratory rate, and heart rate) were recorded in a checklist. The patient’s clinical condition was assessed based on the CAT scoring system and recorded (6). The CAT scoring is a tool with a score between 0 and 40; higher scores indicate a worse patient’s clinical condition (Appendix 1 in the supplementary file). The Persian translation of CAT has been previously validated in studies conducted by Fakharian et al. and Sigari and Ghafoori (7, 8).
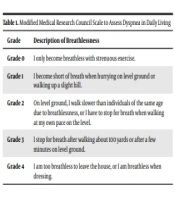
The patient’s shortness of breath was also scored based on the standard mMRC questionnaire (9). The mMRC tool includes answers to five items from various physiological activities that cause shortness of breath in five grading levels from 0 to 4. The patient read the 5-point mMRC scale presented on a sheet and marked the grade (0 to 4) that most closely matched his/her breathlessness. Higher scores represent more breathlessness (Table 1).
Table 1.
Modified Medical Research Council Scale to Assess Dyspnea in Daily Living
| Grade | Description of Breathlessness |
|---|---|
| Grade 0 | I only become breathless with strenuous exercise. |
| Grade 1 | I become short of breath when hurrying on level ground or walking up a slight hill. |
| Grade 2 | On level ground, I walk slower than individuals of the same age due to breathlessness, or I have to stop for breath when walking at my own pace on the level. |
| Grade 3 | I stop for breath after walking about 100 yards or after a few minutes on level ground. |
| Grade 4 | I am too breathless to leave the house, or I am breathless when dressing. |
The patients were divided into three groups based on hospitalization events, including favorable (patients who needed hospitalization for less than 4 days), unfavorable (patients who needed hospitalization for more than 4 days), and worse or terrible (patients who needed intensive care unit (ICU) care). The studied parameters in each of these groups were evaluated and compared.
3.1. Statistical Analysis
SPSS software (version 16) was used for statistical analysis. Qualitative variables were described using numbers and percentages, and quantitative variables were described using mean and standard deviation. One-way analysis of variance with Tukey post-hoc test was used to test for differences among normal quantitative variables’ means. The Kruskal-Wallis H test, Mann-Whitney U test, and Bonferroni correction were used to test for differences among non-normal quantitative variables. Moreover, median and chi-square tests were used for qualitative variables. The ordinal logistic regression model and odds ratio (OR) interpretation were used to determine the most important determinants of hospitalization events. A significance level of 0.05 was considered in all the tests.
4. Results
Out of 74 patients, 43 (58.1%) and 31 (41.9%) subjects were male and female, respectively. The patients’ mean age was 68.19 ± 10.62 years. The groups with favorable, unfavorable, and worse outcomes accounted for 36.48% (n = 27), 40.54% (n = 30), and 22.97% (n = 17) of the subjects, respectively. Table 2 shows the demographic characteristics of the studied patients in subdivided groups.
Table 2.
Comparison of Demographic Characteristics in Studied Patients Based on Hospitalization Events a
| Demographic Data | Favorable Event | Unfavorable Event | Ominous Event | P-Value |
|---|---|---|---|---|
| Age (y) | 68.77 ± 10.17 | 68.33 ± 12.16 | 67 ± 8.75 | 0.86 |
| Smoking (pack-year) | 8.11 ± 104 | 7.86 ± 12.47 | 17.94 ± 18.62 | 0.033 |
| Sex | 0.46 | |||
| Male | 14 (32.6) | 20 (46.5) | 9 (20.9) | |
| Female | 13 (41.9) | 10 (32.3) | 8 (25.8) | |
| Oral addiction | 21 (37.5) | 21 (37.5) | 14 (25) | 0.61 |
| Inhaled addiction | 19 (40.4) | 16 (34) | 12 (25.5) | 0.32 |
a Values are expressed as mean ± SD or No. (%).
A history of hospital admission did not have any effect on hospitalization events in new admission. However, four out of five patients with a history of mechanical ventilation (80%) had worse events, and one had favorable events. The patients in the unfavorable group did not have any history of mechanical ventilation. Table 3 shows other parameters of clinical history.
Table 3.
Comparison of Clinical Manifestations and Medical History in Studied Patients Based on Hospitalization Events a
| Clinical History | Favorable Event | Unfavorable Event | Ominous Event | P-Value |
|---|---|---|---|---|
| Disability and shortness of breath | < 0.001 | |||
| Breathless when dressing | 2 (9.1) | 4 (18.2) | 16 (72.7) | |
| Breathless with walking about 100 yards | 12 (42.9) | 15 (53.6) | 1 (3.6) | |
| Breathless with walking up a slight hill | 12 (60) | 8 (40) | 0 (0) | |
| Breathless with strenuous exercise | 1 (25) | 3 (75) | 0 (0) | |
| History of mechanical ventilation | 1 (20) | 0 (0) | 4 (80) | 0.004 |
| Hospitalization history | 22 (34.9) | 26 (41.3) | 15 (23.8) | 0.84 |
| Flapping tremor | 3 (13.6) | 5 (22.7) | 14 (63.6) | < 0.001 |
| CAT score | < 0.001 b | |||
| Mean ± SD | 18.40 ± 5.73 | 21.23 ± 5.15 | 29.76 ± 5.40 | |
| Median (IQR) | 19 (10) | 21 (8) | 29 (7.5) | |
| SpO2 | < 0.001 c | |||
| Mean ± SD | 85.22 ± 9.49 | 78.97 ± 13.60 | 64.47 ± 13.03 | |
| Median (IQR) | 86 (10) | 83 (20) | 60 (14) |
Abbreviations: CAT, COPD Assessment Test; SpO2, peripheral oxygen saturation; F, favorable event group; UF, unfavorable event group; O, ominous event group; SD, standard deviation; IQR, interquartile range.
a Values are expressed as No. (%) unless otherwise indicated.
b Post-hoc test: F-O: P < 0.001; UF-O: P < 0.001.
c Post-hoc test: F-O: P < 0.001.
Among the studied parameters, except platelet count, which did not show statistically significant differences among the three groups, other studied parameters, including PCT, showed statistically significant differences in the group with favorable outcomes in comparison to the groups with unfavorable and terrible outcomes (Table 4).
Table 4.
Comparison of Paraclinical Findings in Studied Patients Based on Hospitalization Events a
| Paraclinical Findings | Favorable Event | Unfavorable Event | Ominous Event | P-Value | Post-hoc Test | |
|---|---|---|---|---|---|---|
| F-O (P-Value) | UF-O (P-Value) | |||||
| PCT | 0.48 ± 1.88/0.03 (01) | 0.15 ± 0.21/0.065 (0.15) | 1.95 ± 2.690.35 (3.54) | 0.001 | 0.019 | 0.03 |
| hs-CRP | 19.37 ± 22.65/10 (24) | 31.53 ± 26.55/24.5 (36.25) | 39.44 ± 24.67/45 (33.75) | 0.029 | 0.029 | |
| WBC | 8.59 ± 4.27/7.19 (3.5) | 8.98 ± 3.32/9.05 (4.5) | 12.37 ± 6.73/9.9 (11.15) | 0.024 | 0.028 | 0.048 |
| Lymp% | 16.45 ± 9.47/13.3 (13) | 15.51 ± 10.19/11.65 (11.5) | 9.71 ± 4.15/9 (6.85) | 0.043 | < 0.04 | |
| PMN% | 73.44 ± 15.68/74 (19) | 76.27 ± 14.4/80.15 (18.75) | 84.22 ± 6.48/86.9 (12) | 0.037 | 0.03 | |
| PLT | 215 ± 71.61/195 (83) | 207 ± 74.26/202 (97.75) | 190 ± 115.63/165 (97.75) | 0.62 | - | |
| pH | 7.34 ± 0.062/7.34 (0.09) | 7.34 ± 0.061/7.33 (0.08) | 7.24 ± 0.082/7.24 (0.11) | < 0.001 | < 0.001 | < 0.001 |
| PaCO2 | 48.40 ± 12.36/48.8 (17) | 55.34 ± 13.36/53.85 (15.22) | 71.64 ± 20.44/62 (37.25) | < 0.001 | < 0.001 | < 0.001 |
Abbreviations: PCT, procalcitonin; hs-CRP, high-sensitivity C-reactive protein; WBC, white blood cells; Lymp%, lymphocyte leukocytes; PMN%, polymorphonuclear leukocytes; PLT, platelets; pH, the potential of hydrogen used to specify the blood acidity; PaCO2, partial pressure of carbon dioxide; F, favorable event group; UF, unfavorable event group; O, ominous event group.
a Values are expressed as mean ± standard deviation/median (interquartile range)
Logistic regression was used to determine the predictor of hospitalization events and outcomes according to the value of high-sensitivity C-reactive protein (hs-CRP), PCT, white blood cell count, neutrophil count percentage, lymphocyte count, CAT score, pCO2, and peripheral oxygen saturation (SpO2), and after removing the collinearity of the predictor variables, the final model was selected from the proposed models using the forward method. Table 3 shows that increasing the CAT score was significantly associated with a higher chance of terrible events (OR = 1.22, confidence interval (CI): 1.10 - 1.35). Higher oxygen saturation reduced the risk of terrible events (OR = 0.94, CI: 0.90 - 0.98). There was no significant correlation between hospitalization events and hs-CRP levels at the time of admission (Table 5).
Table 5.
Predictor Estimation of Studied Parameters by Ordinal Logistic Regression in Studied Patients Based on Hospitalization Events
| Parameters | Coefficient | SE | P-Value | Odds Ratio | CI 0.025 | CI 0.975 |
|---|---|---|---|---|---|---|
| CAT score | 0.20 | 0.05 | 0.00 | 1.22 | 1.10 | 1.35 |
| hs-CRP | 0.02 | 0.01 | 0.11 | 1.02 | 1.00 | 1.04 |
| PCT | 0.34 | 0.17 | 0.04 | 1.001 | 1.01 | 1.95 |
| pCO2 | 0.06 | 0.02 | 0.00 | 1.06 | 1.02 | 1.10 |
| SpO2 | -0.06 | 0.02 | 0.01 | 0.94 | 0.90 | 0.98 |
Abbreviations: CAT, COPD Assessment Test; hs-CRP, high-sensitivity C-reactive protein; PCT, procalcitonin; pCO2, partial pressure of carbon dioxide; SpO2, peripheral oxygen saturation; SE, standard error; CI, confidence interval.
5. Discussion
The present study was performed on patients who had already received maintenance treatment for COPD and were hospitalized due to its exacerbation. The in-hospital outcome of patients admitted with COPD exacerbation, in addition to the quality and intensity of care, depends on several other factors. In one review study, old age, male gender, and advanced stages of the disease were identified as risk factors for short-term mortality (10). These findings are in contrast to the findings of the present study in which age and gender did not play a role in determining the prognosis. However, it should be noted that in the present study, the studied factors were analyzed only concerning in-hospital prognosis.
It has been claimed that patients with COPD exacerbation and hypercapnic respiratory failure encountered a high mortality rate during hospital stay. In such patients, the need for ICU admission is often necessary (11). Some factors, including academia, confusion, the need for oxygen therapy at home, and GOLD Stage IV, are also associated with increased short-term mortality in COPD patients (5, 10). The present study was also associated with the same results. Shortness of breath at rest and experiencing it with light activities, such as putting on clothes, clinical signs of hypercapnic respiratory failure, including flapping tremor, and lower oxygen saturation at the time of admission, were identified as risk factors for terrible events in the present study.
In the present study, the CAT score of patients evaluated on the first day of hospitalization was significantly higher in the group with terrible events than those with favorable or unfavorable events. The CAT score is one of the evaluation methods for patients with COPD, the evaluative value of which has been confirmed (12). The GOLD places patients with a CAT score of more than 10 in the seriously symptomatic status (11). A reduction of at least 2 points in the CAT scores can be associated with clinically significant improvement (13). A study by Pasquale et al. drew the same conclusion (14). They showed that symptomatic patients evaluated based on CAT and mMRC scoring provide important information about the risks of exacerbation and the outcomes of patients in terms of exacerbation. The aforementioned information is even more valuable than having a positive history of COPD exacerbation. They also showed that patient-reported clinical signs evaluated by CAT scoring were more valuable in determining patient prognosis than clinical signs evaluated by the mMRC scoring system (14). The present study also showed that a history of hospitalization or use of antibiotics was not a determinant of prognosis unless there was a positive history of mechanical ventilation. The current study’s findings can be consistent with the findings of Hartl et al. (10). They demonstrated that the risk of readmission, respiratory failure, and death would be higher in COPD patients if they had a history of ICU admission and management by ventilation support (including non-invasive ventilation) (10).
The frequency of smokers was significantly higher in the group with terrible events than those with favorable and unfavorable events in the present study. Smoking can also affect the severity of COPD exacerbation and increase the risk of adverse consequences. In order to verify this issue, an observational study showed that non-smoker COPD patients experienced milder attacks of exacerbation than current smoking COPD patients (15).
Systemic, persistent inflammation in COPD patients, especially in those with exacerbation, is characterized by an increase in inflammatory markers, such as hs-CRP. The Evaluation of COPD Longitudinally to Identify Predictive Surrogate Endpoints (ECLIPSE) study says that there is a close relationship between the clinical course of COPD and the intensity of systemic inflammation (16). In the present study, patients with terrible events had higher hs-CRP. However, it could not determine the odds of in-hospital adverse events. Prins et al. suggest that CRP might be a good biomarker in determining whether an exacerbated COPD requires antibiotic treatment (17). However, Francis et al. believe that having purulent sputum is only as valuable as high CRP levels in decision-making to prescribe antibiotics during COPD exacerbation (18). In accordance with one study conducted in 2006 it was shown that CRP is a valuable predictor of COPD hospitalization and death. This study was performed on COPD patients in stable conditions who were followed for a long time (19). However, the present study focused on hospital events of hospitalized COPD patients with exacerbation; therefore, it should have different results.
Various studies have shown that the ratio of neutrophils to lymphocytes is a valuable predictor in the onset and mortality of patients with COPD exacerbation (20). The present study showed that patients in the group with terrible outcomes had a significantly higher percentage of blood neutrophils than the other groups. Platelet count as an acute phase reactant and acute inflammatory marker might increase during exacerbation of inflammation (including COPD exacerbation). However, in the present study, this parameter did not play a role in determining the outcomes of patients with COPD exacerbation during hospital stay. In a previous study, an increase in platelet count and high platelet-to-lymphocyte ratio were observed during acute exacerbation of COPD; nevertheless, its role in determining in-hospital prognosis was not identified (21).
The PCT increases in bacterial pulmonary infections; nevertheless, it is not affected by non-bacterial infection or inflammation by another mechanism, including viral infections (22). Given the main role of bacterial infection in triggering COPD exacerbation, it is expected that serum PCT levels will also increase proportionally (22). An interesting point in the present study was significantly higher serum levels of PCT in the group with terrible events than in those with favorable and unfavorable events. Altogether, the results of the present study suggest that the levels of PCT in patients with acute aggravation might reflect the severity of COPD and be used as a reference value for prognostic risk assessment. Gong et al. also studied the effect of PCT on the prognosis of COPD patients and concluded that PCT serum levels might reflect the severity of exacerbated COPD and predict the duration and cost of hospitalization (23). Overall, it can be claimed that patients with COPD exacerbation triggered by bacterial agents have a worse prognosis than other COPD exacerbations induced by non-bacterial factors. Therefore, PCT can be an important factor in differentiating bacterial-induced COPD exacerbation from non-bacterial and proper treatment planning for patients with exacerbation conditions.
5.1. Conclusions
Patients with a history of smoking, higher pCO2, and low SpO2 at the time of hospital admission are prone to the more serious consequences of the in-hospital course. Based on the current study’s results, the CAT score is considered a significant in-hospital prognostic factor. Additionally, the score of the mMRC and signs of asterixis are valuable criteria in determining in-hospital prognosis in patients with COPD exacerbation. Age, gender, and history of hospitalization (except for a history of mechanical ventilation) were not determinant factors in short-term prognosis during hospitalization. The hs-CRP as an acute phase reactant inflammatory marker did not show significant odds in determining the in-hospital prognosis of patients with COPD exacerbation. However, PCT was associated with in-hospital poor prognosis in patients with COPD exacerbation.