


1. Background
2. Objectives
3. Methods
3.1. Study Population and Sample Collection
3.1.1. Sample Size and Methodology
3.1.2. Age Range of Participants
3.2. Human Papillomavirus Genome Extraction
3.3. PCR Testing for Human Papillomavirus Detection
3.4. Primer Sequences Used in PCR Reactions
3.5. Human Papillomavirus Genotyping in Positive Samples
3.6. Data Analysis
3.7. Ethical Considerations
4. Results
4.1. PCR Results
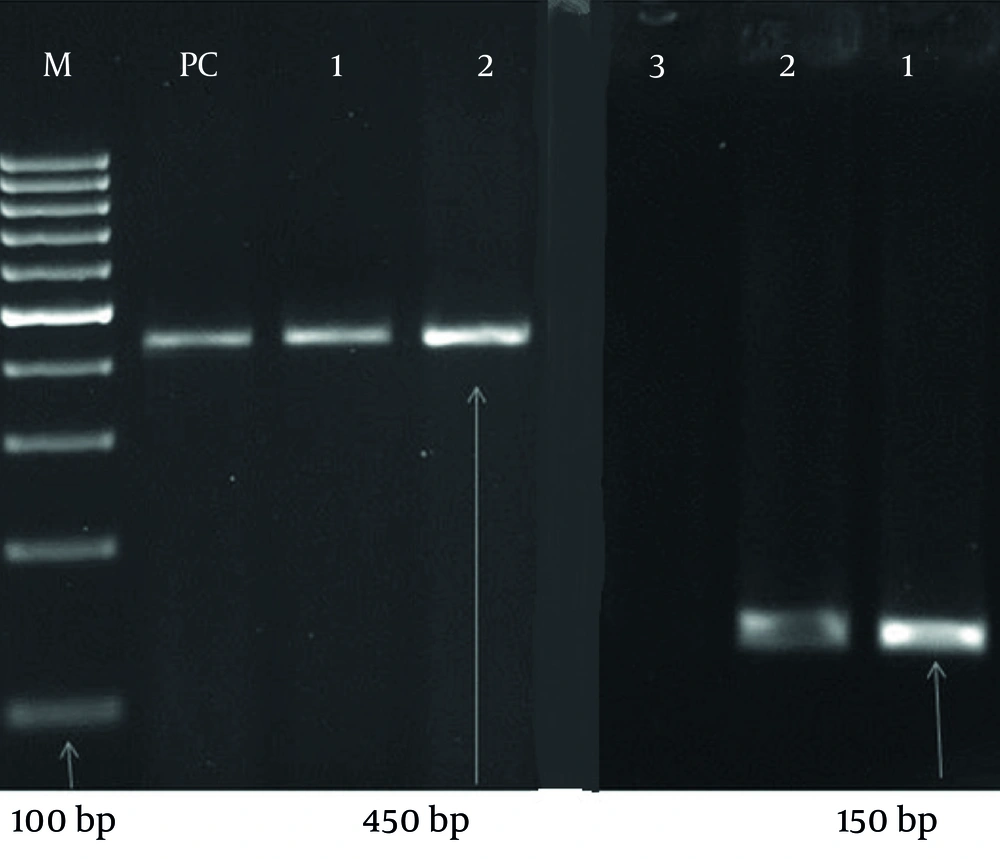
PCR detection of the human papillomavirus (HPV) genome in 290 samples using specific primers GP5+/6+ and MY09/11. Among the samples, 216 (74.5%) tested positive, while 74 (25.5%) were negative. The negative control well showed no bands, indicating no contamination, whereas the positive control well showed bands at 450 bp and 180 bp, confirming the accuracy of the PCR assay.
4.2. Genotyping of Positive Samples
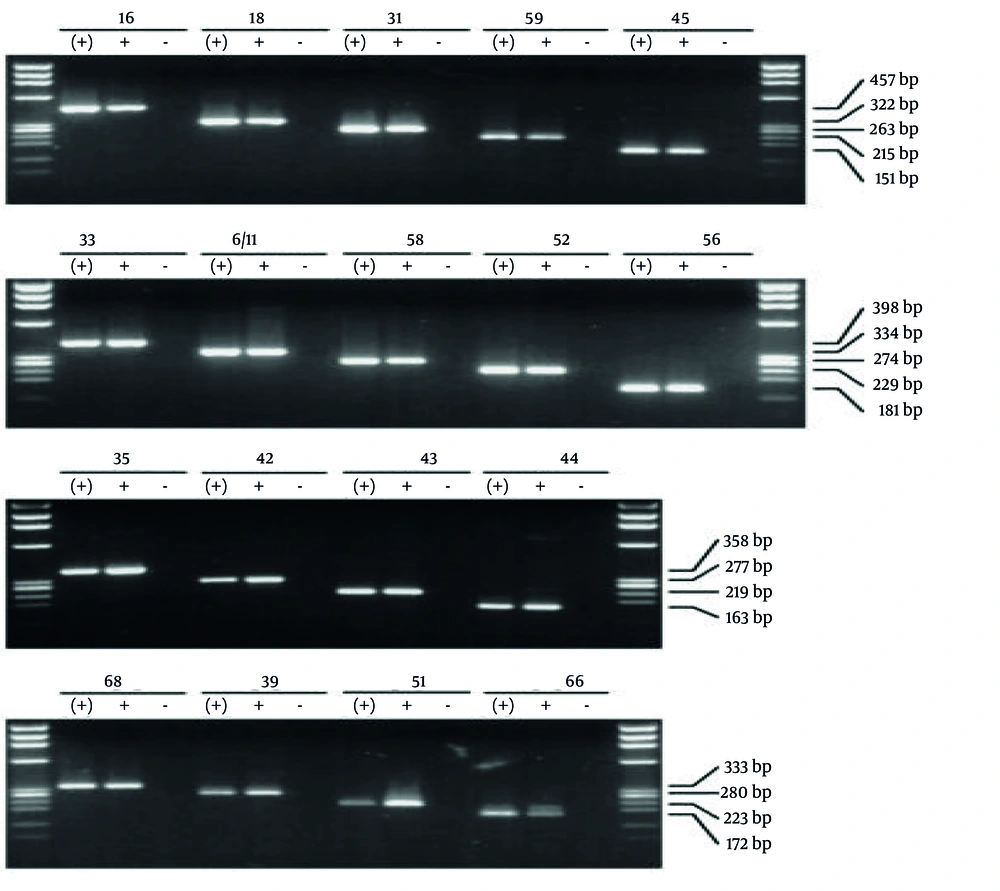
The image illustrates the bands from reference samples used to determine the low-risk and high-risk human papillomavirus (HPV) genotypes. Genotyping was performed using the multiplex PCR method with 20 pairs of specific primers. Each sample was processed using four wells, and the obtained bands were compared with those of the reference samples shown in the figure to accurately identify the genotypes.
| Genotype | Percentage |
|---|---|
| 6 | 70.7 |
| 11 | 35.2 |
| 81/62 | 20.7 |
| 43 | 19.6 |
| 42 | 12.1 |
| 54 | 4.8 |
| 55 and 44 | 3.4 |
a Out of 290 samples, 200 (68.9%) tested positive for low-risk genotypes, with HPV6 being the most prevalent at 70.7%. Additionally, 135 (46.6%) were positive for high-risk genotypes.
| Genotype | Percentage |
|---|---|
| 39 | 29.7 |
| 51 | 21.4 |
| 52 | 18.9 |
| 66 | 14.5 |
| 16 | 12.7 |
| 18 and 45 | 5.8 |
| 53 | 5.5 |
| 31 | 5.2 |
| 35 | 3.8 |
| 82 | 2.1 |
| 56 and 68 | 1.7 |
| 59 | 1.4 |
a HPV39 was the most frequently identified, accounting for 29.7% of the positive samples, followed by other high-risk genotypes; No other low-risk or high-risk genotypes were detected in the samples.
4.3. Coinfection Analysis
| Description | Samples |
|---|---|
| Multiple HPV genotype infection | 216 (74.5) |
| Multiple HR genotype infection | 135 (46.6) |
| Multiple LR genotype infection | 200 (68.9) |
| Infection with both 16 and 18 genotypes | 9 (3.1) |
| Infection with both 6 and 11 genotypes | 83 (28.6) |
| Infection with 6, 11, 16 and 18 genotypes | 6 (2.1) |
Abbreviation: HPV, human papillomavirus.
a Values are expressed as No. (%).
b This table shows the distribution of coinfection with different HPV genotypes, highlighting the prevalence of multiple low-risk (LR) and high-risk (HR) genotype infections, as well as specific coinfections with genotypes 16 and 18, 6 and 11, and a combination of 6, 11, 16, and 18.
4.4. Age Analysis and Genotype Correlation
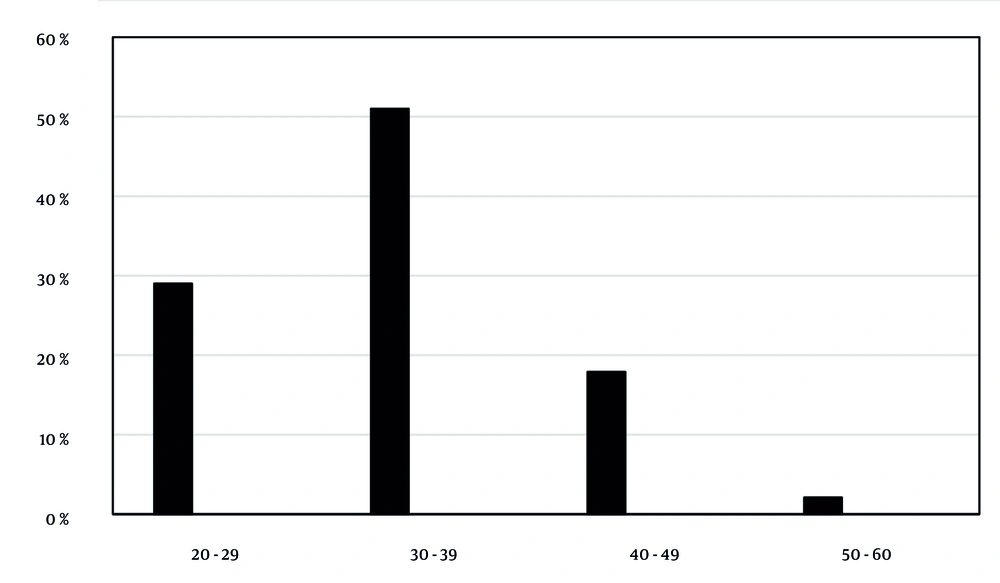
Age distribution of patients and human papillomavirus (HPV) positive cases. Patients were divided into age groups: 20 - 29 years (29%), 30 - 39 years (51%), 40 - 49 years (17.9%), and 50 - 60 years (2.1%). The highest number of positive cases was in the 30 - 39 years group. No significant correlation between age and HPV genotype was found (P-value > 0.05).
