
1. Background
Obesity is recognized as a primary risk factor for premature mortality, largely because of its association with various chronic noncommunicable diseases (1). Individuals classified as having overweight or obesity have lower levels of musculoskeletal fitness than individuals with normal weight, leading to diminished functional capacity, numerous physical limitations, and impaired motor skill performance (2). These factors collectively reduce quality of life and increase the risk of injury (15% - 48%) during daily activities and exercise (3). Physical inactivity also plays an important role in the obesity crisis, with a large proportion of the global population not achieving recommended levels of physical activity (4). A lack of regular exercise not only contributes to weight gain but also adversely affects metabolic health (4).
In recent years, many studies have evaluated the efficacy of various medicinal plants on inflammatory markers and related factors in individuals with overweight or obesity. Thyme (Thymus vulgaris) is an aromatic medicinal herb with various properties, including anti-inflammatory and antioxidant effects, attributed to active compounds such as thymol and carvacrol (5). This herb contributes to improved respiratory, digestive, and immune system function. In addition, thyme consumption may assist with weight loss, liver detoxification, and stress reduction (5).
The association between microRNA expression in individuals with overweight or obesity and the onset of obesity-related diseases is influenced by the regulation of essential genes involved in metabolic and inflammatory pathways (6). Recent research indicates that alterations in miRNA expression can affect cellular oxidative balance, creating a detrimental cycle between oxidative stress and miRNA function that contributes to the development of conditions such as diabetes, nonalcoholic fatty liver disease, and cardiovascular disease (7). Moreover, certain miRNAs change in response to physical activity, and these alterations are correlated with reduced body fat and improved inflammatory markers (8). Specifically, miRNAs such as miRNA-146 and miRNA-223 have been identified as key regulators of lipid profiles, making them important targets for understanding the metabolic effects of exercise (9, 10).
Several human studies have indicated that miR-146b levels are elevated in adipose tissue samples from individuals classified as having overweight or obesity compared with those from lean individuals. MiR-146b is predominantly expressed in mature adipocytes, and its expression is influenced by the developmental stage of these cells. In vitro, miR-146b has been shown to suppress the proliferation of visceral preadipocytes while promoting their differentiation by inhibiting the transcription factor KLF7, which acts as a negative regulator of adipogenesis (8, 11). Elevated miRNA-146 has been observed to function as a negative feedback mechanism, resulting in reduced inflammation (12). Conversely, thyme, which has anti-inflammatory properties, in combination with exercise training, may exert a dual synergistic effect. Therefore, changes in C-reactive protein (CRP), an important inflammatory marker in various diseases, including obesity, may provide further insight into this issue. The most effective exercise approaches for preventing and treating obesity must consider several key factors, including intensity, volume, frequency, and exercise type.
2. Objectives
This study aimed to evaluate the effects of moderate-intensity exercise combined with thyme supplementation on the expression levels of miRNA-223 and miRNA-146, as well as on various metabolic parameters, in women with overweight or obesity. By identifying the distinct effects of these approaches, this study sought to inform the development of tailored exercise programs that effectively address obesity and related metabolic issues.
3. Methods
3.1. Study Design and Participants
In this quasi-experimental study, 45 women aged 35 - 40 years who were classified as having overweight or obesity were recruited from local community centers and fitness facilities using convenience sampling. Inclusion criteria were a BMI of 25 - 29.5 kg/m2 for overweight or 30 - 40 kg/m2 for obesity. Participants were required to have no history of chronic illness, such as cardiovascular disease or diabetes, that could limit their ability to participate in physical exercise. In addition, participants had to be physically inactive, defined as engaging in less than 150 minutes of moderate-intensity exercise per week for at least 6 months before the study.
Exclusion criteria included pregnancy or breastfeeding, recent surgery, or injuries that could affect the ability to participate in physical activity. Individuals using medications that influence metabolism or weight, such as steroids or weight-loss medications, were also excluded. Any medical condition that contraindicated exercise participation according to the American College of Sports Medicine guidelines was an additional reason for exclusion.
Participants were randomly assigned to 3 groups, with 15 individuals in each group. Because of substantial absenteeism, 6 participants from the combined training group, 6 participants from the combined training plus thyme group, and 7 participants from the resistance training group were excluded from the study. Therefore, the final analysis included data from 8 participants in the combined training group, 9 participants in the combined training plus thyme group, and 9 participants in the resistance training group. All groups participated in an 8-week exercise program consisting of 3 sessions per week (Table 1 and 2). At baseline, participants completed a general health and wellness questionnaire and provided written informed consent to confirm their voluntary participation.
Table 1.
Summary of the Combined Training Protocol
| Training Section | Weeks 1 - 4 | Weeks 5 - 8 |
|---|---|---|
| Resistance training section | ||
| 1-repetition maximum | 60 - 70% | 75 - 80% |
| Barbell shoulder press | 3 × 12 | 3 × 12 |
| Dumbbell front press | 3 × 12 | 3 × 12 |
| Dumbbell squat | 3 × 12 | 3 × 12 |
| Side lunge | 3 × 12 | 3 × 16 |
| Side plank | 3 × 12 | 3 × 16 |
| Parallel abs | 3 × 12 | 3 × 16 |
| Aerobic training section | ||
| Stationary bike (min) | 10 | 20 |
| Jumping jack (s) | 3 × 30 | 3 × 40 |
| Aerobic step exercise (s) | 3 × 30 | 3 × 40 |
| Rope jumping (s) | 3 × 30 | 3 × 40 |
| Running on a treadmill (min) | 10 | 20 |
| Mountain climbers movement (s) | 3 × 20 | 3 × 30 |
| Training Variable | Weeks 1 - 4 | Weeks 5 - 8 |
|---|---|---|
| Intensity | ||
| 1-repetition maximum | 60 - 70% | 75 - 80% |
| Barbell shoulder press | 3 × 12 | 3 × 12 |
| Dumbbell front press | 3 × 12 | 3 × 12 |
| Dumbbell squat | 3 × 12 | 3 × 12 |
| Barbell squat | 3 × 12 | 3 × 16 |
| Side lunge | 3 × 12 | 3 × 16 |
| Side plank | 3 × 12 | 3 × 16 |
| Parallel abs | 3 × 12 | 3 × 16 |
| Bicycle crunch | 3 × 15 | 3 × 18 |
a Participants warmed up for 10 - 15 minutes before each session.
b The overload principle of training was applied in the fifth week by changing the 1-repetition maximum values or increasing resistance or the number of movements by 5% - 10%.
c The rest interval between sets was 2 - 3 minutes.
d The exercise order was planned as lower body to upper body to reduce fatigue during performance.
e The body cool-down phase was performed at the end of each session for 5 - 10 minutes.
The study protocol was approved and registered by the ethics committee of the University of Isfahan (IR.UI.REC.1404.123) and the Iranian Registry of Clinical Trials (IRCT20250902067085N1). One week before the study began, weight, body fat percentage, and maximal oxygen consumption were measured. The first blood sample was obtained within 48 hours before the first training session, and the second blood sample was collected 48 hours after the final training session. Participants refrained from physical activity for at least 24 - 48 hours before their laboratory visit. In this study, the participants' age precluded precise regulation of menstrual cycles throughout the exercise interventions and assessments, representing a major limitation. Anthropometric, cardiovascular, and muscular fitness parameters, miRNA levels, and lipid profiles were analyzed before and after the training sessions.
3.2. Intervention Protocols
The training protocols were developed by the researchers based on findings from previous studies. Participants completed 2 distinct training protocols, as described below.
Combined training: Participants in this group performed a combination of resistance exercises and aerobic activities. In the combined training protocol, which included both resistance training and interval aerobic training, resistance training was performed first after an adequate warm-up. After a 10- to 15-minute rest period, aerobic interval training was performed according to the specified protocol (Table 1) (13).
Combined training plus thyme supplementation: In this protocol, resistance training was performed first after an adequate warm-up. After a 10- to 15-minute rest period, aerobic interval training was performed according to the designated protocol. This group also consumed 750 mg of thyme extract tablets, manufactured by Behchino Medicinal Plant Processing Company (Shiraz, Iran), under the supervision of a trainer before the start of the training session (Table 1) (14).
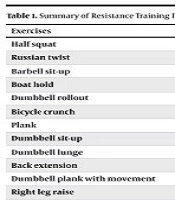
Resistance training: This group participated in a systematic resistance training program targeting the major muscle groups and incorporating exercises such as the barbell shoulder press, dumbbell front press, dumbbell squat, and barbell squat. Training intensity was gradually increased to ensure optimal overload and adaptation (Table 2) (14).
3.3. Laboratory Measurements
Initially, microRNAs were extracted from serum samples using the PAXgene Blood miRNA Kit (Qiagen, Germany), according to the manufacturer's instructions. Subsequently, a cDNA synthesis kit was used for reverse transcription of the extracted RNAs, according to the manufacturer's recommended protocols. The human miRNA-146 and miRNA-223 sequences were retrieved from the miRBase database, and the required primers were designed using the web-based miRNA design tool to facilitate reverse transcription and quantitative polymerase chain reaction (qPCR). Reverse transcription and qPCR procedures were performed using a kit provided by Anasal Company (Tehran, Iran), which included the primer sequences and a SYBR Green-based Master Mix. In this study, U6 was used as the control gene (15).
Fasting blood samples were obtained after a 12-hour overnight fast to measure biochemical parameters. Serum levels of total cholesterol, triglycerides, high-density lipoprotein, and low-density lipoprotein were measured using an enzymatic colorimetric method under standard conditions with DELTA DARMAN PART kits (Iran). C-reactive protein levels were assessed using the sandwich enzyme-linked immunosorbent assay method with the high-sensitivity CRP kit.
3.4. Anthropometric Measurements
Anthropometric assessments were performed at baseline and after the intervention using standardized procedures. Body weight was measured using a calibrated digital scale to the nearest 0.1 kg. Height was measured using a stadiometer to the nearest 0.1 cm. Body mass index was calculated using the following formula: BMI=weight (kg)/height (m)2 (15).
Body fat percentage was indirectly evaluated using a 4-compartment skinfold thickness equation (16):
%Fat = 22.18945 + (age × 0.06368) + (BMI × 0.60404) - (Ht × 0.14520) + (Ʃ4 × 0.30919) -(Ʃ42 × 0.00099562)
Where: Ht is in cm and Ʃ4 = the sum of skinfold as specified.
3.5. Cardiorespiratory and Muscular Fitness Assessments
Cardiorespiratory fitness was assessed using the Brockport 1609-m walking/running test. This test is commonly used to evaluate cardiorespiratory fitness and has been confirmed as a reliable indicator of maximal oxygen uptake (VO2max) (17). VO2max was calculated using an equation established in previous research (17):
VO2max (mL/kg/min) = 132.853 + (0.1692 × Body mass in kg) - (0.3877 × age in years) + (6.315 × gender) - (3.2649 × Time in minutes) – (0.1565 × HR)
Where: 1 if male or 0 if female, and HR: heart rate.
Muscular endurance was evaluated using a push-up test, in which female participants performed knee push-ups. The total number of completed push-ups was recorded (17). Hand-grip strength was measured using an adjustable spring hand dynamometer (SAEHAN, South Korea), with a resolution of 0.5 kg. Each participant completed 3 trials with the dominant hand, with a 60-second rest interval between measurements, and the highest recorded value was used (18). Abdominal muscular endurance was assessed using a sit-up test, and the total number of sit-ups performed was recorded (18).
3.6. Statistical Analysis
Data were analyzed using SPSS software version 21 (IBM, New York, USA). Descriptive statistics were used to calculate the mean and standard deviation for the measured variables. The Shapiro-Wilk test was used to assess normality. Paired t tests were used for within-group comparisons, and analysis of covariance was used for between-group comparisons. The significance level was set at P ≤ 0.05.
4. Results
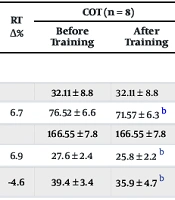
Between-group differences in body weight, BMI, and body fat percentage were not statistically significant (P > 0.05) (Table 3). After 8 weeks of exercise, significant within-group reductions in miRNA-146 expression were observed in the resistance training (RT; -37.9%), combined training (COT; -59.9%), and combined training plus thyme (COT + thyme; -32.2%) groups compared with baseline (P < 0.001). Significant within-group reductions in miRNA-223 expression were also observed in the RT (-39.0%), COT (-24.3%), and COT + thyme (-36.5%) groups compared with baseline (P < 0.001). Significant pretest-posttest differences were observed for low-density lipoprotein in the COT group (-11.3%; P < 0.05), triglycerides in the COT group (-1.5%; P < 0.05), and total cholesterol in the COT + thyme group (-9.4%; P < 0.05). In addition, the COT + thyme group showed potential additive effects in reducing CRP levels (-43.6%) compared with baseline values and relative to the RT (-23.3%) and COT (-27.2%) groups (Table 4).
Table 3.
Baseline Anthropometric Characteristics of the Exercise Intervention Groups a
| Measured Variables | RT (n = 9) | RT Δ% | COT (n = 8) | COT Δ% | COT + T (n = 9) | COT + T Δ% | Between-Group P Value | |||
|---|---|---|---|---|---|---|---|---|---|---|
| Before Training | After Training | Before Training | After Training | Before Training | After Training | |||||
| Anthropometric parameters | ||||||||||
| Age (y) | 37.13 ± 6.7 | 37.13 ± 6.7 | 32.11 ± 8.8 | 32.11 ± 8.8 | 31.89 ± 9.2 | 31.89 ± 9.2 | - | |||
| Weight (kg) | 78.56 ± 7.3 | 73.27 ± 5.7 b | 6.7 | 76.52 ± 6.6 | 71.57 ± 6.3 b | 6.5 | 77.52 ± 6.6 | 74.35 ± 4.8 c | 4.1 | 0.151 |
| Height (cm) | 168.12 ± 6.6 | 168.12 ± 6.6 | 166.55 ± 7.8 | 166.55 ± 7.8 | 164.80 ± 8.1 | 164.80 ± 8.1 | - | |||
| BMI (kg/m2) | 27.8 ± 2.4 | 25.9 ± 2.3 b | 6.9 | 27.6 ± 2.4 | 25.8 ± 2.2 b | 6.5 | 28.6 ± 2.8 | 27.4 ± 2.3 c | 4.2 | 0.129 |
| Body fat percentage | 37.0 ± 4.1 | 35.3 ± 8.4 b | -4.6 | 39.4 ± 3.4 | 35.9 ± 4.7 b | 8.9 | 40.0 ± 3.5 | 38.6 ± 3.2 b | 3.5 | 0.040 c |
a Values are expressed as mean ± SD. Abbreviations: BMI, Body Mass Index; COT, combined training; COT + T, combined training plus thyme; RT, resistance training.
b P ≤ 0.01 is highly significant.
c P ≤ 0.05 is significant.
Table 4.
Comparison of MicroRNAs, Biochemical Parameters, and Muscular and Cardiorespiratory Fitness Before and After Exercise in the Exercise Intervention Groups a
| Measured Variables | RT (n = 9) | RT Δ% | COT (n = 8) | COT Δ% | COT + T (n = 9) | COT + T Δ% | Between-Group P Value | |||
|---|---|---|---|---|---|---|---|---|---|---|
| Before Training | After Training | Before Training | After Training | Before Training | After Training | |||||
| Biochemical parameters | ||||||||||
| miR-146 (ΔCt) | 3.58 ± 1.4 | 2.22 ± 1.6 b | -37.9 | 5.26 ± 6.3 | 2.11 ± 1.04 | -59.9 | 2.62 ± 0.80 | 1.75 ± 0.94 b | -32.2 | 0.777 |
| miR-223 (ΔCt) | 3.64 ± 1.1 | 2.22 ± 1.5 b | -39.0 | 3.71 ± 1.5 | 2.43 ± 1.7 b | -24.3 | 3.37 ± 0.92 | 2.14 ± 1.1 b | -36.5 | 0.847 |
| HDL (mg/dL) | 49.8 ± 9.5 | 49.3 ± 9.8 | -1.0 | 51.4 ± 7.6 | 53.6 ± 6.6 | 4.3 | 52.7 ± 11.1 | 54.2 ± 11.4 | 2.8 | 0.594 |
| LDL (mg/dL) | 83.7 ± 14.5 | 77.5 ± 14.9 | 7.4 | 89.4 ± 16.5 | 79.3 ± 14.1 b | 11.3 | 106.3 ± 20.01 | 93.3 ± 23.9 | 12.2 | 0.933 |
| Cholesterol (mg/dL) | 152.2 ± 16.8 | 141.8 ± 23.7 | 6.8 | 154.3 ± 21.9 | 145.8 ± 23.1 | 5.5 | 181.3 ± 27 | 164.3 ± 23.8 c | 9.4 | 0.955 |
| Triglycerides (mg/dL) | 154.3 ± 90.6 | 119.8 ± 54.6 | 22.4 | 107.0 ± 25.7 | 90.7 ± 25.9 b | 1.5 | 113.2 ± 44.2 | 104.4 ± 37.6 | 7.8 | 0.673 |
| CRP (mg/L) | 2.36 ± 1.2 | 1.81 ± 0.52 | -23.3 | 2.50 ± 1.1 | 1.82 ± 0.66 | -27.2 | 2.98 ± 2.7 | 1.68 ± 0.47 | -43.6 | 0.807 |
| Muscular and cardiorespiratory fitness | ||||||||||
| Hand-grip strength (kg) | 26.2 ± 6.5 | 31.1 ± 7.3 c | 18.7 | 26.2 ± 5.4 | 31.7 ± 5.8 b | 20.9 | 21.5 ± 3.3 | 26.7 ± 6.1 c | 24.1 | 0.944 |
| Sit-up (count) | 24.6 | 30.0 | 21.9 | 30.8 | 34.6 b | 12.3 | 23.6 | 26.3 b | 11.4 | 0.246 |
| VO2max (mL/kg/min) | 43.1 ± 8.4 | 47.1 ± 8.9 b | 9.3 | 41.4 ± 8.3 | 46.8 ± 6.2 c | 13.4 | 41.1 ± 11.5 | 44.9 ± 11.4 c | 9.24 | 0.720 |
a Values are expressed as mean ± SD. Abbreviations: COT, combined training; COT + T, combined training plus thyme; CRP, C-reactive protein; HDL, high-density lipoprotein; LDL, low-density lipoprotein; RT, resistance training; VO2max, maximum oxygen consumption.
b P ≤ 0.01 is highly significant.
c P ≤ 0.05 is significant.
Regarding fitness parameters, significant within-group differences were observed for hand-grip strength in the RT (18.7%), COT (20.9%), and COT + thyme (26.7%) groups; sit-ups in the RT (21.9%), COT (12.3%), and COT + thyme (11.4%) groups; and VO2max in the RT (9.3%; P < 0.001), COT (13.4%; P < 0.05), and COT + thyme (9.24%; P < 0.05) groups compared with baseline. After the 8-week exercise intervention, significant within-group differences in body fat percentage were observed in the RT (-4.6%; P = 0.001), COT (-8.9%; P = 0.001), and COT + thyme (-3.5%; P = 0.001) groups (Table 3). Except for body fat percentage (P = 0.04), no between-group differences were observed for any variables (P > 0.05) (Table 3 and 4).
5. Discussion
The present study evaluated the effects of 3 exercise training modalities—resistance training, combined training, and combined training supplemented with thyme—on miRNA-146 and miRNA-223 levels and lipid profiles in women with overweight or obesity. The results indicated significant reductions in miR-146 and miR-223 expression levels compared with baseline measurements; however, no significant differences were observed among the 3 groups. The findings regarding reduced miR-146 are consistent with those of Sawada et al. (19) but differ from those reported by Russo et al. (20). Regarding miR-223 expression, the present findings corroborate those of de Gonzalo-Calvo et al. (21) but contrast with the results reported by Wen et al. (22) and Dias et al. (23). These findings indicate that differences in training type, timing of analysis, protocols, and sample characteristics may lead to distinct miRNA expression patterns.
MiR-146b levels in adipose tissue samples from individuals classified as having overweight or obesity were elevated compared with those in lean individuals. MiR-146b is highly expressed in mature adipocytes, with levels fluctuating according to the developmental stage of these cells (9). Similarly, Ahn et al. (24) demonstrated that the most substantial fold change in miRNA-146b occurs in mature adipocytes, indicating its role as a positive regulator of enhanced adipocyte differentiation through modulation of the sirtuin 1 and Kruppel-like factor 7 (KLF7) cascade (8). KLF7 inhibits the expression of adipogenic transcription factors, such as C/EBPα and PPARγ, as well as adipocyte marker genes, including the AP2 gene (25).
Conversely, resistance exercise training has been shown to acutely reduce miR-146a expression in healthy individuals (26). One target of miR-146a is TRAF6, a member of the tumor necrosis factor receptor-associated factor protein family that mediates signal transduction from tumor necrosis factor receptors. In addition, the protein encoded by TRAF6 serves as a signal transducer and is involved in the pathway that activates IκB kinase in response to proinflammatory cytokines (27).
miRNA-223 is recognized for its role in modulating inflammatory responses, particularly in immune cells. In the central nervous system, miRNA-223 has been shown to protect neurons by reducing neuroinflammation and promoting neuronal survival. It is essential for maintaining the balance between inflammatory and repair mechanisms. Furthermore, miRNA-223 is involved in the sorting and secretion of exosomes from cells, particularly microglial cells. These exosomes can carry miRNA-223, along with other signaling molecules, to influence adjacent cells and modify the microenvironment (12).
Research also indicates that phenolic compounds, such as those found in thyme, influence the expression of microRNAs 223 and 146 (12). Therefore, exercise training combined with thyme supplementation may synergistically enhance the expression of these microRNAs and help reduce inflammation associated with obesity.
In the present study, CRP levels decreased in the resistance training group (23.3%), combined training group (27.2%), and combined training plus thyme group (43.6%) compared with baseline measurements. However, no significant differences were detected in the between-group analyses, likely because of the limited sample size. Consistent with previous research (5), these findings suggest that exercise training has an anti-inflammatory effect, particularly in individuals with obesity, and that incorporating thyme supplementation, which is recognized for its anti-inflammatory properties, may have potential additive effects in reducing inflammation. In addition, consistent with the present results, a previous review of the influence of physical activity on inflammatory cytokine mediators indicated that combined aerobic and resistance training may be beneficial for improving inflammatory conditions (4).
Participants in all 3 groups showed statistically significant decreases in weight, BMI, and body fat percentage, along with improvements in all physical fitness-related variables. Furthermore, these findings underscore the differing effects of exercise modalities on metabolic markers (28). The present results indicated that all 3 training approaches were effective in improving the lipid profile. However, the combined training plus thyme group showed a significant reduction in total cholesterol (-9.4%), whereas the combined training group effectively reduced low-density lipoprotein (-11.3%) and triglyceride levels (-1.5%), with significant differences compared with baseline values. These findings are consistent with numerous studies evaluating the efficacy of various exercise training regimens on lipid profiles (29). It is important to acknowledge that changes in lipid profiles may vary according to the duration and intensity of training and participants' dietary habits.
These results emphasize the importance of microRNAs as biomarkers for evaluating the effects of exercise interventions on metabolic health. By demonstrating how different training modalities affect miRNA levels, this study highlights the potential of using microRNAs as targets for future therapeutic strategies designed to improve metabolic outcomes in individuals with overweight or obesity. However, several limitations should be noted, including the relatively small sample size and the absence of a control group, which limit the ability to attribute changes exclusively to the exercise interventions and may restrict the generalizability of the results. In addition, the short intervention duration may not adequately reflect long-term adaptations. Future studies should include larger sample sizes and longer intervention periods to validate these findings and investigate the long-term effects of different exercise modalities on microRNA levels and metabolic health.