1. Background
Given the incidence of high morbidity and mortality rates in high-risk surgery patients, ensuring stable and sufficient cardiac output (CO) or cardiac index (CI) is crucial for patients’ survival (1-3). The National Institute for Health and Clinical Excellence (NICE) 2011 has recommended CO monitoring to ensure that perioperative goal-directed therapy optimization correlates with improved postoperative outcomes in moderate- to high-risk surgery patients (4, 5). Kidney transplant surgery requires monitoring because of comorbidities, graft staging, renal vessel anastomosis, and ischemia-reperfusion. Many Chronic Kidney Disease (CKD) patients suffer from decreasing cardiac reserve, and 9.7% of kidney transplant patients experience perioperative cardiovascular events (6). The CO or CI and arterial pressure are monitored and optimized to ensure hemodynamic stability and adequate renal perfusion pressure to prevent graft failure (7, 8). A study showed that achieving systolic arterial pressure ≥150 mm Hg along with higher CO at the time of reperfusion was associated with early stabilization of graft function (9).
Continuous pulmonary artery (PAC) thermodilution is a reference technique used in several method comparison studies over the past decade. However, because of its invasiveness, PAC is associated with severe risk, and whether the benefits outweigh the possible adverse effects is still debatable (10). A semi-invasive hemodynamic monitoring device, the Uncalibrated Pulse Contour (UPC) analysis method, is routinely used in high-risk surgeries, such as transplant surgery (11-13). The selection of the appropriate hemodynamic monitoring for diagnostic and therapeutic guidance is important for reducing complications (1, 2). The ideal hemodynamic monitoring devices are minimally invasive or non-invasive, facilitate continuous monitoring, deliver real-time and reliable results under different physiological conditions, and have rapid response that enables the rapid detection of hemodynamic changes. In addition, such hemodynamic monitoring devices are inexpensive, cost-effective, easy to use, reliable, and user-independent. Additional advantages of non-invasive methods include safety, ease of installation and use, and the facilitation of mobilization (11-14).
Thoracic electrical bioimpedance cardiometry, which is based on a modified thoracic bioimpedance algorithm, is a recent non-invasive technique for CO monitoring. The algorithm assumes that the thoracic cavity is a blood-filled cylinder model that creates the impedance between the blood parallel to the thoracic wall tissue according to Ohm’s law, which is defined as follows: resistance equals voltage divided by current (resistance = voltage/current). The impedance related to the blood changes, in conjunction with the heart rate, represents cardiac activity. The position of the erythrocytes was transformed from a random to a parallel alignment to the blood flow axis at 60 milliseconds after the opening of the aortic valve during the systolic time. This resulted in increased conductivity, which facilitated the estimation of the acceleration of the blood flow through the aorta (15, 16). Osypka and Bernstein modified the equation. They determined that the maximum rate of impedance change was correlated with the accelerated peak aortic blood flow. This, then, contributes to the increased conductivity that results from the alignment changes in red blood cells. These techniques that determine blood flow velocity are known as electrical bioimpedance cardiometry (10, 17).
Electrical bioimpedance cardiometry has yielded good results in healthy volunteers; however, the precision and accuracy vary in other patient populations (15, 16). The reliability in critically ill patients and perioperative situations has not been established and is inconclusive. Most studies were performed in neonates and pediatric populations or during the post-cardiac surgery period. Huang et al. found that skin incision during surgery affected bioimpedance cardiometry measurements (18). Therefore, further studies in adult patients undergoing high-risk surgery including transplantation are warranted to determine the validity and reliability of bioimpedance cardiometry.
2. Objectives
Our present study specifically compares the accuracy and trending ability of CI as measured by bioimpedance cardiometry to those measured by the UPC analysis method as a reference technique in kidney transplant surgery. The primary outcome was the accuracy of CI measurements, as assessed by the bias, limits of agreement (LoA), and percentage of error (PE) between the two methods. The secondary outcome was the trending ability of CI, which was assessed by the angular bias and polar concordance.
3. Methods
3.1. Study Design
This prospective observational study was conducted in the operating room at a university teaching hospital. After registration in ClinicalTrials.gov (NCT03893513) and approval by the ethics committee, 50 patients scheduled for kidney transplantation between March 2019 and June 2019 were enrolled in the study. Written informed consent was obtained from each patient. The inclusion criteria were an age of 18 - 80 years and a body mass index (BMI) of 18.5 - 35 kg/m2. The exclusion criteria were morbid obesity and cardiac abnormality (second or third-degree heart block, pacemaker use, severe heart valve disorders, arrhythmia, bradycardia (< 50 bpm), and tachycardia (> 110 bpm). Patients who experienced intraoperative massive bleeding that caused hemodynamic instability requiring transfusions and norepinephrine > 0.3 mcg/kg/min to maintain MAP > 65 mmHg were also excluded.
The sample size calculation was based on the correlation power of 0.7 and correlation power difference of 0.2. With a type I error rate of 0.05, type II error rate of 0.2 (Zα = 1.960, Zβ = 0.842), minimum sensitivity of 75%, and precision of 0.15, a sample of 45 patients was required to correlate the outcomes of the two methods with the Bland-Altman analysis. To allow for the possibility of dropouts, 50 patients were enrolled in the study.
3.2. Study Measurements
Bioimpedance cardiometry was compared with UPC analysis as the reference technique. An electrocardiogram (ECG), non-invasive blood pressure, pulse oximetry, and Bispectral Index (BIS) monitoring were applied to each patient. General anesthesia was induced intravenously with 3 mcg/kg fentanyl, 1 - 1.5 mg/kg propofol, and 0.5 mg/kg atracurium. Anesthesia was maintained with 1.5 - 2 vol% sevoflurane inspired in oxygen. Pressure-controlled ventilation was used during surgery. A jugular or subclavian central venous catheter (CVC) was inserted into the superior vena cava of each patient. A radial artery catheter was inserted and connected to the EV1000TM and FloTrac sensor (Edward Lifesciences Corp., Irvine, CA, USA) for UPC analysis. The direction of the CVC was confirmed with ultrasound guidance. For the bioimpedance cardiometry, the ICONTM electrical monitor (Osypka Medical Inc., La Jolla, CA, USA) was installed for each patient. The monitor was connected with two electrodes that were placed on the carotid artery area of the left neck and two other electrodes that were placed on the left mid-axillary line of the chest.
This study measured the CI by indexing the estimated cardiac output to the body surface area (BSA). The measurements from the UPC and bioimpedance cardiometry monitors were recorded every 15 minutes for a total of 13 - 15 measurements depending on the duration of surgery. These measurements were grouped into three time points: (1) one measurement after anesthesia induction and every 15 minutes thereafter for a total of seven measurements (post-induction); (2) only one measurement at 15 minutes after the first incision because of cautery interference (first post-incision); and (3) one measurement after the release of the renal vascular clamps and every 15 minutes thereafter for a total of five to seven measurements (reperfusion). The measurements comprised the means of duplicate readings at 20-second intervals to compensate for the fluctuations in each variable calculation. The ICONTM device provided measurements in a variable time period (approximately 10 - 60 seconds). In contrast, the EV1000TM device provided the values every 20 seconds. All of the measurements and recordings were performed by the same independent research assistant. The primary investigator was blinded to data collection and analysis during the study.
3.3. Statistical Analysis
The baseline characteristics and intraoperative measurements were analyzed by IBM SPSS Statistics for Windows, version 20.0 (IBM Corp., Armonk, NY, USA). The normality of the difference between the means of the two measurements was determined through the Kolmogorov–Smirnov and Shapiro–Wilk tests. The data are presented as the mean ± standard deviation (SD) or the median with the interquartile range, as appropriate. The Pearson correlation coefficient was used for normally distributed data, and Spearman’s rank correlation coefficient was used for non-normally distributed data.
We used Bland-Altman analysis (MedCalc version 17.2 Statistical Software bvba, Ostend, Belgium) to determine the accuracy of the CI measurements by calculating the bias, LoA, and PE for repeated measurements. The linear regression analysis for correlation coefficients was used to analyze the suitability between the two measurements methods. The results of Bland-Altman analysis are shown in a graph that indicates the bias. This was calculated as the mean difference between the values obtained from the two measurement methods; the mean and SD were then derived. The LoA with a 95% confidence interval was calculated as the mean of the values from the two methods ± 1.96 SDs. A bias estimate of close to zero and a narrow CI indicates a highly precise and accurate agreement between both measurements. Conformity was determined from the comparison of the observed LoA (the value resulting from the Bland-Altman test) with the expected LoA. The results are presented in a table with the observed LoA values. The variations in the values from the two measurement methods, the differences in the observed LoA, and the expected LoA areas are shown on a graph. The percentage of measurement error (PE) was calculated as 100 × 1.96 × the SD of the difference; then, it was divided by the mean of the measurement values from the two methods at a specific time point. The PE was expected < 30% to facilitate the interchangeability of the two measurement methods (19).
The trending abilities of the two methods were analyzed with the four-quadrant and polar plot methodology. In the polar plot analysis, the central zone data (< 10% change) were excluded to reduce statistical noise. We used the average ∆CI value, calculated by [∆CI (reference) + ∆CI (test)]/2 for the radius. The angular bias was defined as the mean polar angle to the 0° line. The radial LoA referred to the radial sector that contained 95% of the data points. Polar concordance represented the percentage of data points that were located within ±30°. For good trending ability, the data points should be located mostly within this 30° area. The trending abilities of the two measurement methods were considered to be interchangeable if the angular bias was between -5° and +5°, with a radial LoA between -30° and +30° (20, 21).
4. Results
4.1. Research Subject Characteristics
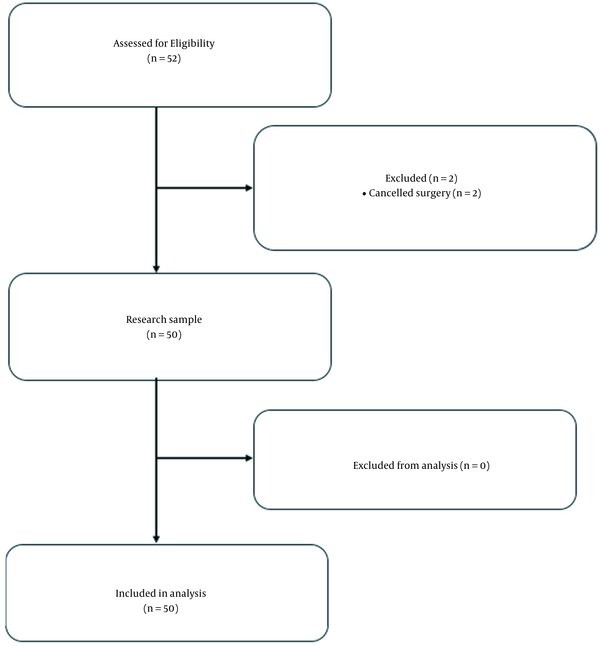
The subject recruitment overview is presented in Figure 1. The study initially comprised 52 patients (33 men and 17 women aged 20 - 73 years) who underwent kidney transplant surgery. Two individuals were excluded because of surgery cancellation. The subjects’ baseline characteristics are presented in Table 1. An overview of the hemodynamic variables, the intraoperative vasoactive requirements, and fluid therapy is presented in Table 2. The BMI of the subjects was < 30. The subjects were assessed with the American Society of Anesthesiology (ASA) 3 physical status of 94.3% and ASA 4 of 5.7% with the same disease history, i.e. chronic renal failure and accompanying hypertension. None of the subjects was excluded for intraoperative bleeding or hemodynamic instability that required high doses of vasoactive agents.
| Characteristics | Total Subjects (N = 50) |
|---|---|
| Duration of surgery (minutes) | 318.14 ± 46.13 |
| Duration of anesthesia (minutes) | 405.29 ± 45.67 |
| Bleeding (mL) | 100 (75 - 150) |
| Urine production (mL) | 400 (200 - 500) |
| Volume of intraoperative fluid (mL) | |
| Crystalloid | 500 (400 - 1000) |
| Colloid | 0 (0) |
| Vasopressor use (mcg/kg/min) | |
| Norepinephrine | 0.1 (0.05 - 0.2) |
| Inotropic use (mcg/kg/min) | |
| Dobutamine | 1 (0.01 - 5) |
| Postoperative complications (%) | |
| Agitation | 11.4 |
| Nausea/vomiting | 0 |
Intraoperative Measurements
4.2. Cardiac Index Measurements
The CIs derived from the bioimpedance cardiometry and UPC analyses were significantly different at every time point (Table 3). The results of the correlation coefficient are presented in Table 4 that shows the weak correlations in the CIs obtained by the bioimpedance and UPC analysis at the post-induction (r = 0.267), first post-incision (r = 0.327), and reperfusion (r = 0.321) times and with the pooled data (r = 0.348).
| Measurement Time | Cardiac Index (CI; L.min-1.m-2) | CI 95% | P Value c | ||
|---|---|---|---|---|---|
| EV1000TM | ICONTM | Lower | Upper | ||
| Post-induction | 3.88 ± 1.12; 3.6 (1.4 - 7.4) | 2.25 ± 0.79; 2.1 (1.2 - 5.1) | 1.05 | 1.32 | 0.000 |
| First post-incision | 3.65 ± 1.29; 3.4 (1.6 - 8.0) | 2.59 ± 0.69; 2.6 (1.5 - 4.8) | 0.71 | 1.42 | 0.000 |
| Reperfusion | 4.37 ± 0.85; 4.4 (2.6 - 6.7) | 2.59 ± 0.71; 2.4 (1.4 - 4.3) | 1.34 | 1.61 | 0.000 |
| Pooled Data | 3.97 ± 1.31; 3.9 (1.2 - 11.2) | 2.67 ± 0.74; 2.6 (1.2 - 5.7) | -1.40 | -1.21 | 0.000 |
| Measurement Time | n | R a | P Value |
|---|---|---|---|
| Post-induction | 350 | 0.267 | 0.000 |
| First post-incision | 50 | 0.327 | 0.020 |
| Reperfusion | 306 | 0.321 | 0.000 |
| Pooled data | 706 | 0.348 | 0.000 |
Correlation Between Cardiac Index Determined by Bioimpedance Cardiometry (ICONTM) and Uncalibrated Pulse Contour Analysis (EV1000TM)
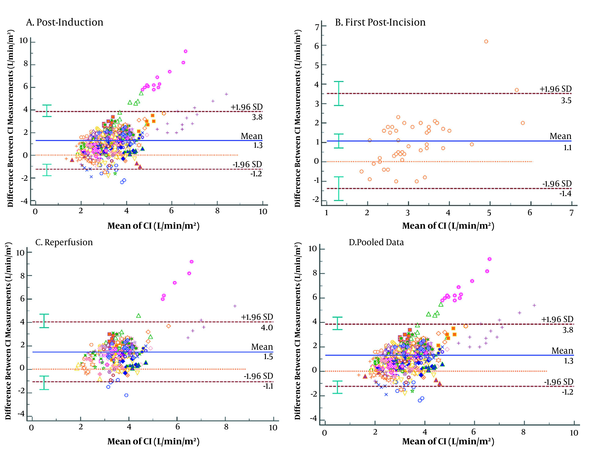
The bias in the CIs from the bioimpedance and UPC analyses at each time point and the pooled data were 1.18, 1.06, 1.48, and 1.30 L/min/m2, respectively, with LoA of -1.35 to 3.72, -1.39 to 3.51, -1.07 to 4.04, and -1.17 to 3.78 L/min/m2, respectively. However, a visual assessment of the Bland-Altman plots (Figure 2) showed the possible existence of some agreement at CIs of approximately 2.0 and 4.5 L/min/m2. At higher CI, the spread resulting from the differences in the two measurement methods increased (Figures 2A - D). The PE between the CI yielded by the bioimpedance and UPC analyses at the time points and from the pooled data were 82.21, 78.50, 68.74, and 74.58%, respectively, which were > 30% of the agreement limit at every time point (Table 5).
| Variables | EV1 vs ICON1 | EV2 vs ICON2 | EV3 vs ICON3 | Pooled Data |
|---|---|---|---|---|
| Bland-Altman plot | ||||
| Bias (L/min/m2) | 1.18 | 1.06 | 1.48 | 1.30 |
| SD (L/min/m2) | 1.29 | 1.25 | 1.22 | 1.26 |
| LoA (L/min/m2) | -1.35 to 3.72 | -1.39 to 3.51 | -1.07 to 4.04 | -1.17 to 3.78 |
| Percentage error (%) | 82.21 | 78.50 | 68.74 | 74.58 |
| Linear regression analysis | ||||
| Coefficient of determination (R2) | 0.0711 | 0.107 | 0.1028 | 0.0034 |
| Polar plot | ||||
| Angular bias (degrees) | -10.37 | -15.01 | -18.68 | -12.62 |
| Radial LoA (degrees) | 89.79 | 85.86 | 83.38 | 87.82 |
| Polar concordance rate at ± 30° (%) | 38.68 | 40.82 | 32.79 | 39.43 |
| Four-quadrant plot | ||||
| Concordance rate (%) | 70.77 | 67.35 | 65.90 | 69.79 |
Comparison of Absolute Values and Trends Identified by Bioimpedance Cardiometry and Uncalibrated Pulse Contour Analyses
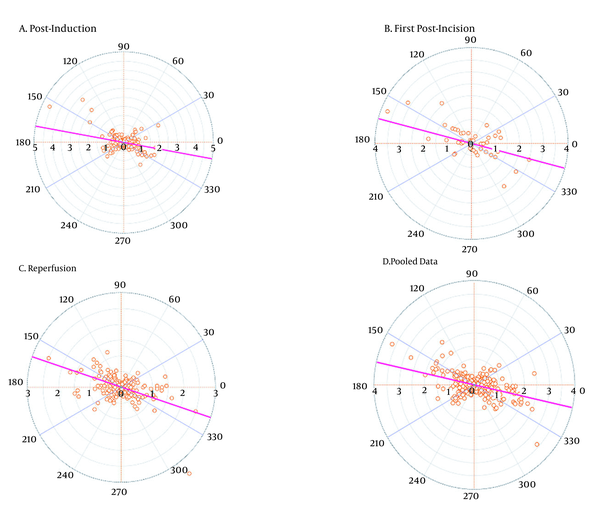
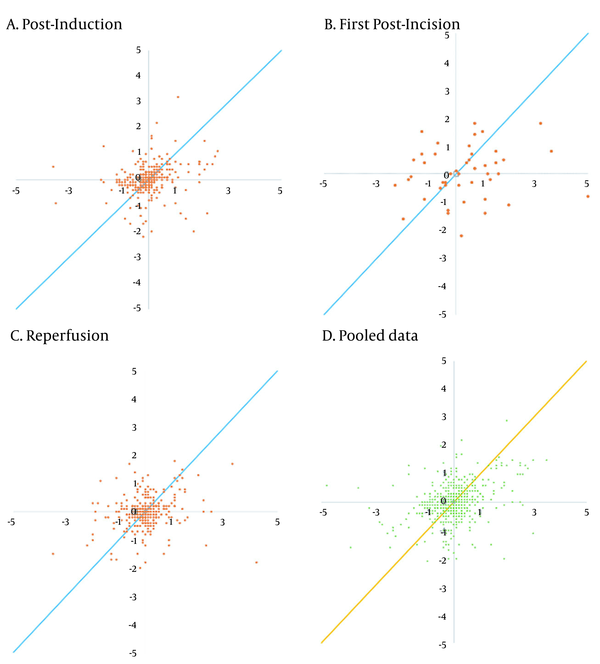
The trending abilities obtained by the bioimpedance and UPC analyses at the post-induction time were assessed through 349 pairs of changes in the CI polar plots with 135 data pairs outside the 10% exclusion zone. The angular bias was -10.37° with a radial LoA of -100.16° to 79.41° and the polar concordance within 30° was 38.68%. At the post-incision time, the assessment was performed through 49 pairs of changes in the CI polar plots with 20 data pairs outside the 10% exclusion zone. The angular bias was -15.01° with a radial LoA of -100.86° to 70.85° and the polar concordance within 30° was 40.82%. At the reperfusion time, the assessment was performed through 305 pairs of changes in the CI polar plots with 100 data pairs outside the 10% exclusion zone. The angular bias was -18.68° with a radial LoA of -102.06° to 64.70° and the polar concordance within 30° was 32.79%. For the pooled data, the assessment was performed based on 705 pairs of changes in the CI polar plots with 278 data pairs outside the 10% exclusion zone. The angular bias was -12.62° with a radial LoA of -100.44° to 75.20° and the polar concordance within 30° was 39.43% (Table 5 and Figure 3). The four-quadrant plot analysis data pairs outside the 15% exclusion zone yielded concordance rates of 70.77, 67.35, 65.90, and 69.79% at the post-induction, first post-incision, reperfusion times, and for the pooled data, respectively (Table 5 and Figure 4).
5. Discussion
Intraoperative low cardiac output and hypotension disrupt perfusion to the kidney that potentially causes graft failure, as well as maintaining perfusion within normal autoregulation, decrease the risk of organ complications in high-risk cardiac and non-cardiac surgical patients (22, 23). In perioperative and intensive care medicine, static parameters such as central venous pressure (CVP) or mean arterial blood pressure (MAP) have limitations as hemodynamic monitoring in high-risk surgical patients (24). Less invasive hemodynamic monitoring technologies rather than those that use pulmonary artery catheter (PAC) have been developed for intermittent and continuous cardiac output measurements such as UPCs. Some studies and reviews have found a good agreement and strong correlation between pulse contour analysis and transpulmonary thermodilution (PAC); thus, these methods were considered suitable for taking measurements. Another study also achieved good accuracy in using the pulse contour system to determine stroke volume variation for objective-guided fluid therapy (25, 26). However, several studies found that the pulse contour analysis and bioimpedance cardiometry are incompatible compared to thermodilution based on the high bias and the width of the observed LoA (11, 27).
Kidney transplantation is a high-risk surgery that requires hemodynamic monitoring to support goal-directed therapy, but transpulmonary thermodilution is not commonly used in kidney transplant surgery because of the risks posed by PAC insertion. Non-invasive approaches such as the bioimpedance method or near-infrared spectroscopy (NIRS) were proposed for global hemodynamic to regional kidney saturation monitoring to predict perioperative AKI (28). Bioimpedance cardiometry is a promising non-invasive technique for intraoperative hemodynamic monitoring (11, 29).
The BMI > 35 could influence the reliability of the measurements taken through bioimpedance cardiometry (29). Our study subjects had a mean BMI of 23.63 kg/m2 and a mean body surface area of 1.68 m2; therefore, BMI did not affect the measurement of bioimpedance. The Bland-Altman analysis showed a poor agreement between the two measurements methods that indicated the bioimpedance cardiometry (ICONTM) method could not substitute UPC analysis (EV1000TM) method for measuring a variable during kidney transplant surgery. The assumption was based on a PE of > 30% at all measurement times and this value was considered to be clinically unacceptable. However, the visual interpretation of the Bland-Altman plots revealed an agreement and concentration at CI 2.0 - 4.5 L/min/m2 in the pooled data.
The reliability of a method or technique should be confirmed before implementation. Patients undergoing kidney transplant surgery experience sympathetic hemodynamic fluctuations because of anesthesia induction, surgical incision, and ischemia-reperfusion injury. Therefore, the continuous CI measurement trending ability investigation is important for determining the accuracy of individual measurements at a specific time point (30). The polar plot and four-quadrant plot analyses were performed to evaluate the trending abilities of both measurement techniques during surgery. The results showed the angular bias was more than ± 5°, the LoA was more than ± 30°, and the concordance was less than 85%, verifying the poor trending abilities and the non-interchangeability of the two techniques based on the polar plot and four-quadrant plot analyses. The pre-incision, peri-incision, and post-incision conditions did not affect the measurements obtained by the two methods. However, the present study was not designed to have the power for detecting the different effects between those specific conditions.
The Bland-Altman analysis results regarding non-conformity between the two instruments assessed in this study could have been influenced by several factors. Unavoidable intraoperative factors, such as the use of electrical cautery, electrode attachments, and mechanical ventilation that limit bioimpedance cardiometry analysis could have affected impedance conductance. The calculation of stroke volume by bioimpedance cardiometry is still based largely on assumptions and influenced mainly by patient comorbidities, electrical conduction factors (hemoglobin and chest surface thickness), and right ventricular ejection time. Comorbidities such as impaired cardiac function, pulmonary edema, pleural effusion, and decreased myocardial contractility are associated with hemodynamic fluctuations. In addition, bioimpedance cardiometry requires longer measurement times (16, 31, 32). With the EV1000, the accuracy of UPC analysis could be limited to a calculation formula that is influenced by arterial wave and blood vessel factors in the patients. The patient variations in the elasticity and resistance of blood vessels could influence the calculated parameters; therefore, the differences in the measurement results across devices are unavoidable (19, 31).
5.1. Study Limitations
Our study had limitations. The reference measuring tool was not the thermodilution using the PAC as the gold standard for cardiac output measurement, but PAC has risks associated with the invasiveness and unproven outcome benefit (33). Therefore, less or non-invasive methods have been increasingly used such as UPC analysis that enabled the accurate measurements of the continuous CI in a previous study (34). The other limitation of our study was the determination of the LoA based on the researchers’ assumptions.
5.2. Conclusion
The results of the Bland-Altman analysis indicated the poorer agreement in the CI estimated by bioimpedance cardiometry than measured by UPC analysis. Furthermore, the concordance and trending abilities were weak. Regarding the use in clinical practice during kidney transplant surgery, CI measurement using the bioimpedance cardiometry monitoring should be interpreted cautiously because it showed poor reliability due to low accuracy, precision, and trending ability under our study investigation. Further study is warranted to identify the populations for whom intraoperative transthoracic bioimpedance cardiometry monitoring would be most beneficial. Comparisons could then be made with transpulmonary thermodilution and another non-invasive method, such as esophageal doppler monitoring or transesophageal echocardiography.


