1. Background
Pain scales are useful for the assessment of pain and also for monitoring the effectiveness of treatment (1). It is therefore important that pain scales are simple and efficient. The numeric rating scale (NRS) is a commonly used scale for this purpose because of its easy application. Acute pain in the post-operative period should ideally be assessed simultaneously at rest (important for comfort) and during movement (important for functioning and post-operative complications), but this is often not done for want of time (2, 3). Pain is a subjective feeling, and the self-assessment of pain by the patient and evaluation by the observer can be influenced by a variety of factors, including but not limited to socio-economic status, beliefs, and psychological status (4, 5). Pain scoring tools that can eliminate the subjective component from the assessment of pain need to be explored because the excessive use of opioids as well as under treatment of pain can have adverse effects on enhanced post-surgical recovery.
We therefore proposed a 4-point objective pain score (OPS) to objectively assess the need for analgesia in abdominal surgery patients and also to track the effectiveness of the analgesic measures.
2. Objectives
To study the correlation between the proposed OPS and the NRS for assessing pain in post-operative abdominal surgery patients and validate the OPS.
3. Patients and Methods
3.1. Inclusion Criteria
The study was approved by the ethical committee of the institute of the institute of liver and biliary sciences (IEC/IRB No.26/M-2 dated 27/02/2014). The study conforms to the Helinski declaration. After obtaining written, informed consent for the use of a patient-controlled analgesia (PCA) device and for inclusion in the study, patients scheduled for elective abdominal surgeries were included. These patients were scheduled to receive PCA through either an epidural or intravenous route after surgery. To ensure optimum patient use of the PCA pump, PCA by either route was initiated three hours after extubation, when patients were wide awake and were assessed to be capable of using the PCA pump to self-administer the analgesic.
3.2. Exclusion Criteria
Patients requiring postoperative mechanical ventilation, patients with hemodynamic instability requiring inotrope and/or vasopressor, patients less than 18 years old, patients unable to use a PCA pump, and patients who refused to use PCA were excluded from the study.
3.3. Study Protocol
The attending anesthesiologist provided anesthesia as clinically indicated. The study protocol had no influence on the anesthesia technique or on the intraoperative analgesic regimen. According to our in-house standard, patients received paracetamol 1 g intravenously (i.v.) before emergence from anesthesia.
PCA was standardized according to the protocol at the institute. Intravenous PCA (IVPCA) contained 10 mcg/mL of fentanyl. The total dose delivered every hour was limited to 2 mcg/kg. The total calculated dose was divided into 5 equal parts and delivered upon activation of the PCA device with a lockout time of 10 minutes. The total dose activation allowed in IVPCA was 5 per hour. There was no background infusion for IVPCA. Epidural PCA (PCEA) contained 0.1% bupivacaine. For PCEA, the total dose was calculated as 1.5 mL/dermatome that had to be covered. The total calculated dose was divided into 2 equal parts with a lockout of 10 minutes. A background infusion equal to one calculated dose was given in PCEA. The total dose activation allowed per hour was 2. Pain was assessed simultaneously using the printed NRS (Figure 1), which the patient used to score his pain, and the OPS (Table 1), which was used by the APS resident to score the pain. In cases of postoperative nausea and vomiting (PONV), patients received standard treatment with i.v. ondansetron 4 mg. Rescue analgesia for breakthrough pain was divided into Level 1 (analgesia was supplemented with an injection of paracetamol 1 g for NRS 2 - 5 and OPS 3) and Level 2 (analgesia was supplemented with an injection of Fentanyl 25 mcg for NRS ≥ 6 and OPS 1 and 2). When there was any disagreement between the two scores, the consultant in charge of the acute pain service (APS) and not involved in the study was consulted to determine the need for analgesic supplementation. Analgesic measures were targeted to achieve NRS ≤ 3 and or OPS ≥ 3.
| Score | Responseb | |
|---|---|---|
| Inadequate pain relief/pain at rest | 1 | Inadequate analgesia, inform anesthesia resident on duty; implement level 2 rescue analgesia |
| Pain free at rest/normal breathing | 2 | Inadequate analgesia, implement Level 2 rescue analgesia |
| Pain free when deep breathing/incentive spirometry, but pain when coughing | 3 | Adequate analgesia, implement level 1 rescue analgesia |
| Pain free, even when coughing | 4 | Adequate analgesia, no intervention needed |
aCircle the appropriate response: Rescue Analgesia.
bLevel 1-paracetamol 1 g; Level 2-fentanyl 25 mcg.
Abdominal surgery patients included in the study were prospectively followed for 72 hours while they availed PCA services. Pain assessment was carried out every 6 hours by anesthesia registrars assigned to APS. Pain assessment was carried out using the NRS and OPS simultaneously. While patients rated their pain using a printed NRS, the anesthesia registrar rated pain using the OPS.
3.4. Statistical Analysis
Data received in the form of the NRS and OPS scores were checked for suitability for the application of linear regression. Data were checked for normalcy of distribution using the Shapiro-Wilk test. Spearman correlation was derived. P Values of less than 0.05 were considered statistically significant.
4. Results
A total of 1021 paired recordings of the NRS and OPS of 93 patients who underwent abdominal surgeries and received PCA were analyzed.
The mean NRS was 2.34 ± 1.36, while the median and mode values NRS were 2. The mean value of the OPS was 2.88 ± 0.76 with a median and mode of 3 (Table 2).
| Mean± SD | Median | Mode | Change in Analgesia Supplementation on the Basis of the Score | |
|---|---|---|---|---|
| NRS | 2.25 ± 1.31 | 2 | 2 | 0 |
| OPS | 2.98 ± 0.76 | 3 | 3 | 25a |
Abbreviations: SD, standard deviation; NRS, numeric rating scale; OPS, objective pain score.
aP = 0.00.
A linear regression model was applied to derive the relation (R) between the NRS and OPS. The R Value was 0.578, and the R2 was 0.33. (P < 0.05) The regression equation derived was OPS = 3.735 - 0.334 × NRS (for every one unit change in the NRS, the OPS decreases by 0.334). When NRS is zero, the OPS is thus predicted to be 4 (Table 3).
| R | R Square | Adjusted R Square | Std. Error of Estimate | P Valuea |
|---|---|---|---|---|
| .578 | .334 | .334 | .618 | .000 |
aStatistically significant (P < 0.05); R Pearson correlation.
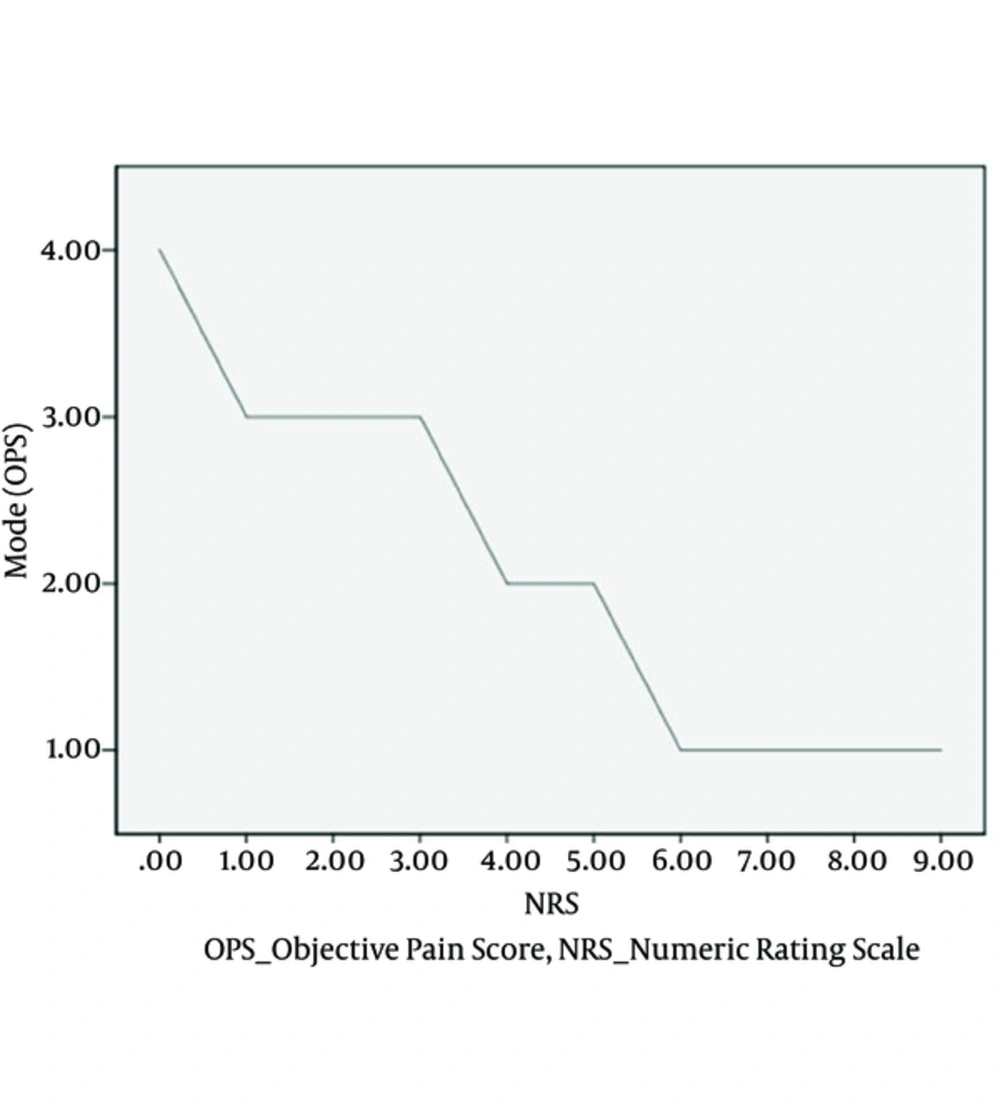
The mode, minimum, and the maximum of corresponding OPS values were plotted against the respective NRS scores on linear graphs. On plotting the most common corresponding values (mode) of the OPS against the observed NRS values (Figure 2), for an NRS of 0, the most common OPS was 4, and for an NRS > 6, the most common OPS was 1. For an NRS of 1 to 3, the most common OPS value was 3.
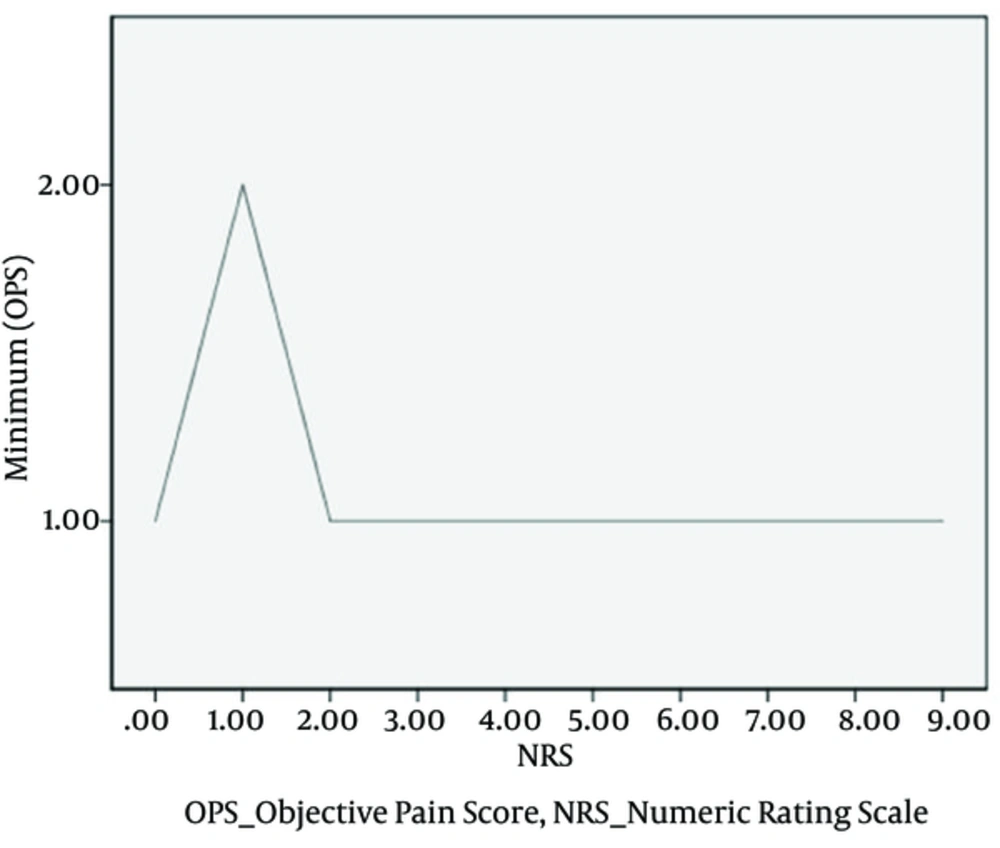
Minimum corresponding OPS values plotted against NRS values revealed instances of disagreement where OPS values of 1 and 2 were present for an NRS ≤ 5 (Figure 3).
On 25 occasions out of 1021, the two scores contradicted, and the decision to administer supplemental analgesic was changed based on the OPS. Out of these 25, on 24 occasions the NRS was suggestive of the need for Level 1 supplemental analgesia, while the OPS was suggestive of Level 2. On 1 occasion, the NRS was suggestive of Level 2 analgesia supplementation, while the OPS suggested adequate analgesia and supplemental analgesia was changed from Level 2 to 1, in favor of the assessment based on the OPS (Table 4).
| Number of said disagreements | OPS | NRS |
|---|---|---|
| 7 | 1 or 2 | 1 |
| 17 | 1 or 2 | 2 |
| 1 | 3 | 6 |
| 17 a | 3 | 5 |
Abbreviations: NRS, numeric rating scale; OPS, objective pain score.
aPotential disagreement due to possible observer bias.
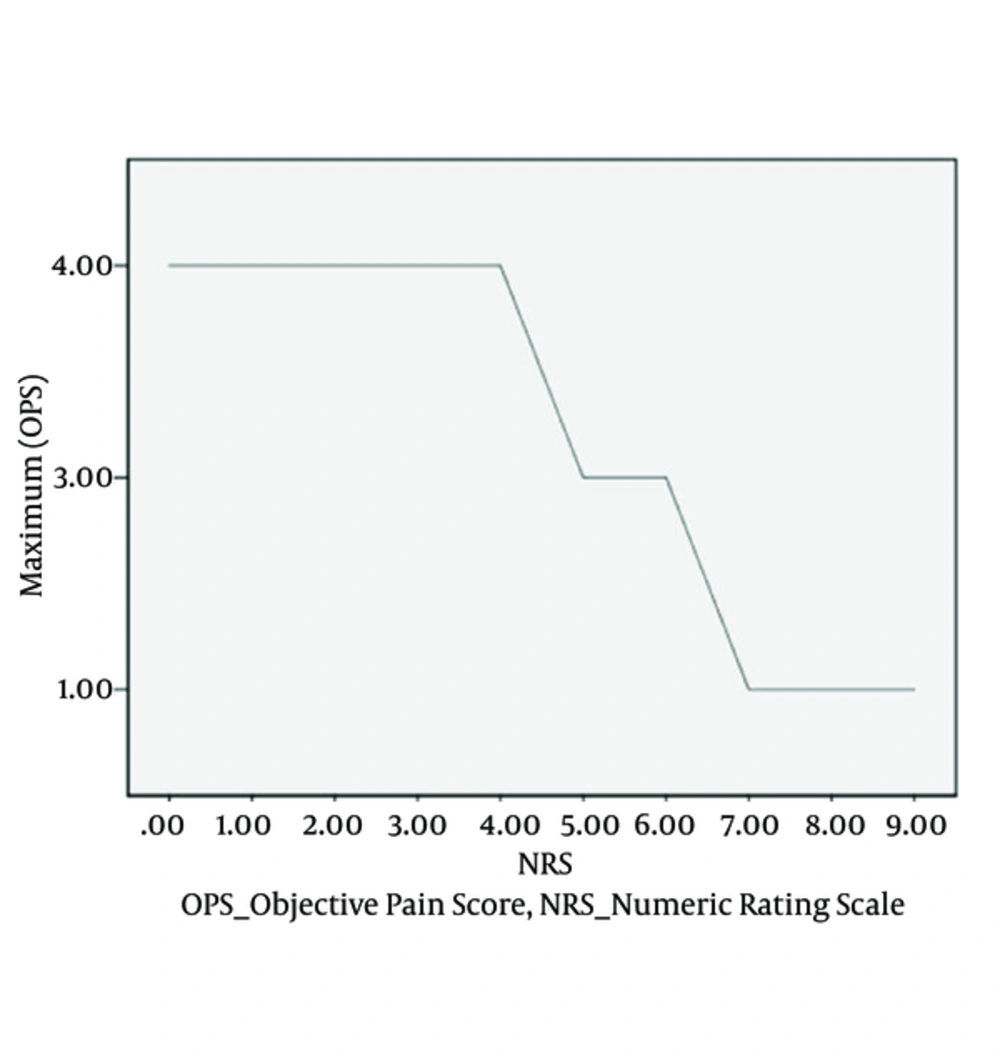
In the plot depicting the maximum corresponding OPS values against the observed NRS score, (Figure 4) for an NRS of 0 to 4, the OPS was 4, and for an NRS of 7 or higher, the OPS was 1.
There were 17 occasions of possible misinterpretation of the NRS score when the NRS was 5. Due to the potential for observer bias, an NRS of 5 could have been interpreted in favor of either level 1 or level 2 rescue analgesia (Table 4).
There were 7 incidences out of 1021 when patients complained of nausea and vomiting and received anti-emetic therapy.
5. Discussion
This study validated the efficacy of the proposed OPS against the widely used NRS in patients undergoing elective planned abdominal surgery and presented the OPS as an effective tool for objectively demonstrating the need for analgesia in patients with mild-to-moderate pain.
The analgesia provided by APS using PCA pumps was effective, as reflected by the observed values for the mean, median, and mode of the pain scores (NRS and OPS).
The R Value was 0.578, which indicates a high degree of correlation. The R2 value was 0.33, which is indicative of the total variation in the OPS and explained by the independent variable NRS. The P value (< 0.05) shows that the regression model statistically significantly predicts the outcome variable, i.e. the OPS, and is a good fit for the data. The derived regression equation is OPS = 3.735 - 0.334 × NRS (for every one unit of change in the NRS, the OPS decreases by 0.334). When the NRS is zero, the OPS is thus predicted to be 4 (Table 3).
The NRS uses an 11-point pain scale for measuring pain intensity (0 = no pain and 10 = worst possible pain) (Figure 1). The NRS is easy and can even be conducted without the aid of any physical scale (2). However, it requires some abstract thinking by the patient, which may be difficult and confusing and only show the changes based on the increase or decrease in scores without defining the meaningfulness of the change in scores. Moreover, it may be difficult to interpret the clinical importance of these changes by a point or two from baseline. While using the NRS, the patient could possibly be worried about the score correctly communicating the need for analgesia. The OPS, on the other hand, assigns the task of rating the pain to the physician without leaving any possibility of observer bias. The same NRS scores in different patients and in the same patient at different points of time could mean different degrees of pain, while each OPS score signifies a similar degree of pain and the need for analgesia and therefore is good to use as a protocol for APS services (2, 6).
Children epitomize the limitation imposed by the pain scales, as their ability to understand, quantitate, and communicate is limited. Verghese ST and Hannallah RS (7) reported on their use of an objective pain scale at their hospital. Their score uses a combination of observations for the assessment of pain in children up to 3 years of age and also for nonverbal children. A score is assigned to each observation. The score for each observation is then added to arrive at a pain score for the child. Adults undergoing surgery are no different when it comes to quantitating and communicate their pain and the need for analgesia. This limitation is overcome by the proposed OPS.
The simultaneous assessment of pain at rest and during movement is desirable, but this may not always be done due to want of time. The OPS enables the simultaneous assessment of pain at rest and during movement without the need for a repeat evaluation, which is necessary in the NRS. The assessment of the efficacy of pain-relieving measures is also inherent to the proposed four-point OPS, such that if a patient who had pain on vital capacity breathing with an OPS of 2, upon subsequent assessment has an OPS of 3, this would mean that the analgesic measure instituted was effective.
The two scores, the NRS and the OPS, agree across the range of pain. (R = 0.578, R2 = 0.334; P < 0.05) Their agreement is evident from the graphs showing the most common and the highest OPS values for the observed NRS values (Figures 2 and 4). There is no ambiguity between the NRS and the OPS for severe pain, but there were instances of disagreement between the two scores when the NRS was ≤ 5 and was indicative of mild or moderate pain, but OPS scores of 1 or 2 were seen and were indicative of severe pain requiring Level 2 rescue analgesia (Figure 3).
There were 17 occasions when the NRS was 2 and the OPS was either 1 or 2, while on 7 occasions the NRS was 1 and the OPS was again either 1 or 2 (Table 4). On these 24 occasions, analgesia supplementation was increased from Level 1 to Level 2. On one occasion, the NRS was 6 while the OPS was 3, and analgesic supplementation was downgraded from Level 2 to Level 1 on the basis of the OPS. These discrepancies could possibly be attributed to patient-related factors and could have led to ineffective analgesia supplementation or the overuse of opioids (2).
The difference in the number of decisions favoring the OPS over the NPS for the level of analgesia supplementation (OPS = 25 vs. NRS = 0) was statistically significant. The 24 disagreements between the NRS and OPS where increased need for analgesia was suggested by OPS and not NRS, occurred in 8 out of 93 patients. One patient out of every 11 therefore could have been left in pain if only the NRS would have been used and had OPS not been referred to for analgesia intervention.
There were 17 other instances when the NRS was 5 with a potential for observer bias in favor of Level 2 analgesic supplementation, had analgesic intervention not been determined by protocol. On these 17 occasions, the corresponding OPS was always 3, thus leaving no potential for observer bias (Table 4). Unnecessary opioid medication could therefore be avoided.
The study has successfully highlighted the need for better interpretation of the mild and moderate pain scores on the NRS. The findings also suggest that the OPS is a good stand-alone tool to scale pain and to ascertain the need for analgesia and is a good tool to refer to when the NRS is indicative of mild or moderate pain.


