

1. Background
All disorders heterogeneously affecting the function and structure of the kidneys are referred to as chronic kidney disease (CKD). The physical symptoms of CKD such as reduced appetite and feeling unwell are not specific. The lack of symptoms in the early stages of the disease means that, without monitoring, CKD can easily go undetected, leading to progressive damage and loss of kidney function. This can result in the development of diseases that can be associated with complications such as cardiovascular diseases (CVD). Therefore, clinically, urine or blood tests are needed for determining specific biomarkers like creatinine, albuminuria, urea, or more specifically cystatin C (1-5). Also, that CKD is a common disease seen in 16.8% of the U.S. population aged ≥ 20 years, thus affecting the public, makes it very important to diagnose this disease in early stages (6).
As human health is being addressed in human medical research, the correct prediction of the results becomes more important. Thus, those methods should be used that have the least error and the highest certainty. Among the methods attracting the attention of many researchers are the chemometric methods and artificial neural networks. Chemometrics is the science of employing computer and mathematical methods to draw critical information from chemical systems by data-driven means (7). Pattern recognition is one of the main applications of chemometrics. Pattern recognition based on different chemometric methods has been applied in metabolomics (8), diagnosis (9), and classification (10).
Artificial neural networks (ANNs) are computer systems mimicking the human brain structure and behavior. They gather knowledge by recognizing the complex patterns of learning through experience (11) while adjusting ANN parameters by a process of minimizing errors. Any kind of input data like the gene expression profiles generated from cDNA microarrays can be employed to calibrate ANNs. The output is grouped based on the number of categories. Today, ANNs are employed in clinical practice including for the diagnosis of myocardial infarction (12) and arrhythmias based on electrocardiogram criteria (13) and the interpretation of radiographs and magnetic resonance images (14, 15). Multilayer perceptron (MLP) refers to a neural network with clearly defined architecture and a rather simple learning algorithm.
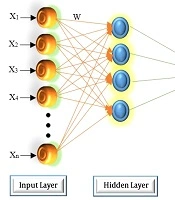
The set of source nodes in MLP consists of the input layer, the hidden layer(s), and the output layer. The system complexity is determined by the number of layers and the number of neurons in a layer, affecting the structure of the optimal network. The structure of a typical three-layer ANN is shown in Figure 1.
, and an output layer")
Multilayer perceptron neural network with an input layer, hidden layer(s), and an output layer
Limited studies conducted in recent years have shown that different methods can be used in the diagnosis of acute kidney disease. The method of ANNs in CKD diagnosis was first raised in the study by Neves et al. According to their results, ANNs had a sensitivity of 93.1% - 94.9% and a specificity of 91.9% - 94.2% in the diagnosis of CKD (16). By using ANNs, Di Noia et al. developed a software program to classify end-stage kidney disease and showed that the instrument had a 91.37% accuracy, 70.76% sensitivity, and 70.76% positive predictive power (17). Polat et al. used the support vector machine classification algorithm for CKD diagnosis. Their results showed higher accuracy (98.5%) of the best-first search algorithm than those of other available methods for CKD diagnosis (18). A problem in the diagnosis of CKD is the limited number of studies conducted in recent years. Conducting further studies and increasing the accuracy of diagnosis can be an effective step in the early diagnosis of the disease.
2. Objectives
This study aimed at the early diagnosis of CKD by increasing the accuracy of diagnosis using the MLP method to reduce the length of treatment and decrease the high cost of the disease.
3. Methods
In this study, we attempted to diagnose CKD with simple parameters through chemometric methods using MLP. The neural network used in this study was a parameterized computational non-linear algorithm for CKD data processing. The system architecture is shown in Figure 2.

The system architecture
3.1. Sample Collection and Preparation
We used the dataset of CKD from the Central Laboratory of Islam Abad-e-Qarb city, Kermanshah, Iran. The dataset included blood and urine samples collected from 50 healthy people and 90 patients. Informed consent was obtained from all subjects before enrolment in the study. Samples were kept at -20°C until use. For each person, we gathered the data of the concentrations of glucose (GLU), urea, creatinine, sodium (Na), potassium (K), calcium (Ca), phosphorus (P), cholesterol (Chol), triglycerides (TG), alkaline phosphatase (Alk), alanine aminotransferase (ALT), and aspartate aminotransferase (AST) to use as inputs to the ANN. The input, hidden, and output layers of the neural network for the diagnosis of CKD are shown in Table 1.
| Layer | Structure | |
|---|---|---|
| Input layer | Factors | Glucose (GLU) |
| Urea (Urea) | ||
| Creatinine (Creat) | ||
| Sodium (Na) | ||
| Potassium (K) | ||
| Calcium (Ca) | ||
| Phosphorus (P) | ||
| Cholesterol (Chol) | ||
| Triglycerides (TG) | ||
| Alkaline phosphatase (Alk) | ||
| Alanine aminotransferase (ALT) | ||
| Aspartate aminotransferase (AST) | ||
| Hidden layer(s) | Number of hidden layers | 2 |
| Output layer | Dependent variables | Displacement |
| Units | 1 | |
| Rescaling the scale dependents | Standardized | |
| Activation function | Identity | |
| Error function | Sum of square | |
The Structure of Neural Network with Input, Hidden, and Output Layers for the Diagnosis of Chronic Kidney Disease
3.2. Data Cleaning and Pre-Processing
Before evaluation by the neural network, the training data were preprocessed. There are different approaches for this purpose. Since the logistic function is the most common transference function, the data were scaled normally to lie within the intervals [0, 1]. To reinforce the performance of network classification, cases with some missing data were excluded. The performance of classification is decreased if there is a database imbalance (different numbers of cases for each class) (19). Back-propagation is the most common training algorithm among others (20, 21). This algorithm is relied on two training parameters: learning rate and momentum. Learning is unstable and network generalization is poor if these parameters have higher values. The optimal values of the training parameters depend upon the complexity of the studied system. The momentum value is lower than the learning rate. The sum of the values should be approximately equal to unity.
3.3. Software
The ANNs in the current study were applied by classification toolbox 4.0 in MATLAB (MATLAB R2018a, The Mathworks Inc., Natick).
3.4. MLP-ANN Architecture
A multi-layer feed-forward neural network with four layers was utilized in the current study. To design the neural network architecture, the choice of activation is an important consideration based on the task and available data. Smooth linear activation function was applied to the input neuron while non-linear log sigmoid function was applied to hidden neurons. A constant bias was also added to the hidden and output layers (22). The designed network had one output neuron and it was formulated as a binary classification problem. Twelve inputs were chosen in the present study, which was appropriate for the prediction of CKD.
3.5. Training and Testing the ANN
The important phases of data processing, i.e., training and testing, were performed using the ANN technique. The back-propagation and gradient descent algorithms are the methods used to train or learn the designed neural networks to update the weights. Basic MATLAB was utilized for codification. The training method employed in the current study relies on the incremental mode of training (22). The data of 140 people including 90 CKD patients were utilized. The normalized inputs were fed into the network to train the ANN; for training the ANN the normalized inputs were fed into the network and the ANN was trained till the network reached sufficiently to small mean square error (MSE) error.
4. Results
In the current study, we designed and tested the ANN architecture with a hidden layer and different numbers of neurons. It had 12 input nodes and one output node and the problem was a binary classification. The output was either 0 or 1 where 0 indicated a healthy case and 1 stood for CKD. To train the network, the weights between hidden-output and input-hidden layers were randomly initialized with a small value ranging from 0 to 1. Figure 3 indicates the framework of ANN for the diagnosis of CKD. The input layer contained 12 neurons. In the hidden layers, there were 10 neurons. The output layer had only one neuron, representing CKD.

The framework of artificial neural network for the diagnosis of chronic kidney disease
5. Discussion
In Figure 4, the training data, validation data, and testing data are shown as blue, green, and red bars, respectively. The histogram can give you an indication of outliers, including data points which their fit is significantly worse than the majority of data. Likewise, when most errors fall from -0.1451 to 0.0998, the validation point errors are -0.1801 to 0.0998. The target is perfectly tracked by the output for validation, testing, and training, and the overall R-value is about 0.99. This means that the network has an accuracy of 99% for the CKD dataset. The training state values are shown in Figure 5. The best validation performance is 0.0084 at epoch 3.

Error histogram presentation of neural network

Neural network performance analysis with epoch variation
A multilayer feed-forward network was created with 12 feature inputs, 10 sigmoid hidden neurons, and one linear output neuron. By enough neurons and consistent data in the hidden layer, the created network could perfectly fit multi-dimensional mapping arbitrary problems (Figure 6). To train the network, the Levenberg-Marquardt back-propagation algorithm was utilized. The results indicated that the ANN methodology can distinguish well between normal and abnormal persons and can learn the pattern. The results of the network simulating in the testing set were also very satisfactory, classifying 97.7% of the cases in the testing set.

Neural network regression analysis
The ANN in the present study was measured by the calculation of absolute error between the desired target and the network response and after presenting the testing pattern to the network. The result was also validated by calculating the correlation coefficient R that was close to one, indicating the good performance of the network (23).
Relying on resolving optimization tasks, intelligent data processing is a modern approach to classify problems using ANNs. Our results suggest that ANNs may also be used to create effective, highly accurate models for CKD prediction. The 12 factors analyzed by MLP-ANN types yielded with 98% accuracy. Hence, the type of MLP-ANN and the number of variable factors can determine the diagnostic accuracy of the tool. The CKD diagnosis software can be designed based on our experiences on the NN models for CKD prediction.
Table 2 compares the performance of the proposed method in comparison with other methods in the literature using these datasets. The comparison indicates that our method has the highest diagnosis accuracy. The proposed method is relatively less complicated for CKD diagnosis. Moreover, the method is simple and can be employed in most libraries.
| Method | Classification Accuracy % | Ref. |
|---|---|---|
| Naïve Bayes | 89.04 | (24) |
| SVM | 87.98 | |
| SVM | 82.41 | (25) |
| SVM | 76.32 | (26) |
| ANN | 87.70 | |
| KNN | 78.75 | (27) |
| SVM | 73.75 | |
| IFSS | 80 | (28) |
| FuRES | 99.2 | (29) |
| SVM without feature selection | 97.75 | (18) |
| SVM with ClassifierSubsetEval and Greedy stepwise | 98 | |
| SVM with WrapperSubsetEval and Best-First | 98.25 | |
| SVM with CfsSubsetEval and Greedy stepwise | 98.25 | |
| SVM with FilterSubsetEval and Best-First | 98.50 | |
| MLP-ANN | 98 | This work |
The Accuracy of Diagnosis by Different Approaches Available in the Literature Compared to our Method
5.1. Conclusions
This study aimed to develop a simple model with reliable analytical properties to diagnose CKD using MLP ANNs. In this study, we used the dataset of CKD from the Central Laboratory of Islam Abad-e-Qarb city, Kermanshah, Iran. The dataset included blood and urine parameters collected from 50 healthy people and 90 CKD patients. The models including both genetic and non-genetic factors had the highest accuracy. Before evaluation by the neural network, pre-processing steps were performed with data normalization. Using MATLAB software, the neural network was coded with 12 feature inputs, 10 sigmoid hidden neurons, and one linear output neuron. Models with 98% accuracy can be used for the development of software programs for reducing the cost of diagnosis without using invasive procedures for CKD prediction and diagnosis.
