


1. Context
The first cause of living with a disability in individuals under 50 is migraine, which is the second cause of disability all over the world (1, 2). Globally, nearly 1.04 billion people suffer from migraines (3). One of the main issues regarding migraine is its chronicity and severity, affecting the quality of life and interfering with daily activities (4). Nearly 40% of migraineurs need preventive agents, while only 13% receive these medications (5). Beta-blockers, antiepileptic drugs, topiramate, calcium channel blockers, antidepressants, botulinum toxin, and calcitonin gene-related peptide (CGRPs) monoclonal antibodies are used as preventive agents (6). Up to one-third of patients are not responsive to prophylactic medications (7).
2. Objectives
In October 2010, the United States Food and Drug Administration (FDA) approved botulinum toxin type A (BT-A) for migraine prevention (8). Now, it is used in different populations for migraine prevention, while the rates of adverse effects (AEs) vary.
We designed this systematic review and meta-analysis to estimate the pooled safety of botulinum toxin injection in migraineurs.
3. Methods
3.1. Data Sources
The search terms were Migraine Disorder, Disorder AND Migraine, Headache AND Sick, Headache AND Migraine, Migraine, Migrainosus, Migraine Headache, Migraines, Sick Headaches, Botulinum, Toxins AND Botulinum, Botulinum AND Neurotoxins, Toxins AND Clostridium Botulinum Neurotoxins, Botulinum Toxin, Botulinum Neurotoxin, Clostridium Botulinum Toxins, and Botulin.
We searched PubMed, Scopus, EMBASE, Web of Science, Google Scholar databases, and gray literature, including references of the studies published before April 2023.
3.2. Study Selection
The inclusion criteria included trials reporting the efficacy of botulinum toxin in treating headache attacks in migraineurs. The exclusion criteria included letters to the editor, case-controls, case reports, and cross-sectional/cohort studies. We extracted data regarding the total number of participants, the first author, the year of publication, the country of origin, the mean age, and the AEs of botulinum toxin in migraineurs.
3.3. Risk of Bias Assessment
We evaluated the risk of bias in randomized trials using the Cochrane Collaboration’s tool (9).
3.4.. Data Extraction
All statistical analyses were performed using STATA (Version 14.0; Stata Corp LP, College Station, TX, USA). We used random effects to determine heterogeneity. Inconsistency (10) was also calculated.
4. Results
We found 3081 articles by literature search; after deleting duplicates, 1711 remained. Thirty-five articles remained for meta-analysis (Figure 1).

The flow diagram summarizing the selection of eligible studies
Thirty-five articles were included. Totally, 10271 patients received botulinum toxin.
The basic characteristics of the included studies are shown in Table 1.
| Ref. | Year | Country | No. of Patients in Botox Group | No. of Controls | Dose of Botox or Type of Control | Agea | Disease Durationa | Age at Onseta | Duration of Taking Botolinum | Muscular Weakness | Neck Pain | Blepharoptosis | Myalgia | Skin Tightness | Injection Pain | Headache | Musculo-Skeletal Pain | Nausea | Dizziness | Migraine | Facial Paralysis | Musculo-Skeletal Stiffness | Influenza-Like |
|---|---|---|---|---|---|---|---|---|---|---|---|---|---|---|---|---|---|---|---|---|---|---|---|
| (11) | 30 | 42.2U | 14.9 (7.2) | 3 | 6 | 13 | 2 | ||||||||||||||||
| 2009 | USA | 30 | Topiramate | 20.0 (9.2) | |||||||||||||||||||
| (12) | 2010 | USA | 29 | 200U | 3 | 13 | |||||||||||||||||
| 30 | Topiramate | 6 | |||||||||||||||||||||
| (10) | 2020 | USA | 45 | 155U | 15.1 (1.4) | 4.1 (2.9) | 10.7 (3.0) | 3 | 3 | 1 | 3 | 1 | |||||||||||
| 43 | 74U | 15.0 (1.5) | 4.2 (2.7) | 10.4 (2.9) | 5 | 3 | 0 | 3 | |||||||||||||||
| 37 | Placebo | 15.2 (1.5) | 4.5 (3.4) | 10.3 (3.8) | 0 | 0 | 1 | 1 | |||||||||||||||
| (13) | 2009 | Germany | 31 | 210U | 42 (12) | 23 (14) | 3 | 8 | 2 | ||||||||||||||
| 29 | 80U | 49 (11) | 29 (13) | ||||||||||||||||||||
| 62 | Placebo | 47 (11) | 27 (12) | 1 | |||||||||||||||||||
| (14) | 1999 | USA | 42 | 25 U | 42.8 | 23.4 | 3 | 6 | 4 | ||||||||||||||
| 40 | 75 U | 42.4 | 16.9 | 7 | 5 | ||||||||||||||||||
| 41 | Placebo | 46.8 | 27.4 | 0 | 1 | ||||||||||||||||||
| (15) | 2014 | Brazil | 20 | 100U | 44.8 (12.6) | 3 | 6 | 2 | |||||||||||||||
| 18 | Placebo | 45.8 (14.2) | 2 | 1 | |||||||||||||||||||
| (16) | 2013 | China | 60 | 25U | 40.25 | 5.7 | 4 | 2 | 1 | ||||||||||||||
| (17) | 2016 | USA | 359 | 155U | 45.1 (13.2) | 12 | 3 | 3 | 5 | 5 | 1 | 4 | 3 | ||||||||||
| (18) | 2018 | USA | 716 | 155U | 43.0 (11.3) | 27 | 17 | 29 | 18 | 10 | 7 | 14 | 12 | 7 | 9 | ||||||||
| (19) | 2019 | USA | 641 | 155U | 43.1 | 12.8 | 32.3 | 27 | 10 | 28 | 17 | 6 | 14 | 10 | 3 | 6 | 7 | 17 | 3 | ||||
| (20) | 2019 | USA | 140 | 200U | 40.2 (11.7) | 8 | 10 | 1 | 6 | 6 | |||||||||||||
| 142 | Topiramate | 39.4 (12.6) | 3 | 19 | 18 | 2 | |||||||||||||||||
| (21) | 2004 | Germany | 20 | 100U | 37 (14) | 21 (14) | 3 | 3 | 2 | 2 | 0 | ||||||||||||
| 20 | 16U | 41 (9) | 23 (11) | 1 | 4 | 2 | 2 | ||||||||||||||||
| 20 | Placebo | 37 (9) | 22 (2) | 5 | 0 | 1 | 1 | ||||||||||||||||
| (22) | 2019 | USA | 30 | 185U | 16.5 (1.83) | 12-24 | 1 | ||||||||||||||||
| (23) | 2015 | Spain | 132 | 155-195U | 46.3 (12.3) | 10.5 (8.4) | 12 | 6 | 7 | ||||||||||||||
| (24) | 2019 | USA | 716 | 155U | 43.0 (11.3) | 27 | 10 | 29 | 18 | 7 | 14 | 12 | 7 | 9 | 17 | ||||||||
| (25) | 2018 | USA | 716 | 155U | 43.0 (11.3) | 10.6 (11.0) | 32.5 (13.7) | 27 | 10 | 29 | 18 | 7 | 14 | 12 | 7 | 9 | 17 | ||||||
| (22) | 2018 | India | 30 | 185U | 16.5 (1.8) | 3 | 1 | ||||||||||||||||
| (26) | 2014 | USA | 513 | 195U | 41.4 (10.2) | 19.6 (12.4) | 6 | 8 | 22 | 10 | 11 | ||||||||||||
| 492 | Placebo | 42.3 (10.7) | 19.3 (12.6) | ||||||||||||||||||||
| (27) | 2010 | USA | 688 | 155U | 41.1 | 6 | 38 | 46 | 28 | 18 | 22 | 20 | 15 | 16 | |||||||||
| 696 | Placebo | 41.5 | 2 | 15 | 2 | 2 | 14 | 11 | 5 | 5 | |||||||||||||
| (28) | 2010 | USA | 341 | 155U | 41.2 | 20.3 | 6 | 20 | 20 | ||||||||||||||
| 338 | Placebo | 42.5 | 20.6 | ||||||||||||||||||||
| (29) | 2016 | Greece | 81 | 155U | 43.5 (9.8) | 9 | 5 | 5 | 3 | ||||||||||||||
| (30) | 2004 | USA | 30 | 200U | 46.3 (9.4) | 6 | 1 | ||||||||||||||||
| 30 | Placebo | 47.7 (12.7) | |||||||||||||||||||||
| (31) | 2014 | Germany | 1384 | 163U | 42.1 (10.34) | 20.1 (12.55) | 21.0 (11.09) | 6 | 127 | 191 | 63 | 43 | 68 | 111 | 51 | 33 | 53 | 109 | 99 | 35 | |||
| 1052 | Placebo | 42.3 (10.89) | 19.8 (12.89) | 21.6 (11.79) | 3 | 25 | 5 | 3 | 28 | 58 | 29 | 17 | 25 | 1 | 14 | 31 | |||||||
| (32) | 2011 | Thailand | 43 | 120U | 38.9 (9.8) | 4.3 (4.7) | 3 | 2 | 0 | 0 | 1 | 2 | 1 | ||||||||||
| 43 | 240U | 38.1 (9.8) | 5.4 (6.3) | 0 | 2 | 0 | 0 | 1 | 0 | ||||||||||||||
| 41 | Placebo | 38.7 (10.2) | 4.7 (6.6) | 1 | 0 | 1 | 0 | 0 | 0 | ||||||||||||||
| (33) | 2016 | Egypt | 15 | 155-195U | 32.81 (7.64) | 5.12 (2.98) | 3 | 1 | 5 | ||||||||||||||
| 14 | RTMS | 31.98 (8.12) | 5.61 (3.20) | ||||||||||||||||||||
| (34) | 2017 | UK | 688 | 155U | 41.1 (10.4) | 19.4 (12.4) | 21.2 (11.0) | 6 | 38 | 46 | 23 | 18 | 22 | 20 | 15 | 16 | |||||||
| 696 | Placebo | 41.5 (10.7) | 19.0 (12.7) | 21.9 (11.9) | |||||||||||||||||||
| (35) | 2015 | Italy | 24 | NR | 6 | 7 | 4 | ||||||||||||||||
| (36) | 2014 | Taiwan | 8 | 75U | 47.6 (13.6) | 8.1 (8.3) | 3 | 2 | 0 | ||||||||||||||
| 59 | 100U | 3 | 3 | ||||||||||||||||||||
| 27 | 155U | 0 | 1 | ||||||||||||||||||||
| (37) | 2018 | USA | 716 | 155U | 43 (11.3) | 27 | 1 | 0 | 0 | 3 | 1 | ||||||||||||
| (18) | 2018 | USA | 715 | 155U | 43 (18-73) | 27 | 29 | 18 | 14 | 17 | |||||||||||||
| (38) | 2010 | Taiwan | 688 | 155U | 6 | 38 | 60 | ||||||||||||||||
| 696 | Placebo | ||||||||||||||||||||||
| (39) | 2008 | USA | 20 | 100U | 42.2 (19-64) | 4 | 1 | 0 | |||||||||||||||
| 21 | Placebo | 42.4 (25-55) | 1 | 1 | |||||||||||||||||||
| (40) | 2010 | Canada | 53* | 95-130 U | 46.5 (8.4) | 6 | 2 | 5 | |||||||||||||||
| (41) | 2014 | UK | 254 | 155U | 45.04 (19-91) | 1.4 (0.8-3) | 1 | 37 | 28 | 38 | 11 | ||||||||||||
| (42) | 2020 | Italy | 115 | 155U | 50 (44.5-54) | 5.2 (2-12) | 15 | 11 | 12 |
Data Extracted from Studies
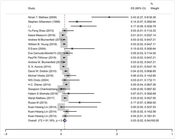
The pooled prevalence of musculoskeletal weakness in the head and neck regions was 4% (95% CI: 2-5%) (I2 = 92.2%, P < 0.001) (Figure 2).

The pooled prevalence of musculoskeletal weakness in the head and neck regions
The pooled prevalence of neck pain was 6% (95% CI: 4-7%) (I2 = 95.8%, P < 0.001) (Figure 3).

The pooled prevalence of blepharoptosis
The pooled prevalence of blepharoptosis was 2% (95% CI: 2-3%) (I2 = 91.1%, P < 0.001) (Figure 4).

The pooled prevalence of blepharoptosis
The pooled prevalence of facial paralysis was 2% (95% CI: 1-4%) (I2 = 94.1%, P < 0.001) (Figure 5).

The pooled prevalence of facial paralysis
The pooled prevalence of injection site pain was 4% (95% CI: 2-5%) (I2 = 93.5%, P < 0.001) (Figure 6).

The pooled prevalence of injection site pain
The quality assessments of included studies are shown in Table 2.
| First Author and Year | Random Sequence Generation (Selection Bias) | Allocation Concealment (Selection Bias) | Blinding of Outcome Assessment (Detection Bias) | Incomplete Outcome Data (Attrition Bias) | Selective Reporting (Reporting Bias) | Other Potential Threats to Validity |
|---|---|---|---|---|---|---|
| Mathew (2009) (11) | LRB | LRB | URB | LRB | URB | LRB |
| Cady (2011) (12) | LRB | LRB | LRB | URB | LRB | LRB |
| Winner (2019) (24) | LRB | LRB | LRB | LRB | LRB | LRB |
| Petri (2009) (13) | LRB | LRB | LRB | LRB | LRB | LRB |
| Silberstein (2000) (14) | LRB | LRB | LRB | HRB | LRB | LRB |
| Hollanda (2014) (15) | LRB | LRB | HRB | URB | LRB | URB |
| Shao (2013) (16) | LRB | HRB | HRB | URB | LRB | HRB |
| Maasumi (2015) (17) | HRB | HRB | HRB | HRB | LRB | HRB |
| Blumenfeld (2019) (18) | HRB | HRB | HRB | LRB | LRB | URB |
| Young (2019) (19) | HRB | HRB | HRB | LRB | LRB | URB |
| Rothrock (2019) (20) | LRB | HRB | HRB | LRB | HRB | URB |
| Evers (2004) (21) | LRB | LRB | LRB | URB | URB | URB |
| Ali (2019) (22) | HRB | HRB | HRB | LRB | LRB | URB |
| Cernuda-Morollo´n (2015) (23) | HRB | HRB | HRB | LRB | LRB | HRB |
| Winner (2019) (24) | HRB | HRB | HRB | LRB | LRB | LRB |
| Blumenfeld (2018) (25) | HRB | HRB | HRB | URB | LRB | LRB |
| Ali (2019) (22) | HRB | HRB | HRB | URB | HRB | HRB |
| Aurora (2014) (26) | LRB | LRB | LRB | URB | LRB | LRB |
| Dodick (2010) (27) | LRB | LRB | LRB | LRB | LRB | LRB |
| Aurora (2010) (28) | LRB | LRB | LRB | LRB | LRB | LRB |
| Vikelis (2016) (29) | HRB | HRB | HRB | LRB | LRB | HRB |
| Ondo (2004) (30) | LRB | LRB | LRB | URB | LRB | URB |
| Diener (2014) (31) | LRB | LRB | LRB | LRB | LRB | LRB |
| Chankrachang (2011) (32) | LRB | LRB | LRB | LRB | LRB | LRB |
| Shehata (2016) (33) | LRB | HRB | HRB | URB | URB | HRB |
| Matharu (2017) (34) | LRB | LRB | LRB | LRB | LRB | LRB |
| Mazza (2015) (35) | URB | HRB | HRB | HRB | LRB | HRB |
| Lin (2014) (36) | HRB | HRB | HRB | URB | LRB | HRB |
| Brin (2018) (37) | HRB | HRB | HRB | HRB | LRB | HRB |
| Blumenfeld (2018) (18) | URB | HRB | HRB | URB | LRB | HRB |
| Chen (2010) (38) | LRB | LRB | LRB | URB | LRB | HRB |
| Freitag (2008) (39) | LRB | LRB | LRB | LRB | LRB | LRB |
| Christie (2010) (40) | HRB | HRB | HRB | LRB | LRB | URB |
| Khalil (2014) (41) | HRB | HRB | HRB | LRB | LRB | URB |
| Ornello (2020) (42) | HRB | HRB | HRB | LRB | LRB | LRB |
The Quality Assessment of the Included Studies
5. Discussion
To the best of our knowledge, this is the first systematic review and meta-analysis evaluating botulinum toxin safety administration in patients with migraine.
The results show that the most frequent AEs were neck pain, followed by musculoskeletal weakness in the head and neck regions, injection site pain, and blepharoptosis or eyelid ptosis.
Hollanda et al., who assigned patients with chronic migraines to botulinum toxin or placebo groups, reported pain in injection site points as the most common AEs (15).
In a 24-week double-blind study of Phase III REsearch Evaluating Migraine Prophylaxis Therapy (PREEMPT), Aurora et al. reported AEs in 59.7% of enrolled patients in the botulinum toxin group and 46.7% in the placebo group. Only 5.3% experienced severe AEs, and 13.2% discontinued treatment (28). On the other hand, in the first 24 weeks of PREEMPT 2, 65.1% of patients experienced AEs, while only 4.3% had severe AEs (43). The pooled PREEMPT 24-week analysis showed that 62.4% of onabotA-treated patients reported AEs, while only 4.8% experienced serious AEs. Most AEs were mild/moderate and self-limited, and the most common AEs were neck pain, muscle weakness, ptosis, and injection-site pain (28, 43). In another 32-week open-label trial, Aurora et al. reported AEs in 58.3%, while 25.4% discontinued the treatment based on AEs. Like previous studies, neck pain, muscle weakness, and eyelid ptosis were the most frequent AEs (44). Finally, in an over 56-week trial, AEs were found in 78.3% and 75.9% of cases who received 5 or 3 cycles of botulinum toxin treatment. Serious AEs were found in 7.8% and 4.9% of 5 or 3 treatment cycles. It was shown that the rate of AEs decreased after each treatment cycle (26).
Diener et al. pooled data from 4 trials by evaluating 1997 patients with migraines and found that AEs happened in 73%, and almost all were mild/moderate (31). It was also demonstrated that patients who received 150-200 units per cycle experienced fewer AEs than those receiving more than 200 units per cycle of botulinum toxin. Most AEs were mild, lasted for one week, and were resolved between 8 to 9 weeks.
By enrolling 254 patients with chronic migraines in the Hull Migraine Clinic, Khalil et al. found injection-site pain, neck stiffness, ptosis, headache exacerbation, and dysphagia as common AEs after onabotA injection, respectively (41).
Dominguez et al. followed up on 725 patients with chronic migraine up to one year after administration of onabotA and showed AE incidence in 12.3% after the first dose, while 82.3% were mild/moderate and only 0.7% discontinued onabotA due to AEs (45).
Matharu et al. followed up on 1160 patients with chronic migraines from 58 European centers, 41.2% of which reported AEs, 5.3% were serious, and 4.4% discontinued treatment (46).
The present study had some strengths and limitations. First, we included most of all trials in this field. Second, we analyzed all related AEs.
The limitation was the difference in the dose of botulinum toxin in different studies.
5.1. Conclusions
The results of this systematic review and meta-analysis show that the most common AEs following botulinum toxin injection for migraine headache prophylaxis are neck pain followed by musculoskeletal weakness and injection site pain.
