1. Background
Coronavirus disease 2019 (COVID-19) is an infectious acute respiratory syndrome caused by the novel coronavirus, known as SARS-CoV-2, which serves as the etiological agent. Previous epidemics, such as MERS and SARS-CoV-1, have been documented with comparable etiological origins; however, none have attained the level of significance observed in COVID-19 (1). A systemic approach is imperative for addressing this syndrome, considering the evidence of potential complications in vital organs necessary for sustaining life. Consequently, the dissemination and subsequent impacts of SARS-CoV-2 within the body are extensive (2-4).
The impact of diseases on individuals' autonomy varies in terms of the level of disability they cause, ultimately affecting their quality of life. This often results in premature retirement and an increased need for medium and high-complexity healthcare services. Consequently, the distribution of these services across the country's territorial dominion differs, thereby limiting access to them. As a consequence, late diagnosis and limited capacity for rehabilitation become prevalent (5). One of the biggest challenges faced by health systems around the world in this century is the increasing burden of diseases. The increase in life expectancy, the modernization of lifestyles, and the increased exposure to various risk factors have all contributed to a shift in the burden of diseases that health systems are grappling with (6).
As populations go through the stages of demographic, epidemiological, and health transition, relying solely on other mortality indicators cannot accurately depict the health status of societies. Therefore, the non-fatal consequences of diseases and the relative increase in the prevalence of infectious diseases are not adequately represented and quantified. The most well-known index introduced in this regard is the Disability Adjusted Life Years (DALY), which measures the total number of years of life lost due to premature death and disability caused by diseases and injuries (7). The DALY represents the lost years of a person's life due to a disease (8-10). This scale is suitable for measuring the burden of the disease and the cost of the disease (9, 10). The DALY consists of two parts: Years of life lost due to premature death (YLL) and Years of life lived with disability (YLD) (8).
2. Objectives
Currently, due to the significant prevalence of diseases and disabilities and their undeniable impact on the epidemiological transition of diseases, which coincides with economic and social changes, it is crucial to prioritize and plan based on the actual needs and the burden of diseases. Therefore, in this study, we investigated the epidemiological trends and estimated the burden of COVID-19 in the the Iranian population.
3. Methods
The current study was conducted using cross-sectional methods, as well as field and library research. The statistical population consisted of the population covered by an insurance fund of the Islamic Republic of Iran who were admitted to the hospital due to COVID-19.
In the first stage, a search was performed on PubMed, Science Direct, ProQuest, the Cochran Library, and the Google Scholar search engine for all articles related to the burden of COVID-19 until July 2021. The necessary information to calculate the desired indicators for COVID-19 in the Iranian population included the number of deaths, hospitalizations, and the costs of hospitalization and treatment of patients obtained from the insurance organization. For a more comprehensive analysis of the results, we also collected data on age groups and genders. The results were then reported separately for each class to account for any potential confounding effects.
In this study, the methods used by the World Health Organization for the national burden of disease studies included estimating the years of life lost due to premature death and burden of disability (YLD), years of life lost from mortality (YLL), years of life lost due to disability diseases, and the total burden of death and disability in terms of disability-adjusted life years (DALY).
In the standard method of the World Health Organization, the following formula is used to calculate the disease burden: DALY = YLL + YLD. The formula used to calculate the burden of disability is YLD = I × DW x L, where I represents the number of COVID-19 cases in the community, DW represents the disability weight of COVID-19, and L is the average duration until recovery or death. The formula used to calculate premature death is YLL = N × L, where N represents the number of deaths due to COVID-19 and L represents the standard life expectancy at the time of death.
In order to obtain the aforementioned information, data regarding deaths and hospitalizations caused by COVID-19 in the Iranian population was acquired from the insurance organization. The values of DW (disability weight of disease) and L (standard life expectancy at the time of death) used in the above formulas are calculated as standard in disease burden studies worldwide and can be obtained from this study. After cleaning and adjusting the obtained data and gathering all the necessary items to calculate the indicators, the number of deaths and hospitalizations by gender, age group, and year are entered into the offline software using Excel version 2017. Excel software was used to calculate the three indicators. Also, direct costs caused by COVID-19 (all costs related to various treatment measures, hospitalizations, and consultations) were collected.
4. Results
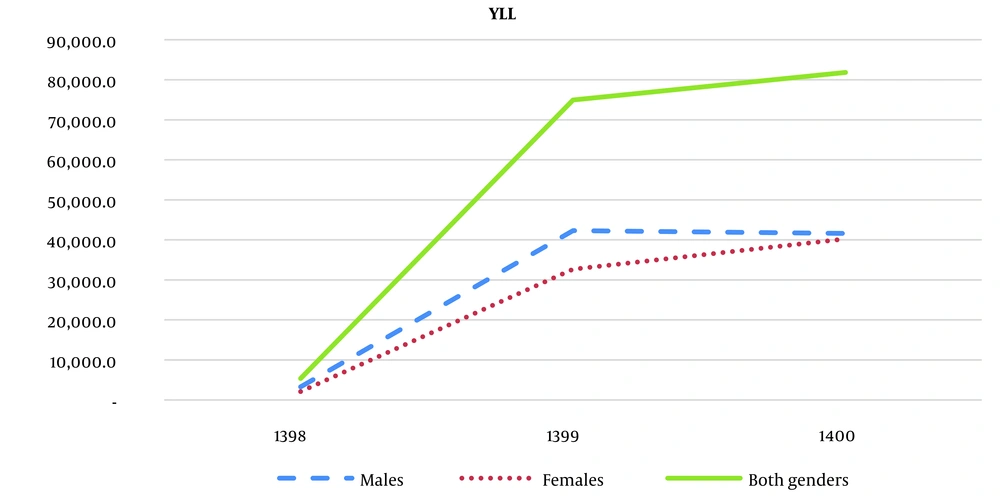
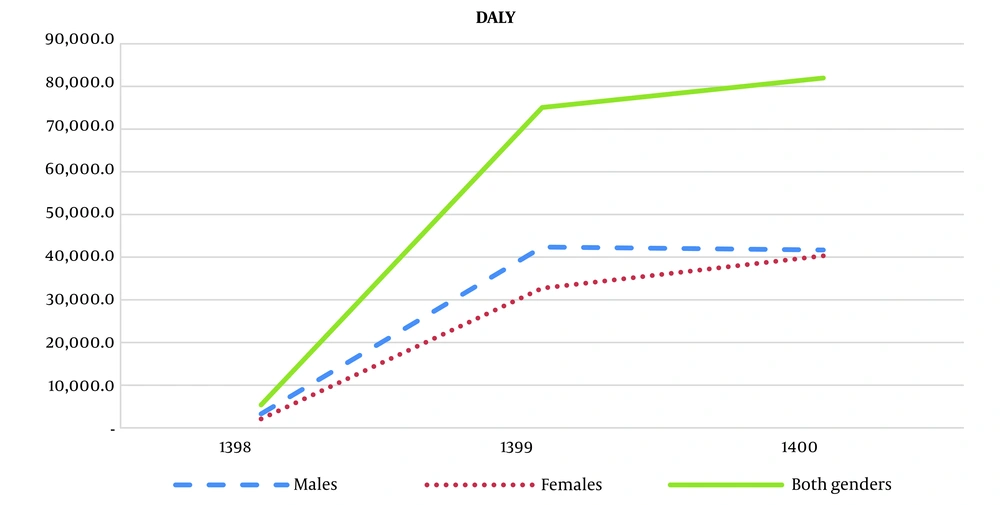
The number of DALY in the studied population due to COVID-19 was calculated as 5,372 years in 2019, 75,082 years in 2020, and 81,975 years in 2021. The highest number of hospitalizations was 89,057 people, and the highest cost of hospitalization occurred in 2021 (Table 1).
| Year | No. of Hospitalizations | Cost of Hospitalization (Rials) |
|---|---|---|
| 2019 | 5 336 | 195 418 372 868 |
| 2020 | 62 610 | 5 059 284 889 223 |
| 2021 | 89 057 | 5 532 391 420 742 |
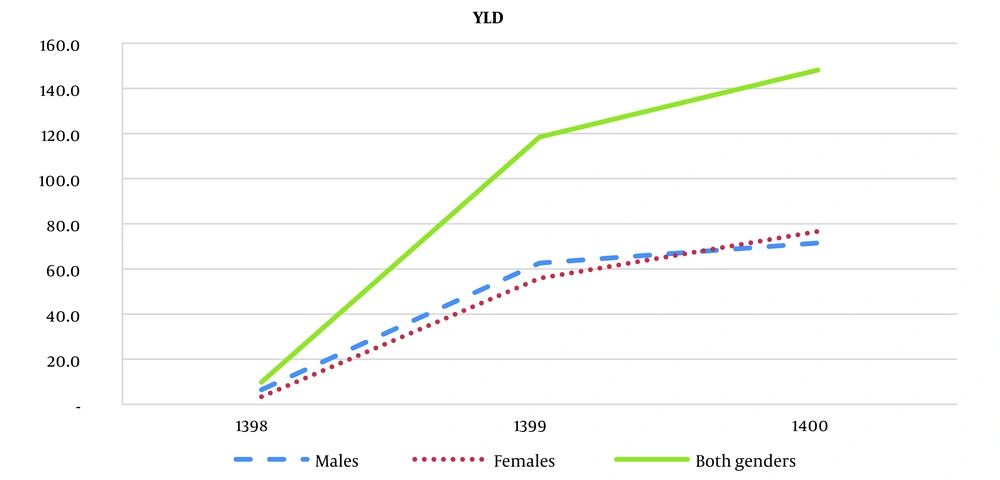
Table 1 shows the number of YLL, YLD, and DALY in the studied population due to COVID-19 in 2019, 2020, and 2021. The data are categorized by sex and age groups (Table 2).
| Variable and Age Group | YLL | YLD | DALYs | ||||||
|---|---|---|---|---|---|---|---|---|---|
| 2019 | 2020 | 2021 | 2019 | 2020 | 2021 | 2019 | 2020 | 2021 | |
| Males | |||||||||
| 0 - 4 | - | 181.6 | 90.7 | 0.2 | 0.8 | 2.0 | 0.2 | 182.4 | 92.7 |
| 5 - 14 | - | 175.1 | 88.3 | 0.1 | 0.5 | 1.0 | 0.1 | 175.6 | 89.3 |
| 15 - 29 | 79.7 | 757.6 | 518.4 | 0.8 | 7.0 | 6.5 | 80.5 | 764.7 | 524.8 |
| 30 - 44 | 188.8 | 3 447.4 | 3 942.6 | 1.4 | 11.3 | 14.3 | 190.2 | 3 458.7 | 3 956.9 |
| 45 - 59 | 1 287.0 | 10 549.5 | 9 962.3 | 1.9 | 14.7 | 16.5 | 1 288.9 | 10 564.1 | 9 978.8 |
| 60 - 69 | 934.6 | 12 693.4 | 13 252.2 | 1.0 | 11.7 | 14.1 | 935.6 | 12 705.1 | 13 266.3 |
| >70 | 782.3 | 14 500.8 | 13 737.1 | 1.0 | 16.7 | 17.2 | 783.4 | 14 517.5 | 13 754.4 |
| Total | 3 272.4 | 42 305.5 | 41 591.7 | 6.5 | 62.6 | 71.5 | 3 278.8 | 42 368.1 | 41 663.2 |
| Females | |||||||||
| 0 - 4 | - | 121.8 | 152.3 | 0.1 | 0.8 | 1.5 | 0.1 | 122.6 | 153.8 |
| 5 - 14 | - | 88.9 | 30.1 | 0.1 | 0.3 | 0.7 | 0.1 | 89.2 | 30.9 |
| 15 - 29 | 27.8 | 441.7 | 657.5 | 0.1 | 1.9 | 3.5 | 28.0 | 443.6 | 661.0 |
| 30 - 44 | 119.5 | 1 778.3 | 3 232.6 | 0.5 | 6.5 | 12.9 | 120.0 | 1 784.8 | 3 245.5 |
| 45 - 59 | 610.1 | 7 107.5 | 9 313.1 | 1.0 | 14.0 | 21.1 | 611.2 | 7 121.5 | 9 334.2 |
| 60 - 69 | 569.0 | 9 197.5 | 12 774.8 | 0.7 | 13.0 | 17.4 | 569.7 | 9 210.5 | 12 792.2 |
| >70 | 763.8 | 13 922.6 | 14 074.4 | 0.8 | 19.4 | 19.5 | 764.7 | 13 942.0 | 14 093.9 |
| Total | 2 090.3 | 32 658.3 | 40 234.9 | 3.4 | 55.9 | 76.6 | 2 093.6 | 32 714.2 | 40 311.5 |
| Both genders | |||||||||
| 0 - 4 | - | 303.4 | 243.0 | 0.4 | 1.6 | 3.4 | 0.4 | 305.0 | 246.4 |
| 5 - 14 | - | 264.0 | 118.4 | 0.1 | 0.8 | 1.7 | 0.1 | 264.8 | 120.2 |
| 15 - 29 | 107.5 | 1 199.4 | 1 175.9 | 1.0 | 8.9 | 10.0 | 108.5 | 1 208.2 | 1 185.8 |
| 30 - 44 | 308.3 | 5 225.7 | 7 175.2 | 1.9 | 17.8 | 27.2 | 310.2 | 5 243.5 | 7 202.4 |
| 45 - 59 | 1 897.1 | 17 657.0 | 19 275.4 | 2.9 | 28.6 | 37.6 | 1 900.0 | 17 685.6 | 19 313.1 |
| 60 - 69 | 1 503.5 | 21 890.9 | 26 027.0 | 1.8 | 24.7 | 31.5 | 1 505.3 | 21 915.6 | 26 058.6 |
| >70 | 1 546.2 | 28 423.5 | 27 811.6 | 1.9 | 36.1 | 36.7 | 1 548.0 | 28 459.6 | 27 848.3 |
| Total | 5 362.7 | 74 963.8 | 81 826.5 | 9.8 | 118.5 | 148.2 | 5 372.5 | 75 082.3 | 81 974.7 |
The number of DALY per 1 000 people in the studied population due to COVID-19 was 17.9 years in 2018, 256 years in 2019, and 287.6 years in 2020.
Table 3 shows the number of YLL, YLD, and DALY per 1 000 people in the studied population due to COVID-19 in 2019, 2020, and 2021, categorized by gender and age groups (Table 3).
| Variable and Age Group | YLL (Per 1000) | YLD (Per 1000) | DALYs (Per 1000) | ||||||
|---|---|---|---|---|---|---|---|---|---|
| 1398 | 1399 | 1400 | 1398 | 1399 | 1400 | 1398 | 1399 | 1400 | |
| Males | |||||||||
| 0 - 4 | - | 5.24 | 2.62 | 0.01 | 0.02 | 0.06 | 0.01 | 5.26 | 2.67 |
| 5 - 14 | - | 3.96 | 2.00 | 0.00 | 0.01 | 0.02 | 0.00 | 3.97 | 2.02 |
| 15 - 29 | 0.45 | 4.25 | 2.91 | 0.00 | 0.04 | 0.04 | 0.45 | 4.29 | 2.95 |
| 30 - 44 | 2.16 | 39.43 | 45.10 | 0.02 | 0.13 | 0.16 | 2.18 | 39.56 | 45.26 |
| 45 - 59 | 72.44 | 593.80 | 560.75 | 0.11 | 0.83 | 0.93 | 72.55 | 594.63 | 561.68 |
| 60 - 69 | 121.04 | 1 644.01 | 1 716.38 | 0.13 | 1.51 | 1.83 | 121.18 | 1 645.52 | 1 718.22 |
| >70 | 97.04 | 1 798.66 | 1 703.94 | 0.13 | 2.07 | 2.13 | 97.17 | 1 800.74 | 1 706.07 |
| Total | 8.66 | 111.90 | 110.01 | 0.02 | 0.17 | 0.19 | 8.67 | 112.06 | 110.20 |
| Females | |||||||||
| 0 - 4 | - | 3.78 | 4.73 | 0.00 | 0.02 | 0.05 | 0.00 | 3.80 | 4.77 |
| 5 - 14 | - | 2.15 | 0.73 | 0.00 | 0.01 | 0.02 | 0.00 | 2.15 | 0.74 |
| 15 - 29 | 0.57 | 9.12 | 13.58 | 0.00 | 0.04 | 0.07 | 0.58 | 9.16 | 13.65 |
| 30 - 44 | 1.65 | 24.56 | 44.65 | 0.01 | 0.09 | 0.18 | 1.66 | 24.65 | 44.83 |
| 45 - 59 | 44.61 | 519.67 | 680.93 | 0.08 | 1.02 | 1.54 | 44.68 | 520.69 | 682.47 |
| 60 - 69 | 45.60 | 737.15 | 1 023.87 | 0.06 | 1.04 | 1.40 | 45.66 | 738.20 | 1 025.26 |
| >70 | 116.19 | 2 117.83 | 2 140.92 | 0.13 | 2.95 | 2.97 | 116.31 | 2 120.78 | 2 143.89 |
| Total | 9.20 | 143.73 | 177.07 | 0.01 | 0.25 | 0.34 | 9.21 | 143.98 | 177.41 |
| Total | |||||||||
| 0 - 4 | - | 9.02 | 7.34 | 0.01 | 0.05 | 0.10 | 0.01 | 9.06 | 7.44 |
| 5 - 14 | - | 6.10 | 2.72 | 0.00 | 0.02 | 0.04 | 0.00 | 6.12 | 2.76 |
| 15 - 29 | 1.02 | 13.37 | 16.48 | 0.01 | 0.08 | 0.11 | 1.03 | 13.45 | 16.59 |
| 30 - 44 | 3.81 | 63.99 | 89.75 | 0.02 | 0.22 | 0.34 | 3.83 | 64.21 | 90.09 |
| 45 - 59 | 117.05 | 1 113.47 | 1 241.68 | 0.18 | 1.85 | 2.47 | 117.23 | 1 115.32 | 1 244.16 |
| 60 - 69 | 166.64 | 2 381.17 | 2 740.25 | 0.19 | 2.56 | 3.23 | 166.84 | 2 383.72 | 2 743.48 |
| >70 | 213.23 | 3 916.50 | 3 844.86 | 0.25 | 5.02 | 5.10 | 213.48 | 3 921.52 | 3 849.96 |
| Total | 17.85 | 255.62 | 287.08 | 0.03 | 0.41 | 0.53 | 17.89 | 256.04 | 287.61 |
The number of YLL, YLD, and DALY in the studied population due to COVID-19 in 2019, 2020, and 2021 are displayed by gender in Figures 1, 2, and 3.
5. Discussion
The measurement of the collective impact of mortality and morbidity plays a crucial role in establishing a standardized framework for comparing the severity of health outcomes across different countries. Additionally, it enables the quantification of the relative impact of COVID-19 within a country, compared to other causes of illness and injury, as well as its variation across sub-national regions and demographic groups (11).
The amount of medical expenses for hospitalized patients in Iran differed from the studies conducted in China (9, 10). These expenses in the Chinese studies (12, 13) were calculated using statistical estimates and in great detail. Also, more comprehensive information, such as health system labor costs and costs related to new hospital facilities, were included in this country's medical costs. However, in the studies conducted in Iran (14), these costs were not calculated, and only direct medical costs were taken into account. Therefore, the most significant reason for the disparity in per capita medical expenses between Iran and other countries is the failure to account for indirect expenses.
Some studies show that the burden of COVID-19 is higher in developing countries than in developed countries (15, 16). The DALY obtained in this study was higher than that in Denmark (16) and also higher than the DALY reported in global studies investigating COVID-19 (17). However, similar to both studies, DALY rates were higher in men than women and in older individuals than younger individuals.
In this study, the disease burden was found to be higher compared to studies conducted in Yazd and Kurdistan provinces (18, 19) among civilians. This finding shows that the impact of COVID-19 is not the same across the country.
In this study, similar to other studies conducted in Iran (15, 16), the DALY rate was higher in men than in women. The disease burden in the studied population was associated with the year 2021, with the years 2020 and 2019 ranking next. This finding aligns with the results of previous studies (14). Considering that the year 2020 coincided with the global COVID-19 outbreak and the emergence of new virus mutations, and also that the developed vaccines had not yet reached the stage of widespread distribution, the infection and mortality rates due to COVID-19 were high during that year, and as a result, the disease burden was also reported to be higher.
One of the apparent limitations in DALY calculation is accurately determining years of life with disability (YLD). Most of the patients with this disease are not hospitalized, so information about these individuals is not available. As a result, the data on these patients and the YLD they generate are not included in the calculation of DALY. This omission may lead to erroneous results in the studies, as it undercounts the impact of the disease to accompany.
The total DALY for COVID-19 in the the the Iranian studied population during the three-year study period was calculated to be 162,429 years, which is a significant figure. The disease burden showed an increasing trend in the studied years and reached its peak in 2021, which aligns with the overall disease situation in the country. In general, the disease burden was higher in men than in women. It seems that the reason for this is that there are more employed men compared to women, and they have a greater presence in society, which leads to more contact with patients.


