


1. Background
Malnutrition (undernutrition) is defined as the state resulting from an insufficient intake, uptake, or use of nutrients that leads to altered body composition (decreased fat-free mass and body cell mass), which in turn limits physical and mental function and is associated with clinical outcomes (1). Three different types of malnutrition have been proposed and accepted as a consensus: disease-related malnutrition (DRM) with or without inflammation, and malnutrition without disease, such as hunger-related malnutrition (1). Within the hospital setting, all of these types may develop.
Hospital malnutrition is a common worldwide problem, with prevalence rates ranging from 19% to 80%, according to extensive documentation. To identify malnutrition risk in a timely manner, nutritional screening must be implemented for all patients within the first 24 to 48 hours of hospital admission. Consequently, appropriate nutritional therapy can be implemented promptly, thereby lowering mortality, morbidity, and length of hospital stay (2).
Several nutritional screening tools have been developed for the prompt identification of at-risk patients and to facilitate referrals for more comprehensive nutritional care (3), such as the Mini Nutritional Assessment, Nutritional Risk Screening 2002, Malnutrition Universal Screening Tool, and subjective global assessment (SGA), among others. Although these tools include overall similar indicators, not all have the same concordance, which explains the wide range of hospital malnutrition prevalence. In this context, the SGA has been extensively validated in hospitalized patients with different conditions (e.g., cancer, cirrhosis, kidney disease, major surgery), yielding excellent reproducibility and reliability (i.e., kappas and rhos > 0.7). It correlates not only with anthropometric data (percent weight loss, BMI, tricipital fold, and arm circumference) but also with biochemical indicators (albumin, transferrin, and total cholesterol) as it includes data from clinical history (food and fluid intake, weight change, and gastrointestinal symptoms), a physical exam (evaluating muscle and fat stores), and metabolic demand.
Nevertheless, in 2018, an international group of experts in hospital nutrition proposed the global leadership initiative on malnutrition (GLIM) criteria. This initiative aimed to establish a unified and more global practical approach for diagnosing and classifying hospital malnutrition. The framework drew from the consensus of the Academy of Nutrition and Dietetics (AND), the American society of parenteral and enteral nutrition (ASPEN), and the European society for clinical nutrition and metabolism (ESPEN). According to this global consensus, diagnosing malnutrition requires at least one phenotypic criterion and one etiological criterion. The severity of malnutrition (moderate or severe) is further determined based on phenotypic criteria (e.g., moderate malnutrition when weight loss is > 5%) (4). Although this consensus report was published in 2019, not all institutions have implemented this tool; however, different studies have validated the GLIM criteria — indeed, versus the SGA — yielding even higher feasibility and patient acceptability (5). Moreover, the GLIM criteria have also proven to be a good predictor of short-term (i.e., 30 days) mortality and hospital readmission (6, 7).
2. Objectives
Given the aforementioned, the objective of our study was to validate the GLIM criteria in a third-level military hospital, considering that, worldwide, no information has been reported within this population other than in studies by a group assessing retrospective multicentered cohorts, which include army facilities (4, 8).
3. Methods
We conducted a cross-sectional study in hospitalized patients at a third-level institution (Mexico’s Central Military Hospital). Consecutive case sampling was used. Once participants agreed to be part of the study, they were asked to sign an informed consent form. The same interviewer administered both tools (GLIM and SGA). In all cases, data were obtained from primary sources (i.e., the patient and their companions), with the exception of laboratory values, which were obtained from patients’ chart registers. Body weight was measured using an InBody Dual scale, and height was assessed with a SECA model 213 stadiometer, using the techniques described by Roberts et al. (5). A physical examination was performed to complete the SGA questionnaire, and patients were then classified into one of three categories (6):
- A: No malnutrition
- B: Moderate malnutrition
- C: Severe malnutrition
The SGA assessment includes weight loss during the past 6 months and the last 2 weeks, sufficient dietary intake and changes with respect to the normal diet (liquid, hypocaloric, appetite perception), gastrointestinal symptoms such as nausea, vomiting, diarrhea, and functional capacity, together with the physical examination of fat (suborbital, triceps, and bicipital) and muscle (temporal, clavicular, scapular, calf circumference, interosseous) reserves, and the presence of fluid overload (9).
GLIM was further completed, and patients were classified as malnourished if they fulfilled at least one phenotypic criterion and one etiological criterion. The severity of malnutrition was also staged according to GLIM guidelines. In brief, GLIM phenotypic criteria include involuntary weight loss and/or low BMI and/or reduced muscle mass, whereas etiological criteria include either reduced food intake or an inflammatory condition (4).
For the criterion of reduced muscle mass, bioimpedance (with InBody Dual) was used, employing the cut-off points of the described parameters. The values indicated by the European Society of Clinical Nutrition and Metabolism (ESPEN) for fat-free mass (fat-free mass/height in meters squared) were used, indicating that for men it is 17 kg/m2 and for women, 15 kg/m2 (4). Hand-grip strength was measured using a CAMRY EH101 digital hand dynamometer. The patient stood upright with arms slightly away from the body. Two measurements were taken on each hand, alternating between hands, and recording the highest value. Results were classified as “weak” or “normal” according to gender. Finally, the calf circumference of each leg was measured — as described elsewhere — using a non-elastic tape placed horizontally, touching the entire circumference without pinching the skin. The tape was moved up and down to determine the maximum circumference perpendicular to the axis of the calf (10). The present protocol was approved and registered by IRB number 2023FNV082.
3.1. Statistical Analysis
Quantitative variables are presented as measures of central tendency and dispersion, in accordance with their distribution. Qualitative variables are presented as frequency and percentages. For inferential statistics (11), concordance reliability was assessed with Cohen’s Kappa, considering > 0.80 as a substantial strong correlation. Finally, for construct validity, we used hospital length of stay (LOS) and considered it to be significant with a P-value < 0.05.
4. Results
During June to July 2024, all hospitalized patients who consented to participate were considered. A total of 323 patients were screened; 48.6% were male, and 78% were under 65 years old. Patients were hospitalized in different departments: 6.8% from Cardiology, 8.4% from Men's Surgery, 9.9% from Women's Surgery, 1.5% from Plastic Surgery, 3.1% from Vascular Surgery, 4% from Endocrinology, 6.2% from Gastroenterology, 6.5% from Hematology, 6.5% from Infectology, 6.2% from Men's Medicine, 7.4% from Women's Medicine, 2.8% from Nephrology, 4.3% from Pneumology, 1.2% from Neurosurgery, 3.1% from Neurology, 11.1% from Oncology, 2.8% from Orthopedics, 2.2% from Otolaryngology, 1.9% from Transplants, and 4% from Urology. Oncology had the highest number of patients screened, while Neurosurgery had the lowest availability of patients for screening. Demographic data are described in Table 1.
| Variables | Values |
|---|---|
| Gender (male); No. (%) | 155 (48.6) |
| Age (y) | 53 ± 8 |
| Body Mass Index (kg/m2) | 26.3 ± 4.3 |
| Fat mass (%) | 34.5 ± 9.1 |
| Muscle mass (kg) | 24.1 ± 5.4 |
| Calf circumference (cm) | 33.7 ± 3.9 |
| Hand grip strength (kg) | 19.4 ± 10.3 |
| Length of stay (d) | 5.5 ± 6.3 |
Demographic Data of Studied Sample a
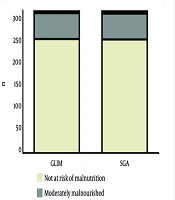
Nutritional screening identified 19.5% of patients as malnourished according to the GLIM criteria, while 19.8% were identified as such by the SGA. The most frequent indicator in both tools was unintentional weight loss, followed by the presence of an inflammatory condition (e.g., major surgery, neoplasia). As shown in Figure 1, regarding severity, similar results were found: 18.3% had moderate malnutrition and only 1.2% presented severe malnutrition according to the GLIM criteria; for the SGA, the corresponding prevalences were 18.2% and 1.5%.
 and subjective global assessment (SGA) criteria.")
Prevalence of malnutrition, according to global leadership initiative on malnutrition (GLIM) and subjective global assessment (SGA) criteria.
According to the validation guidelines designed by the GLIM group (9), the tool is accepted as valid when, after a significant association (P < 0.0001 for chi-square, and OR 89.19, CI 37.95 - 209.6), concordance (i.e., Kappa) versus the gold standard (in this case, SGA) is at least moderate (0.6 - 0.8). Moreover, as with any other diagnostic test, the sum of its sensitivity and specificity should be at least 1.5, and its predictive values should be more than 80%. All these criteria are met, as shown in Table 2.
| Statistical Indicator | Values |
|---|---|
| χ2 | 184.128 |
| OR | 89.19 |
| Kappa Coefficient | 0.755 |
| Sensitivity | 0.8125 |
| Specificity | 0.9537 |
| Positive Predictive Value | 0.8095 |
| Negative Predictive Value | 0.9500 |
Diagnostic Performance Between Global Leadership Initiative on Malnutrition and Subjective Global Assessment
Thus, with this validation, we compared the length of stay, confirming that malnutrition is positively associated with it: as seen in Figure 2, patients with a GLIM-diagnosed nutritional status depletion had a significantly higher length of stay (8 vs. 5 days, P < 0.001).
 between patients with/without malnutrition, according to Global Leadership Initiative on Malnutrition (GLIM) criteria. (* P < 0.001 after independent <i>t</i>-test)")
Comparison in LOS (days) between patients with/without malnutrition, according to Global Leadership Initiative on Malnutrition (GLIM) criteria. (* P < 0.001 after independent t-test)
5. Discussion
Our study screened a total of 323 patients from all services at a military hospital and validated the GLIM criteria for the diagnosis of malnutrition. When compared to the SGA, the percentages of altered nutritional status were fairly similar (19.8% with SGA and 19.5% with GLIM). Likewise, the severity of malnutrition was also concordant (18.3% presented moderate malnutrition according to SGA and 18.3% according to GLIM; 1.5% presented severe malnutrition according to SGA and 1.2% according to GLIM).
The above is extremely important since, at an international level, there is an attempt to obtain a unified and valid scale to improve and optimize the timely diagnosis of malnutrition in patients from different populations. This is in addition to avoiding the consequences that may otherwise be caused, such as increased days of hospital stay, complications of the underlying disease, risk of contracting nosocomial diseases, risk of falls, and increased hospital expenses, both for the institution that provides medical services and for patients and their families (12).
These findings are in line with other validation studies of the GLIM criteria. For example, a study by Maeda et al. reported a similar prevalence of malnutrition (22.4%) using GLIM in hospitalized elderly patients, with high agreement with SGA (κ = 0.84) (13). Likewise, another group found prevalences of 23.7% with GLIM criteria and 24.5% with SGA in internal medicine patients in Spain, reinforcing the reliability of GLIM in clinical settings (14). Our results are slightly lower, which may be due to differences in population characteristics or care protocols in a military hospital setting.
Regarding severity classification, our data also showed strong concordance. This supports observations by other studies, which have found that GLIM provides comparable gradation to SGA, though it may slightly underestimate severe cases when inflammatory markers are not routinely used (15). Similarly,another study reported 20.6% of cancer patients diagnosed with malnutrition by GLIM versus 22% by SGA, with good diagnostic agreement (κ = 0.76) (16).
Nevertheless, some studies show greater discrepancies. For example, when studying critically ill patients, malnutrition rates are around 34% with GLIM and 41% with SGA, suggesting that SGA may be more sensitive in critically ill patients (17). These differences highlight the importance of evaluating diagnostic tools within specific patient contexts to ensure accurate and timely identification.
Finally, malnutrition is associated with a longer hospital stay. This implies a greater need for resources and care for malnourished patients. Furthermore, as shown in Figure 2, significant weight loss in malnourished patients indicates a deterioration in nutritional status and the need for more detailed nutritional and medical intervention (18).
5.1. Conclusions
The GLIM criteria proved to be a valid instrument for the diagnosis of malnutrition, showing a strong correlation and high level of agreement with the SGA when applied under the same conditions. We validated this tool at the Central Military Hospital, and it should be used to assess malnutrition to obtain comparable results to those reported worldwide.
5.2. Limitations
The study was conducted in a center that serves only military beneficiaries or insured individuals, so it does not include a sample from all areas of the country.
