1. Background
Epilepsy is known as the most widespread neurological disorder with a prevalence of 0.6% to 0.8% of the world’s population. Two-thirds of the patients used anticonvulsive medications to sufficiently control the seizure and 8% to 10 % could benefit from respective surgery. However, the currently remaining 25% of the patients have no sufficient treatment for this disease. Epileptic seizure occurs due to sudden malfunctioning in the brain and synchronization of a set of neurons in the brain thereby reflecting the excessive and hyper synchronous activity of neurons in the brain. In this work, the dynamics of generalized, partial (focal), and non-focal seizures were examined in detail. The epileptic seizures termed as recurrent seizures are the hallmark of epilepsy. According to clinical manifestation, these seizures are divided to focal, generalized, partial, unclassified, and unilateral (1, 2). Only a part of the cerebral hemisphere is affected during focal epileptic seizure and these seizures produce symptoms in corresponding body parts or in some related mental functions. The generalized epileptic seizures involve the entire brain and bilateral motor symptoms are produced usually with loss of consciousness. Both types of these seizures may occur at any stage. Moreover, (1) it has been reported that generalized epileptic seizures could be further subdivided to absence (petit mal) and tonic-clonic (grand mal) seizures (2, 3).
To detect the epileptic seizures and spikes, various traditional methods are employed, such as visual scanning of EEG recordings, which are inaccurate and expensive in case of long recordings. Researchers have recently used many automatic methods based on chaotic, time frequency analysis, neural networks or mixed methods, including correlation dimension (CD), largest laypunov exponent (LLE), Chaos - neural networks, approximate entropy, discrete wavelet transform, k-nearest neighbours (KNN) classifier, normalized Shannon, and spectral entropy (4).
The oscillatory activity of the brain is increasingly thought to become synchronized during physiological or pathological brain states and performance of certain tasks (e.g. increased attention tasks, sleep-wake states, epileptic seizures and optical stimulation, etc.). In addition, the behaviour and complexity of the brain is nonlinear, thus methods from the theory of nonlinear dynamics, such as entropy, could be employed to analyse the dynamics of EEG signals (5).
The complexity of a system or signal could be investigated using several types of measures, such as entropies or fractal dimensions. The methods could be used to compare the signals, distinguish or detect the regular or random epochs. A number of variants of this notion have been proposed in the literature to show varying degrees of flexibility, efficiency in computation, relevance to problems, and theoretical foundations. The information processing in the brain manifests itself through its global electrical activity, measured by the electroencephalogram (EEG). It is a multidimensional, nonlinear, non-stationary time series with respect to the processing point of view. Moreover, variations of EEG are used for normal aging and pathological aging as means of complexity analysis (6).
In neuroscience, to characterize the specific brain region functions and to describe the functional integrations are two complementary but not mutually exclusive issues. These issues can be tackled by considering the brain as a complex system (7). In this scenario, one can investigate the complexity by characterizing a highly variable system with many other parts whose behaviours are strongly dependent on each other (8). The complexity of brain signals could be estimated using many information-theoretic tools. Generally, complex systems could be characterized by their entropy concerning their uncertainty. Typically, low entropy values are related to a high degree of organization; a high entropy value is associated with unpredictability, uncertainty and disorder. Recently, to quantify the nonlinear dynamics and inherent properties in brain activity, a number of techniques for signal analysis have been designed (9). Kolmogorov entropy was developed by Pincus in 1991 to measure the signal regularity (10), termed as approximate entropy (AE), which produced an average rate of information in the dynamical system that could be used for short and noisy data. In one dimensional representation of original time series, AE could search for epochs that are similar and can also remain similar with increased dimensionality (11). Moreover, they also introduced cross sample entropy as a refined version of cross approximate entropy to estimate the synchronization between the bivariate time series (12).
Biological signals including EEG and electrocardiograms (ECG) in the light of fundamental nonlinear theory represent the outcome of nonlinear interactions between different processes at multiple spatial and temporal scales. In this manner, some studies require careful examination of changes in nonlinear indices with scales. Recently, heart-rate dynamics have been examined by (13) using detrended fluctuation analysis (DFA) to examine the crossover changes phenomenon of the fractal correlation exponents between short and long time scales. The short-term exponent is understood to be examined using cardiorespiratory interaction (13, 14). Multiscale entropy (MSE) analysis, proposed by a number of previous studies (15-17), using entropy based methods, is able to measure the complexity of nonlinear signals at multiple temporal scales. For example, parasympathetic activity is correlated with MSE on different scales of heartbeat sequence at scales 3 to 5, whereas parasympathetic processes are activated at scales 1 to 4 (18).
Epilepsy is the most common neurological disorder produced due to sudden malfunctioning in the brain and synchronization of a set of neurons in the brain thereby reflecting the excessive and hyper synchronous activity of neurons in the brain. The signals are non-stationary, nonlinear, and highly complex in nature, the most highly robust methods from the theory of nonlinear dynamics are required to capture the dynamics of these signals. The classical methods fail to fully capture the dynamics in these signals. Entropy-based complexity methods at multiple temporal scales were employed to quantify the dynamics of EEG epileptic seizure signals. In this research, the complexity was investigated in EEG signals, including five conditions to distinguish healthy subjects (with eyes open and closed) and epileptic subjects (ictal interval- with seizures), and epileptic subjects (interictal interval and without seizures i.e. focal and non-focal signals). The complexity was measured using multiscale sample entropy (MSE) and wavelet entropies at multiple temporal scales.
The main objective of this study is to quantity the dynamics of EEG signals with both ictal and interictal intervals using complexity based entropy measures at multiple temporal scales. The complexity loss because of degrading in structural and functional components. The significance was observed to distinguish different conditions at multiple temporal scales. The maximum separation AUC was computed using ROC.
2. Methods
2.1. EEG Data Sets
The data was taken from publicly available datasets (19) consisting of three different cases: 1, healthy subjects; 2, epileptic subjects i.e. interictal (during seizure free interval); 3, Epileptic subjects i.e. ictal (during seizure interval). There were five cases in the dataset namely: O, Z, F, N and S, whereas sets O and Z were taken from healthy subjects with eyes open and closed conditions respectively by external surface electrodes. Moreover, sets F and N were taken from interictal subjects; where set F was attained from the epileptogenic zone of the brain showing focal interictal activity and N was attained from the hippocampal formation of opposite hemisphere of the brain showing non-focal interictal activity, while set S was attained from an ictal subject. All the sets contained 100 EEG channel sampled at 174 Hz and recorded for 24 seconds. All EEG signals were recorded with the same 128- channel amplifier system, using an average common reference. After 12 bit, analog-to-digital conversion, the data were written continuously onto the disk of a data acquisition computer.
Epilepsy with onset seizures in adult lifetime is not a rare phenomenon but a common diagnostic issue. In less than 20% to 25% of patients with epilepsy, the first seizure occurs at the age of 25. It is a disorder of cortical excitability and interictal EEG is used as the most convenient and least expensive way to demonstrate the physiological manifestation of this disorder. About 50% of the patients show interictal epileptic discharge of EEG with epilepsy.
Focal epileptic seizures produce symptoms in some related mental functions and in the corresponding part of the body involving only part of the hemisphere function whereas the generalized seizures involve the entire body and generate bilateral symptoms normally with the loss of consciousness, both of which may occur at all ages. The ictal seizures are the most significant abnormalities in EEG that result several diseases, such as tuberculous meningitis, measles encephalitis, neurosyphilis, herpes simplex encephalitis, rickettsia disease, and also result in craniocerebral trauma, or brain damage.
The following entropy-based complexity methods were developed in Matlab 2015a to quantify the dynamics of EEG signals with healthy and epileptic conditions.
2.2. Sample Entropy
To quantify the amount of regularity in a time series, it is pertinent to understand the behaviour of a system. Sample entropy is one of the most popular regularity measurements for a time series; an unbiased estimator of the conditional probability that two similar sequences of m consecutive data points will remain similar when one or more consecutive points are included (where m is the embedded dimension). By using the sampling procedure, SampEn characterizes the complexity strictly on a time scale, however, long-term structures in the time series cannot be captured by SampEn. Therefore, Costa proposed a multiscale sample entropy (MSE) algorithm, which uses SampEn at multiple time scales to tackle the problem under consideration. Multiscale evaluation of the entropy has several advantages by allowing inspection of the dynamics along more than one temporal scale. This is a significant characteristic of biological systems, which needs to be operated at multiple spatiotemporal scales, whose complexity is also multi-scaled and hierarchal. The MSE is already used in different fields to analyse different problems, such as human gait dynamics, time series of river flow, heart rate variability, electro seismic time series, social dynamics, time series of traffic flow, chatter to milling process, and vibration of a vehicle etc. These works demonstrated the effective use of MSE algorithm to analyse these complex time series (20).
The multiscale entropy method was developed to quantify complex signals over a range of scales. By integrating the values from a predefined range of scales, the overall degree of complexity was computed. To compute the MSE, two steps are mainly involved 1) Coarse graining procedure used to represent the dynamics of system at different time scales; and 2) quantifying the degree of irregularity of each coarse-grained time series using SampEn introduced by Moorman. Sample entropy is the conditional probability measure to quantify the likelihood that a sequence with m consecutive data points, that matches another sequence of the same length (matches with tolerance), will still match another sequence when its length is increased by one sample i.e. m + 1; thus, m defines the patterns that are compared to each other. Mathematically, this distance is computed between two vectors as the maximum absolute difference of their correspondence scale component. Thus, sample entropy could be more precisely computed using the following formula:

Where Pm (r) denotes the probability that 2 sequences, which will still match for m+1 points and Qm (r) is the probability that 2 sequences will match for m points (with tolerance of τ ); where self matches are excluded. In this regard, Equation 1) could be expressed as:

By setting

and

We have

and thus sample entropy can be expressed as:

2.3. Multiscale Sample Entropy (MSE)
Sample entropy is applicable over a single time scale factor yet for complex nonlinear signals (17) multiscale sample entropy has been developed using coarse - grained time series.
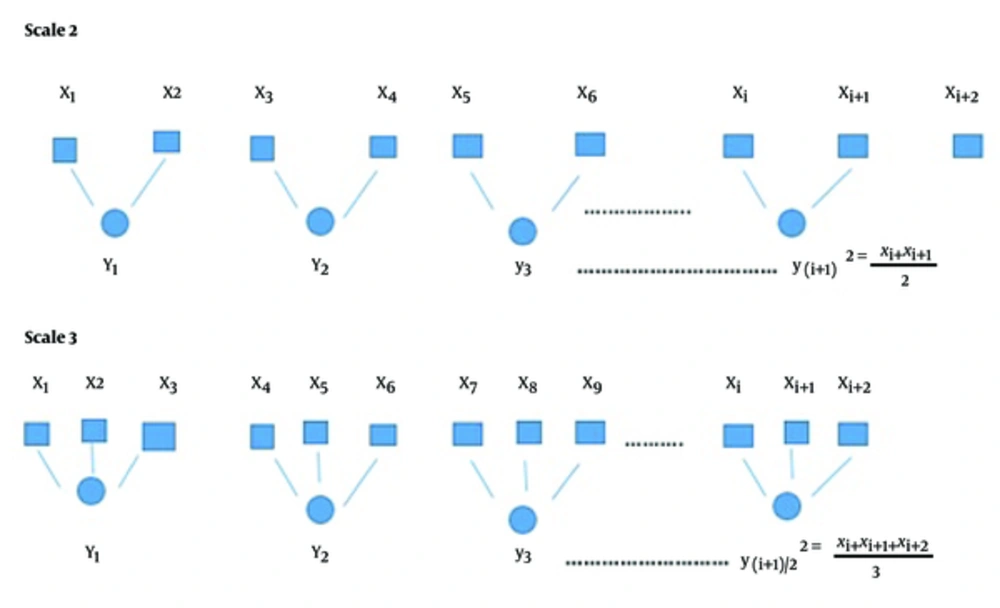
The coarse-grained time series y(τ) could be computed at scale τ as follows

Where coarse-grained is developed in a non-overlapping window of length τ and data points in each window are averaged as shown in Figure 1 below.
2.4. Wavelet Entropy
In signal processing applications, entropy is commonly used for analysis of nonlinear time series data. Commonly-used entropy methods (21) include Shannon, Log Energy, Threshold, Sure, and Norm etc. Shannon entropy (22) was employed to measure the complexity of signal to wavelet coefficients generated by WPT, where larger values show a high uncertainty process and therefore, higher complexity. Wavelet entropy was used by a previous study (23), which provided useful information to measure the underlying dynamical process associated with the signal. The entropy ‘E’ must be an additive information cost function such that E(0) = 0 and.

2.5. Shannon Entropy
Shannon entropy (24) was first proposed in 1948 named after Claude Shannon. Since then, it has become the most extensively applied modality in the information sciences. Shannon entropy is a measure of the uncertainty associated with a random variable. Specifically, Shannon entropy quantifies the expected value of the information contained in a message. The Shannon entropy of a random variable X could be defined as follow:


Where Pi is defined in Equation (10) (10) with xi indicating the ith possible value of X out of n symbols, and Pi denoting the possibility of X = xi.
2.5.1. Wavelet Norm Entropy
Wavelet Norm entropy (25) is defined as:

Where p is the power and must be 1 << P < 2 the terminal node signal and (Si) i the waveform of terminal.
2.6. Statistical Analysis
The significance analysis was performed using non-parametric procedures based on no or few assumptions about shape and parameters. For different analysis, type’s different non-parametric test can be applied e.g. for two dependent variables sample Wilcoxon signed-rank test is applied, and if data contains more than two independent samples, then Kruskal-Wallis test is used to estimate the degree of association, finally between two quantitative variables, Spearman’s rank correlation procedure can be used.
In this study, to distinguish healthy subjects from ictal and interictal signals, the Wilcoxon rank-sum test was applied. It is valid for any type of data normal or not and this test is much more sensitive to outliers as compared to sample t-test. Wilcoxon rank-sum test is based on ranking of nf + nnf observations of a combined sample. Each sample from observation has a rank; the smallest has a rank of one, second smallest has a rank of two and so on. This test is basically sum of all the ranks of the observation from one of the samples. P values are computed from the Wilcoxon rank-sum test, which is the gold standard for measuring significance. The statistical significance allows distinguishing of these different conditions at multiple temporal scales (Table 1).
| Significance | O vs. S | Z vs. S | O vs. F | O vs. N | Z vs. N | Z vs. F |
|---|---|---|---|---|---|---|
| MSE | ||||||
| P value | 1.28E - 34 | 3.08E - 30 | 3.56E - 34 | 3.26E - 34 | 4.49E - 32 | 4.46E - 33 |
| Scale | 3 | 1 | 3 | 5 | 3 | 3 |
| Range | 1 - 25 | 1 - 25 | 1 - 25 | 1 - 25 | 1 - 25 | 1 - 10 |
| Wavelet Entropy (Shannon) | ||||||
| P value | 2.72E - 34 | 1.21E - 32 | 2.82E - 7 | 1.10E - 5 | 1.40E - 4 | 1.68E - 6 |
| Scale | 6 | 2 | 16 | 19 | 15 | 12 |
| Range | 1 - 25 | 1 - 25 | 7 - 25 | 9 - 25 | 1 - 25 | 1 - 25 |
| Wavelet Entropy (Sure,3) | ||||||
| P value | 7.20E - 28 | 2.44E - 28 | 1.05E - 3 | 7.55E - 5 | 1.00E - 4 | 1.97E - 4 |
| Scale | 2 | 1 | 1 | 2 | 14 | 23 |
| Range | 1 - 25 | 1 - 25 | 1 - 5 | 1 - 6 | 1 - 25 | 1 - 25 |
| Wavelet Entropy (Norm,1.1) | ||||||
| P value | 3.46E - 34 | 2.56E - 34 | 2.41E - 3 | 1.06E - 4 | 1.83E - 7 | 2.35E - 8 |
| Scale | 7 | 5 | 1 and 19 | 1 | 14 | 12 |
| Range | 1 - 25 | 1 - 25 | 1 - 4 and 12 - 25 | 1 - 5 and 11 - 25 | 1 - 25 | 1 - 25 |
aHere ‘Range’ denotes the scale range where the subjects depict the significance values in this range of scale.
2.7. ROC Analysis
The ROC is plotted against the true positive rate (TPR) i.e. sensitivity and false positive rate (FPR), specifying values of healthy and epileptic seizure subjects. The mean feature values for healthy subjects are classified as 1 and for epileptic subjects as 0, similarly, healthy and focal, healthy and non-focal signals are computed. These vectors are then passed the ROC function, developed in Matlab 2015a, which plots each sample value against specificity and sensitivity values. The multi ROC function was developed to visualize the separation of different methods. The ROC is a standard way to classify the performance and visualize the behaviour of a diagnostic system. The TPR is plotted against the y-axis and FPR is plotted against the x-axis. The area under the curve (AUC) shows the portion of a square unit. Its value lies between 0 and 1. An AUC of > 0.5 shows the separation. A higher AUC shows a better diagnostic system. Correct positive cases divided by the total number of positive cases are represented by TPR, while negative cases, predicted as positive divided by the total number of negative cases, are represented by FPR.
3. Results
In this study, the complexity based method i.e. sample entropy and wavelet entropies were computed at multiple temporal scales to distinguish healthy subjects from those with epileptic seizure and non-epileptic seizure subjects. The healthy subjects included both eye closed and eye open conditions, whereas epileptic patients were further divided to two categories i.e. seizures (ictal interval) and without seizure (interictal interval). The interictal intervals were further divided to focal and non-focal signals. The recordings from healthy subjects are taken from extracranial surface while that of ictal and interictal are taken from the intracranial surface. There were 100 EEG channels in each subject sampled at 174 Hz, recorded for 24 seconds. Area of the brain which may generate seizures is termed the epileptogenic zone (EZ); intracranial recordings are the best method to describe EZ. Study of EZ also indicates the area of the cortex, which is responsible for inter-ictal spikes (IIS). The epileptogenic zone is not any static part but is a dynamic part of the brain, which causes an epileptic seizure in children’s focal epilepsy, starting from the occipital region and then migrating to the temporal region and finally disappear. As the epileptogenic zone has degraded due to structural dysfunction, its complexity is also degraded. Moreover, in this study, focal signals are those, which consist of intracranial, inter ictal recording from hippocampal, and epileptic zones. These are the regions that are indispensable for the generation of an epileptic seizure. Likewise, non-focal signals are recorded from a non-epileptogenic brain using intracranial recordings. These signals are more complex; they are either not involved in epileptic activity or contain less information about epileptic activity so their fractal analysis reveals higher mean and SD.
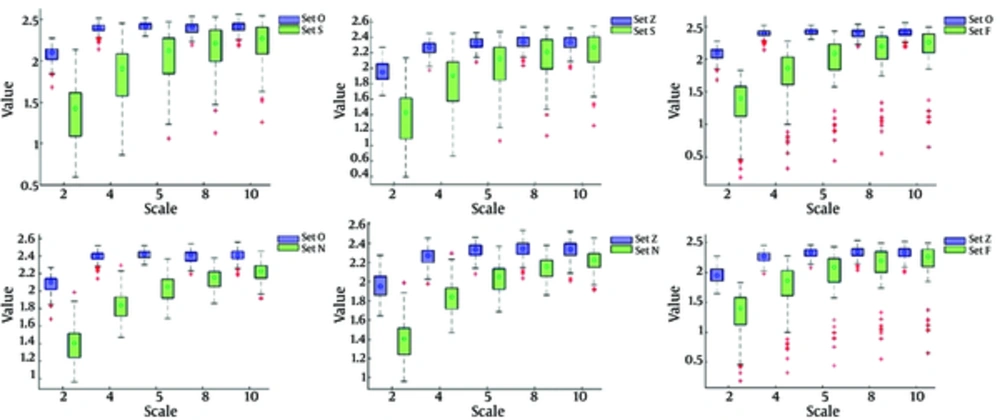
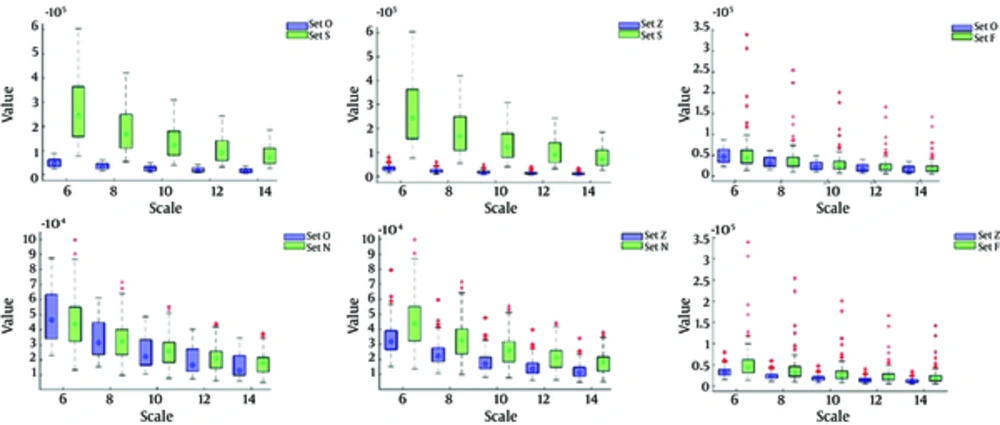
In Figures 2 and 3, the shape and spread of MSE and Wavelet norm values for healthy subjects (Set O, Set Z), epileptic subjects i.e. ictal interval (Set S), non-epileptic subjects i.e. interictal interval with focal subjects (Set F) and Non-focal subject (Set N) is presented using a boxplot at various temporal scales. The boxplot is a useful way to visualize the range, medians value, normality, and skewness of distribution. The median values of MSE and Wavelet norm derived from the time series of all five groups increased at smaller scales and then after reaching a maximum value, gradually decreased with an increase in temporal scales. It was also observed that smaller MSE values were found at smaller scales where optimal significance values are depicted as shown in Table 1 i.e. MSE median values are increased with an increase of scales. While in case of Wavelet norm, the minimum mean entropy values are found at higher scales where the optimal significance values are observed i.e. the median Wavelet norm values decreased with an increase of scale.
The single circle inside each box is the median MSE value at a specified scale. The edges of the box represent 25th and 75th percentile. Overall, 50% of subjects in a group lie within the box and the remaining 50% of subjects lie between the box and whiskers, with some exceptions called outliers. The outliers are the MSE values represented by (+) that lie outside the boundaries of whiskers.
The single circle inside each box is the median MSE value at a specified scale. The edges of the box represent 25th and 75th percentile. Overall 50% of subjects in a group lie within the box and the remaining 50% of subjects lie between the box and whiskers, with some exceptions called outliers. The outliers are the MSE values represented by (+) that lie outside the boundaries of whiskers.
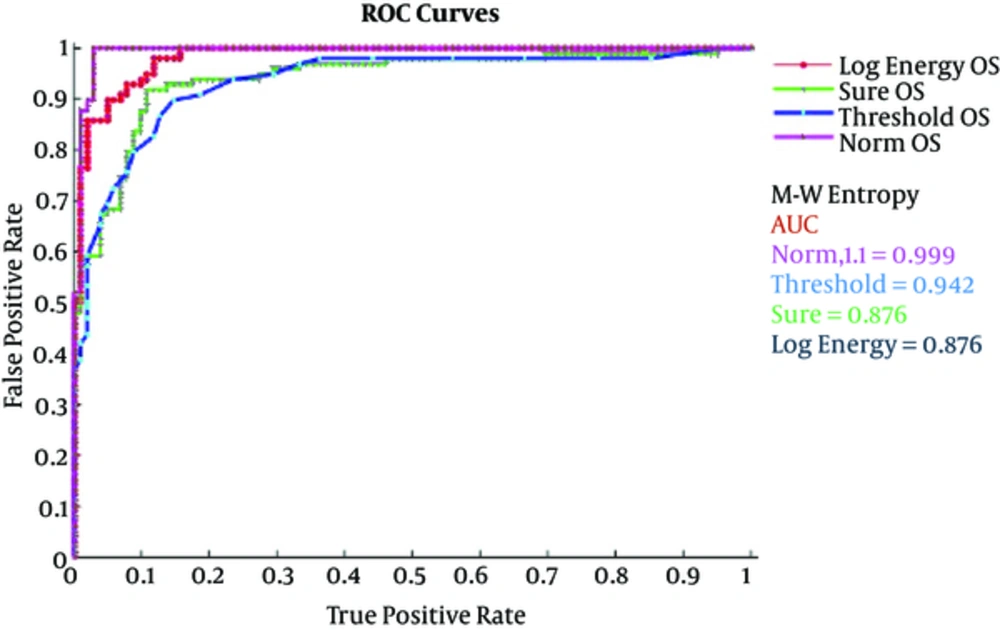
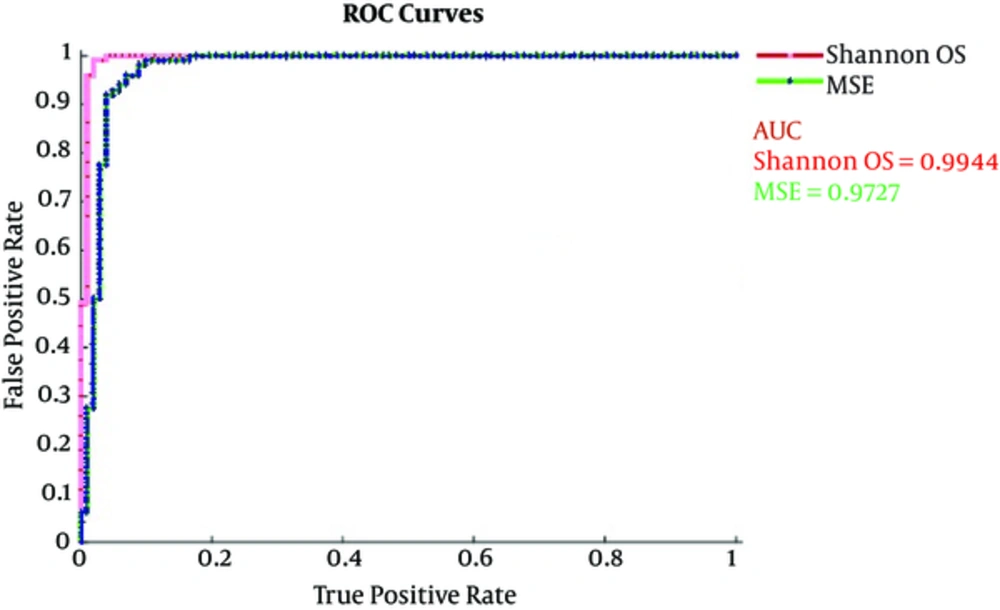
A receiver operating characteristics (ROC) graph is a technique used to visualize, organize, and select classifiers based on their performance. The ROC is used in signal detection and exhibits tradeoff between hit rate and false alarm rate of classifiers (26, 27). Besides, the medical decision making community has an extensive literature on the use of ROC graphs for diagnostic testing (27, 28) and have brought ROC curves to the attention of the wider public with their scientific American article. The area under the curve (AUC) values discriminate healthy subjects eye open set with seizure (Set S) using MSE and wavelet entropy (Shannon, Log Energy, Threshold, Sure and Norm). The AUC obtained ranges from 0.876 to 0.999 in all cases. All the methods provide the highest value of AUC denoting extremely significant results to distinguish healthy and epileptic subjects (with and without seizures). The highest AUC value was obtained using Wentropy (‘Norm’, 1.1) i.e. AUC = 0.999, whereas MSE and Wentropy (Shannon) also give the second highest, AUC = 0.9727 and AUC = 0.994, respectively. The statistical comparisons show that accuracy differences are extremely significant (P < 0.0001). To quantify the diagnostic accuracy of a test, ROC plot AUC is the most conveniently used global tool. The ROC graph (29) is a technique used to visualize, organize, and select classifiers based on their performance and have been used for a long time in the signal detection theory to depict the trade-off between false alarm rates and hit rate of classifiers.
In Figure 4, log energy, sure, threshold and norm, and wavelet entropies are presented for comparing healthy and epileptic seizure subjects and Figure 5 distinguishes these groups using wavelet Shannon and MSE at scales where optimal significance results are obtained. The results indicated that norm wavelet entropy provided the highest degree of separation with AUC = 0.999, followed by wavelet Shannon (AUC = 0.994), MSE (AUC = 0.972), Wavelet threshold (AUC = 0.942), sure (AUC = 0.876) and log energy (AUC = 0.876) for distinguishing healthy and epileptic subjects.
In this paper, MSE and Wentropy methods are applied to study and detect the EEG epileptic seizures and to distinguish healthy and epileptic subjects with both interictal and ictal regions. The datasets (30) comprised of sets O, Z, F, N and S. The comparison was made between healthy set O (Eye open) and epileptic set S (ictal) subject, healthy set Z (Eye closed) and epileptic set S (ictal) subjects, healthy set O (Eye open) and set F focal from interictal subject, healthy set O (Eye open) and set N non-focal from interictal subjects, healthy set Z (Eye close) and set F focal from interictal subjects, healthy set Z (Eye close) and set N non-focal from interictal subjects.
Entropy-based techniques are used to measure the degree of randomness in a time series (10). The SE and AE were used and pointed out that there is no straight forward relationship between regularity and entropy based metrics and MSE curves, which are used to compare the relative complexity of the normalized time series. The entropy values for time series derived from healthy subjects using both eyes open and closed are higher than the epileptic interictal and ictal subjects. The entropy values from healthy subjects increased on a small time scale and then stabilized to relatively constant values while the entropy values derived for the subjects with epileptic seizures and interictal and ictal decreased on smaller scales and then gradually increased. Moreover, MSE at smaller scale entropy values are smaller and increase slightly up to scale 10, however from scale 11 to 25, it remains almost constant, while using Wentropy, the entropy values monotonically decrease for smaller scales and remain constant at higher scales.
4. Discussion
Epilepsy is the most chronic common neurological disorder, for which there is a prevalence of sudden unexpected death including unwitnessed, unexpected, and non-traumatic death in patients with or without evidence of epileptic seizures. Due to this disorder, over 50 million deaths occur because of epileptic seizures. Epilepsy is the second major disorder after stroke. The epileptic seizure signals exhibit highly complex nature of data with nonlinearity and non-stationarity properties. Thus, this study emphasizes on the novel complexity-based measures and wavelet entropy methods at multiple temporal scales to quantify the dynamics and detect epileptic seizures. The complexity was computed for both ictal, interictal, and healthy subjects.
The epileptic animals had lower entropy values (31, 32) in their EEG signals, shown previously in case of interictal states to pathological and diseased biological systems (30, 31, 33-38). Lower entropy values also reveal that the signal has reduced complexity and previous findings also show that the brain was reflected due to abnormal behaviour in the rats (12, 20, 24, 32, 38, 39). In clinical context, it could be expected that this in coordination could be reflected in both psychiatric and cognitive dysfunction as observed in patients with MTLE (40, 41). Medial temporal lobe epilepsy (MTLE) is commonly recognized due to psychiatric and cognitive comorbidities and clinical factors whose quality of life impact exceeds the seizures themselves (41-43).
Organic etiology for these psychiatric symptoms seem likely, and there are several results that suggest ongoing interictal brain abnormalities in the epileptic brain (42). This apparent association between behavioural and psychiatric abnormalities and cognitive disorder in epilepsy complements the growing realization that cognitive deficits, which may be fundamental in schizophrenia (44, 45).
The entropy was measured for control animals and epileptic animals for individual channels and showed that control animals had larger entropy values than the epileptic animals, also consistent with previous studies that entropy values are reduced for biological signals associated with death and aging (17, 30, 31, 33-36).
Table 1 shows the MSE profile analysis where healthy subject set O (Eye open) and epileptic ictal subjects depict highly significant results at all time scales 1 to 25. However, the significance level monotonically decreases downward. The highest significance value between set O and S was obtained in scale 3, while scale 1 to 6 also gave extreme significant results to distinguish subject O and S. Similarly, the healthy subject Z (Eye close) and epileptic ictal subject S using MSE also gave significant results from scales 1 to 17, whereas scales 1 to 5 showed extremely significant results and scales 6 to 17 also gave significant results to discriminate healthy Z and epileptic S subjects. Moreover, healthy subjects in set O (Eye open) and epileptic subjects (Focal interictal set F) also provided almost significant results at all time scales yet extreme significance levels were attained at time scale 1 to 6 while scale 3 also gave the highest significance value for distinguishing Z and F sets. Likewise, healthy subject O (Eye open) and epileptic (interictal non-focal N set) also provided significant results at all time scales yet extreme significance level was attained at scale 1 to 12, where scale 4 gave the highest significance value. Finally, healthy subject Z (Eye close) and epileptic (Interictal Focal F and Interictal no-focal N) gave significant values up to scale 10 only. Therefore, using the MSE profile it was observed that scale 1 to 6 distinguished healthy and epileptic subjects in all the conditions with extreme significance level and scale 3 and 4 in most cases gave the highest significant P value. Furthermore, in all cases, the significance level decreased monotonically where, healthy subject Z (Eye close) with epileptic subjects did not provide significance value to distinguish healthy and epileptic subjects at all time scales.
Previous studies from heart rate variability also revealed that as entropy is a measure of regularity (orderliness), the higher the amplitude of the respiratory modulation, the lower the entropy values tend to be. During the coarse-grained process, the respirator-related heart rate oscillations were filtered out so on larger time scales, healthy subjects tend to be more irregular and are therefore assigned higher entropy values. Epileptic seizure detection and prediction methods have become increasingly valuable, which warn the patients at an early stage before the seizure may occur. Moreover, neurologists and medical staff could further perform behavioural testing to further assess which function may be impaired because of epileptic seizure and help them localize the source of epileptic seizure activity. Various methods have been used to predict and detect epileptic seizure activity, including frequency-based methods (46), time-domain analysis (47), intelligent approaches (48), nonlinear dynamics and chaos (49), and methods of delays (50). Additionally, to analyse the epileptic EEG recordings, several linear (51) and nonlinear methods (52) as well as multi-way array models (53) have been used to localize the seizure origin and further understand the complex structure of an epileptic seizure. The results indicate that complexity based methods at multiple spatiotemporal scales could also be the most powerful tools to analyse the nonlinear dynamics in EEG signals to distinguish healthy subjects with epileptic subjects (including both with seizures and without seizure intervals) as employed in heart rate variability, gait signals, and other physiological signals.
4.1. Conclusion
Epilepsy is the most widespread neurological disorder that has occurred due to persistent neurological disorder in the brain. Due to the complex nature of EEG signals with epilepsy, the diagnosis of epilepsy becomes a difficult task and requires observations of the patient from EEG and gathering additional clinical information. The present study aimed at distinguishing healthy subjects (O eye open and Z eye close conditions) with epileptic subjects (S seizures ictal state, F and N seizures free focal, and non-focal interictal states) based on entropy-based methods. Furthermore, MSE and Wentropy methods reveal that healthy subjects with both eyes opened and closed show higher complexity than epileptic subjects, including both ictal and interictal subjects. Moreover, complexity of interictal subjects was also higher than ictal subjects. Thus, regarding complexity, the following trend was observed: healthy subjects> interictal subjects > ictal subjects. This shows that subjects during seizures lose their structural and functional components resulting in a decrease in complexity. The results are also consistent with previous studies indicating that complexity of healthy subjects is greater than the complexity of pathological subjects. Statistical significant results were obtained in most of the scales, however, scale 1 to 6 gave extremely significant results and significance level decreases monotonically. The highest AUC separation was obtained using Wentropy (‘norm’, 1.1) with AUC = 0.999 and MSE and Wentropy (Shannon) also gave AUC = 0.9727 and AUC = 0.994, respectively.
