


1. Background
Malaria is an infectious disease caused by one of the five parasitic protozoan species from genus Plasmodium, such as Plasmodium falciparum (tropical malaria), Plasmodium vivax (tertian malaria), Plasmodium malariae (quartan malaria), Plasmodium ovale (ovale malaria), or Plasmodium knowlesi (1, 2). Plasmodium has a complex life cycle that includes asexual and sexual phases. Parasitemia can indicate the onset and severity of malaria symptoms. Plasmodium vivax tends to infect the reticulocytes, resulting in a lower parasitemia level and more severe symptoms (3). Parasites’ stages of life alter the pathophysiology of malaria, which causes changes in numerous organ system (e.g., the symptoms of fever in the rupture of schizont or anemic condition due to hemolysis and splenic clearance) (3). Studies have revealed that controlling and eliminating Plasmodium vivax, compared to other Plasmodium species, are more challenging. Plasmodium vivax is circulated in the lower peripheral parasite density, while the species is transmissible through mosquitoes as the vector (4). Numerous studies have explored Plasmodium falciparum which is the deadliest species of Plasmodium. The infection due to Plasmodium vivax, on the other hand, has not received enough research attention.
Infection has always been linked to poor nutritional status, where poor nutritional status is the risk factors for clinical complications in malaria. Malnutrition and micronutrients deficiency cause immune dysfunction and worsen the infection by affecting the innate and adaptive immune system, as well as by disturbing thymus activity, cytokine production, T-cells responses, macrophages activation, and IgA and IgG antibodies responses (5, 6). Globally, more than half of the deaths caused by malaria are related to malnutrition. Deficiency in some micronutrients, such as vitamin A, zinc, and iron play a critical role on malaria mortality (7).
Malnutrition causes thymic and other lymphoid tissues to atrophy, lowers B-cells, and complements activation, interfering with the innate immune defense mechanism. Severely malnourished children experience severe thymic athropy (8), whose mechanism has not been fully understood. However, thymic athropy is caused by massive thymocyte death or reduced intrarthymic cell proliferaton (9). Malnutrition may interfere with the adaptive and innate immune system during malaria infection. Innate immune system limits the parasite density, while the adaptive system acts to clear the parasites (10). Moreover, it interferes the body’s ability to clear the infection and results in a higher prevalence of infection or more severe disease condition (11).
2. Objectives
The present study, therefore, aimed to examine the association between nutritional status and parasite density in children with Plasmodium vivax malaria, particularly in Kualuh Leidong, Labuhan Batu Utara regency, North Sumatra, Indonesia. This location was selected due to the high prevalence (22.1%) of malnutrition and poor nutrition in toddlers (12). Moreover, the location had been reported to have the highest annual parasite incidence (API) in North Sumatra in 2018 (13).
3. Methods
This cross-sectional study, conducted in Kualuh Leidong, Labuhan Batu Utara regency, North Sumatra, Indonesia, from October 2019 to January 2020, examined the association between nutritional status and parasite density in children with vivax malaria. Research subjects were pediatric patients aged 2 - 18 years who attended the public health center (Puskesmas) with a complaint of fever (> 37.5°C) during the studied period. The diagnosis was made by performing direct microscopic examination. Blood samples were collected from research subjects presented with fever for thin and thick blood smears, and then the blood smears were stained with a 3% Giemsa solution for microscopic examination (14). Thick blood smear detected the presence of parasites, while thin blood smear determined parasite density and quantity. The number of parasite per µL blood was calculated based on the amount of leukocytes in the thick blood smear (standard value 8,000/µL blood). A licensed parasitologist counted and confirmed parasite density and species. The assessment result was presented in a case report form. The parasite density was calculated in parasites/µL and classified as low density (< 100 parasites/µL), moderate density (100 - 249 parasites/µL), or high density (≥ 250 parasites/µL) (14, 15). Research subjects with anatomical abnormalities were excluded from the study in order to avoid their possible interference with nutritional status assessment. The sample size for this research was calculated using the following formula (16):
Where:
Zα = alpha standard derivative 0.05 (Zα = 1.96)
Zβ = standard derivative difference 0.2 (Zβ = 0.84)
po = significant vivax malaria parasitemia proportion 47.3% = 0.473
pa-po = significant proportion difference 20 % = 0.20
pa = po + 0.25 = 0.473 + 0.20 = 0.673
Based on the equation above, a minimum of 28 samples were required in the research. Research subjects were selected using consecutive sampling method. A total of 48 research subjects were included in this study.
3.1. Nutritional Status Assessment
Nutritional status (BW/BH) in children was determined based on body weight (BW) to body length or height (BH). The growth charts used as references in this study included the 2006 World Health Organization (WHO) chart for children less than five years old and the 2000 Centers for Disease Control and Prevention (CDC) chart for children over five years old. Nutritional status was determined using the 2006 WHO cut-off Z score for 0 - 5 years of age. The percentage of ideal body weight was based on Waterlow criteria for children over five years old. Obesity was determined based on the 2006 WHO and 2000 CDC charts which were later plotted into the body mass index (BMI) chart (11, 17).
3.2. Parasite Density
Parasite density was determined by assessing the blood smear sample under a microscope (Olympus). The parasite density was calculated in parasites/µL and classified as low density (< 100 parasites/µL), moderate density (100 - 249 parasites/µL), and high density (≥ 250 parasites/µL) (14, 15).
3.3. Research Ethics
After receiving the explanation about patients’ clinical conditions and performing various tests, an informed consent was obtained from the parents or guardians of all subjects for their participation in this study. This study was approved by the Health Research Ethics Committee of the Faculty of Medicine, Universitas Sumatera Utara (No: 779/KEP/USU/2021).
3.4. Data Analysis
Data were analyzed using statistical software SPSS version 23. Nutritional status as the independent variable was proportionally described. Parasite density, as a quantitative continuous variable, was set as the dependent variable. The association between independent variable and dependent variable was examined using a non-parametric test, and P < 0.05 was considered significant. Data set with a normal distribution was assessed using ANOVA test, whereas abnormal distribution data were assessed using Kruskal Wallis test.
4. Results
4.1. Research Subjects Demographic Characteristics
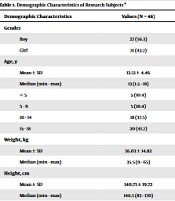
A total of 48 children with vivax malaria were enrolled in the study. The demographic data of the research subjects are presented in Table 1. Over half of the patients were boy (56.3%). The average age of the subjects was 12.51 years old, the youngest subject was 1.5 years old, and the oldest one was 18 years old. The average weight was 36.03 kg and the average height was 140.73 cm. According to results from the nutritional status assessment, 17 (35.4%) subjects had well-nourished status, ten (20.8%) subjects had mild malnutrition, eight (16.7%) subjects were obese, seven (14.6%) subjects had severe malnutrition status, and six (12.5%) subjects were overweight. The median sexual parasite density was 68800 parasites/µL. According to the category of parasite density, all subjects had high sexual parasite density. As for asexual parasite density, the median density was 145 parasites/µL.
| Demographic Characteristics | Values (N = 48) |
|---|---|
| Gender | |
| Boy | 27 (56.3) |
| Girl | 21 (43.7) |
| Age, y | |
| Mean ± SD | 12.51 ± 4.46 |
| Median (min - max) | 13 (1.5 - 18) |
| < 5 | 5 (10.4) |
| 5 - 9 | 5 (10.4) |
| 10 - 14 | 18 (37.5) |
| 15 - 18 | 20 (41.7) |
| Weight, kg | |
| Mean ± SD | 36.03 ± 14.82 |
| Median (min - max) | 35.5 (9 - 65) |
| Height, cm | |
| Mean ± SD | 140.73 ± 19.72 |
| Median (min - max) | 146.5 (83 - 170) |
| Nutritional status | |
| Obesity | 8 (16.7) |
| Overweight | 6 (12.5) |
| Well-nourished | 17 (35.4) |
| Mild malnutrition | 10 (20.8) |
| Severe malnutrition | 7 (14.6) |
| Sexual parasite density | |
| Median (IQR) | 68800 (38.450 - 84640) |
| Low density | 0 (0) |
| Moderate density | 0 (0) |
| High density | 48 (100) |
| Asexual parasite density | |
| Median (IQR) | 145 (120 - 360) |
| Low density | 10 (20.8) |
| Moderate density | 22 (45.8) |
| High density | 16 (33.3) |
Demographic Characteristics of Research Subjects a
4.2. Association Between Nutritional Status and Parasite Density
Table 2 shows the relationship between nutritional status and parasite density of sexual and asexual parasites.
| Nutritional Status | Parasite Density (Parasites/µL) | P-Value | |
|---|---|---|---|
| Mean ± SD | Median (Min - Max) | ||
| Sexual parasite | 0.032 a | ||
| Obesity | 64850 ± 24976.31 | 63060 (37360 - 97240) | |
| Overweight | 90686.67 ± 18059.41 | 88520 (68640 - 112760) | |
| Well-nourished | 65037.65 ± 26593.67 | 72560 (480 - 97640) | |
| Mild malnutrition | 45996 ± 27590.07 | 48480 (5160 - 84680) | |
| Severe malnutrition | 49611.43 ± 37020.09 | 33240 (8520 - 105240) | |
| Asexual parasite | 0.222 b | ||
| Obesity | 421.25 ± 350.12 | 280 (120 - 1040) | |
| Overweight | 213.33 ± 178.29 | 200 (0 - 480) | |
| Well-nourished | 185.88 ± 131.86 | 120 (0 - 520) | |
| Mild malnutrition | 180 ± 225.68 | 120 (0 - 680) | |
| Severe malnutrition | 274.29 ± 209.67 | 280 (0 - 480) | |
Sexual and Asexual Parasite Density Based on Nutritional Status Classification
The highest sexual parasite density (90686.67 parasites/µL) was observed in overweight research subjects. The second and third highest sexual parasite density with an average of 65037.65 parasites/µL and 64850 parasites/µL, respectively, was observed in well-nourished and obese subjects. Subjects with mild malnutrition and severe malnutrition had average sexual parasite density of 45996 parasites/µL and 49611.43 parasites/µL, respectively. There was a significant correlation between nutritional status and sexual parasite density (P = 0.032) from the analysis by using Anova test.
The highest asexual parasite density was observed in obese children with mean density 421.25 parasites/µL, followed by mild malnutrition and overweight children with parasite density of 274.29 and 213.33 parasites/µL, respectively. Kruskal Wallis test showed no significant relationship between nutritional status and asexual parasite density (P = 0.222).
5. Discussion
The characteristics data of the subjects as well as the analysis carried out in this study provided supporting information and arguments over previous research about nutritional status and parasite density in vivax malaria. This study did not highlight the relationship among basic demographic data such as gender, age, and the risk of malaria infection. The report from the WHO demonstrated that males and females faced the same risk of malaria infection (18). As for the age, the WHO stated that children below five years of age had more risk of being infected due to their undeveloped protective immunity against the disease (19). Other factors that may affect the exposure to malaria infection include economy status, level of education, and social or cultural status (20).
In this study, it was found that all subjects with confirmed vivax malaria infection had high sexual parasite density. There was a significant relationship between sexual parasite density and nutritional status. On the other hand, no significant relationship was detected between asexual parasite density and nutritional status. It was determined that the sexual form (gametocyte) was transmitted through the mosquito vector. Gametocyte was the non-replicable form of the blood-stage of the parasites. Higher level of gametocyte production during malaria infection takes longer process for parasitemia to reach pyrogenic level. In vivax malaria infection, gametocyte density is correlated to asexual parasites and white blood cells count (21, 22). A low parasite density brings gametocyte down to the levels that are not detectable (22). Nacher et al. reported that patients infected by Plasmodium vivax gametocytes had higher asexual parasitemia with lower levels of erythrocytes, monocytes, and lymphocytes as well as lower albumin concentration and body temperature, compared to patients with undetected gametocytes. The increase in gametocytes level in patients with low albumin level reflects the important role of nutritional status (23).
Nutrition not only acts as the main energy source, but also serves as gene expression, metabolism, and growth regulators through various mechanisms that allow the cells to adapt to different environmental conditions. Intracellular pathogens, such as parasitic malaria, are exclusively connected to the host, especially related to nutrient stores in the body (24, 25). Mancio-Silva et al. indicated that Plasmodium in blood-stage or active asexual phase responded to hosts’ calories restriction by changing the transcriptome and substantially adjusting its multiplication level. A kinome analysis combined with chemical and genetic findings identified protein kinase (KIN) as an important regulator that affected the nutrition and transcriptional response control on hosts’ nutritional status (26).
Plasmodium has an intrinsic ability to response towards malnourished environment and reduce its replication and, hence, reduce the total parasite load (26). Fevang et al. revealed that parasitemia in Plasmodium falciparum infection was lower in malnourished children, especially those under kwashiorkor condition (27). Another theory suggesting the correlation between nutritional status and immune function is the regulation of leptin. Leptin is a regulatory hormone with various roles in both adaptive and innate immunity. Leptin concentration itself can change due to nutritional changes, where malnutrition causes hypoleptinemia, and obesity causes hyperleptinemia (28).
Our study was the first one carried out in Indonesia to investigate the nutritional status and parasite density both in the sexual and asexual parasite forms. However, our study sample size was considered small, which may have affected the reliability of our results. The factors possibly affecting the parasite density count (e.g., sample taking season) were not included in this study. Moreover, the nutritional status in this study was only assessed based on BMI. Other types of assessment for nutritional status, such as leukocyte count, as well as leptin and albumin levels, may have provided a more detailed explanation about the relationship between nutritional status and parasite density.
5.1. Conclusions
In sum, all subjects had high sexual parasite density level. There was a significant relationship between nutritional status and sexual parasite density. No significant relationship was observed between nutritional status and asexual parasite density.
