


1. Background
The coronavirus disease 2019 (COVID-19) pandemic has severely affected many aspects of human life and, as of October 4, 2023, has resulted in more than six million confirmed deaths globally (1). Coronavirus disease 2019 has posed significant challenges to clinicians, as it mimics various infections and medical conditions, which may contribute to changes in patterns of antibiotic prescription and resistance (2, 3).
Antimicrobial resistance (AMR), also known as the "silent pandemic", was a serious public health issue even before the COVID-19 outbreak. In 2019, AMR directly caused nearly 1.3 million deaths worldwide, making it the third leading cause of mortality after cardiovascular disease and cancer (4). The rate of AMR is steadily increasing, and it is estimated to be responsible for approximately 10 million deaths annually by 2050 if no action is taken (5).
Several studies have indicated an increase in AMR during the COVID-19 pandemic, likely due to increased antibiotic usage and decreased AMR surveillance (6). The lack of efficient treatments for COVID-19, the similarity of its symptoms and radiological findings to bacterial pneumonia, uncertainty regarding the prevalence of bacterial superinfection and coinfection in COVID-19 patients, and the initial recommendations to use azithromycin and hydroxychloroquine in COVID-19 treatment (which were later rejected) all contributed to the overprescription of antibiotics, particularly during the early months of the pandemic (7, 8).
Despite the low prevalence of bacterial coinfections in COVID-19 patients, a significant proportion of them received antibiotics (9, 10). One study reported that while only 7% of hospitalized patients and 14% of intensive care unit (ICU) patients had bacterial co-infections, 72% of them received antibiotics (9, 10).
Several studies have indicated an increase in the prevalence of multidrug-resistant (MDR) bacteria, particularly Klebsiella pneumoniae, during the COVID-19 pandemic (11, 12). The primary source of nosocomial infections is hospital wards, especially ICUs. During the pandemic, increased rates of hospitalization, prolonged ICU stays, crowded hospitals, longer shifts, corticosteroid therapy, and prolonged use of personal protective equipment (PPE) without changing it during shifts due to scarcity have all contributed to the increased transmission of MDR pathogens (13-15). According to a report from the Centers for Disease Control and Prevention (CDC), the rate of both hospital-acquired resistant infections and deaths increased by 15% between 2019 and 2020 (12).
2. Objectives
Data regarding the relationship between AMR and COVID-19 are limited and inconclusive. Therefore, we conducted the present study to investigate the pattern of antibiotic resistance before, during, and after the nine waves of the pandemic among cancer patients in the hematology ward of Taleqani Hospital, Tehran, Iran.
3. Methods
3.1. Clinical Samples
This retrospective cross-sectional study was conducted at Taleqani Hospital, Tehran, Iran, using a census sampling technique. Data from laboratory records of cancer patients in the hematology ward from January 2018 to July 2023 were analyzed. Clinical specimens from urine, stool, cerebrospinal fluid, ascites, pleural fluid, oropharynx, blood, synovial fluid, and other clinical samples (e.g., wound samples) from cancer patients hospitalized in the hematology ward were included. Exclusion criteria were as follows: Samples obtained from patients with polymicrobial infections and multiple samples from a single patient. All specimens were sent to the central laboratory of the hospital.
3.2. Sample Identification
To identify different species of bacteria, all samples were processed using standard microbiological protocols. Standard biochemical methods were applied to detect isolates of Escherichia coli, K. pneumoniae, and Acinetobacter baumannii, as well as Candida spp., Staphylococcusepidermidis, Staphylococcusaureus, Proteus vulgaris, Enterococcus spp., Citrobacter freundii, K. oxytoca, K. aerogenes, Citrobacter koseri, Neisseriameningitidis, S.saprophyticus, P. mirabilis, Enterobactercloacae, anaerobic pathogens, and others. The obtained samples were cultured on blood agar (Merck) and MacConkey agar (Merck) media and incubated for 24 hours.
3.3. Antimicrobial Susceptibility Testing
The antibiotic agents tested in the panel strains included ampicillin, ampicillin-sulbactam, amikacin, piperacillin, piperacillin-tazobactam, ciprofloxacin, cefazolin, cefepime, ceftriaxone, colistin, cefoxitin, erythromycin, cefotaxime, clindamycin, ceftazidime, co-amoxiclav, imipenem, meropenem, levofloxacin, gentamicin, linezolid, co-trimoxazole, nitrofurantoin, nalidixic acid, oxacillin, vancomycin, trimethoprim, and penicillin. The classification of strains as resistant, intermediate, or susceptible was based on the Clinical and Laboratory Standards Institute (CLSI) guidelines (16).
3.4. Statistical Analysis
The data were analyzed using SPSS software, version 19. Frequency (percentage) was used to illustrate the qualitative variables. The normal distribution of the variables was tested using the Kolmogorov–Smirnov test. The mean ± standard deviation (SD) was calculated for the quantitative variables. The chi-square or Fisher exact test was used to compare qualitative variables. The microbial antibiotic resistance patterns for each agent were compared across different years. A P-value of less than 0.05 was considered statistically significant, with a 95% confidence interval (CI).
3.5. Ethics
The current study was approved by the Ethical Committee of Shahid Beheshti University of Medical Sciences (IR.SBMU.RETECH.REC.1402.355).
4. Results
4.1. Isolates
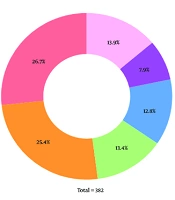
In the present study, 382 isolates were obtained from 186 (48.7%) males and 196 (51.3%) females admitted to the hematology ward at Taleqani Hospital. Among these specimens, 190 (49.7%) were from blood, 134 (35.1%) from urine, 10 (2.6%) from ascites, 9 (2.4%) from the oropharynx, 3 (0.8%) from pleural fluid, 1 (0.3%) from stool, 1 (0.3%) from cerebrospinal fluid, 1 (0.3%) from synovial fluid, and 33 (8.6%) were from other samples. Among the 382 clinical isolates, 102 were E. coli, 97 were K. pneumoniae, 51 were P. aeruginosa, 49 were coagulase-negative Staphylococcus, 30 were S. aureus, and 53 were other species (Figure 1). Other species included anaerobic bacteria, S.epidermidis, nonhemolytic Streptococcus, P. vulgaris, Enterococcus, C. freundii, K. oxytoca, K. aerogenes, C. koseri, group D Streptococcus, N. meningitides, S.saprophyticus, P. mirabilis, Candida spp., A. baumannii, and E. cloacae.

Distribution of clinical isolates
4.2. Antibiogram Results by Agar Disc Diffusion Method
The antibiotic susceptibility patterns of all strains are shown in Table 1. The highest reported resistance of E. coli was to cefazolin (47.8%) and co-amoxiclav (45.9%). For K. pneumoniae, the highest resistance rate was to co-amoxiclav (37.2%) and amikacin (31.8%). For P. aeruginosa, the highest resistance rate was to nitrofurantoin (66.7%) and amikacin (51%). Among S. aureus strains, the highest resistance rate was to ampicillin (63.3%) and cefazolin (34.5%). Finally, for coagulase-negative Staphylococcus, the highest resistance was to levofloxacin (100%) and penicillin (52.3%).
| Variables | Microorganism | |||||
|---|---|---|---|---|---|---|
| Coagulase-Negative Staphylococcus | Pseudomonas aeruginosa | Klebsiella pneumoniae | Staphylococcus aureus | Escherichia coli | Others | |
| Ampicillin | ||||||
| S | 4 (8.2) | 3 (10.0) | 8 (11.9) | 4 (13.3) | 8 (11.3) | 12 (24.5) |
| I | 10 (20.4) | 16 (53.3) | 42 (62.7) | 7 (23.3) | 41 (57.7) | 20 (40.8) |
| R | 35 (71.4) | 11 (36.7) | 17 (25.4) | 19 (63.3) | 22 (31) | 17 (34.7) |
| Amikacin | ||||||
| S | 32 (69.6) | 22 (43.1) | 49 (55.7) | 4 (44.4) | 58 (68.2) | 17 (47.2) |
| I | 7 (15.2) | 3 (5.9) | 11 (12.5) | 3 (33.3) | 14 (16.5) | 4 (11.1) |
| R | 7 (15.2) | 26 (51) | 28 (31.8) | 2 (22.2) | 13 (15.3) | 15 (41.7) |
| Cefazolin | ||||||
| S | 2 (7.7) | 2 (5.7) | 11 (14.1) | 4 (13.8) | 21 (22.8) | 3 (10.3) |
| I | 17 (65.4) | 16 (45.7) | 47 (60.3) | 15 (51.7) | 27 (29.3) | 13 (44.8) |
| R | 7 (26.9) | 17 (48.6) | 20 (25.6) | 10 (34.5) | 44 (47.8) | 13 (44.8) |
| Cefepime | ||||||
| S | 8 (25.8) | 14 (28.6) | 21 (24.1) | 11 (40.7) | 30 (44.8) | 14 (33.3) |
| I | 19 (61.3) | 33 (67.3) | 62 (71.3) | 16 (59.3) | 30 (44.8) | 25 (59.5) |
| R | 4 (12.9) | 2 (4.1) | 4 (4.6) | 0 (0) | 7 (10.4) | 3 (7.1) |
| Cefoxitin | ||||||
| S | 11 (28.9) | 2 (10) | 6 (14) | 12 (40) | 13 (24.5) | 7 (22.6) |
| I | 21 (55.3) | 11 (55) | 33 (76.7) | 14 (46.7) | 33 (62.3) | 19 (61.3) |
| R | 6 (15.8) | 7 (35) | 4 (9.3) | 4 (13.3) | 7 (13.2) | 5 (16.1) |
| Ceftazidime | ||||||
| S | 6 (20.0) | 14 (28) | 21 (23.9) | 6 (25) | 28 (39.4) | 9 (25) |
| I | 8 (26.7) | 34 (68) | 63 (71.6) | 13 (45.2) | 37 (52.1) | 20 (55.6) |
| R | 16 (53.3) | 2 (4) | 4 (4.5) | 5 (20.8) | 6 (8.5) | 7 (19.4) |
| Ceftriaxone | ||||||
| S | 3 (11.5) | 5 (10.2) | 14 (17.5) | 5 (17.2) | 16 (23.5) | 7 (17.5) |
| I | 12 (46.2) | 42 (85.7) | 53 (66.3) | 14 (48.3) | 35 (51.5) | 21 (52.5) |
| R | 11 (42.3) | 2 (4.1) | 13 (16.3) | 10 (34.5) | 17 (25) | 12 (30) |
| Ciprofloxacin | ||||||
| S | 8 (17.4) | 30 (58.8) | 23 (24.7) | 5 (17.2) | 34 (34) | 10 (22.2) |
| I | 16 (34.8) | 20 (39.2) | 60 (64.5) | 17 (58.6) | 51 (51) | 28 (62.2) |
| R | 22 (47.8) | 1 (2.0) | 10 (10.8) | 7 (24.1) | 15 (15) | 7 (15.6) |
| Clindamycin | ||||||
| S | 11 (36.7) | 0 (0.0) | 0 (0.0) | 2 (5.4) | - | 1 (20) |
| I | 8 (26.7) | 0 (0.0) | 0 (0.0) | 7 (53.8) | - | 2 (40) |
| R | 11 (36.7) | 0 (0.0) | 0 (0.0) | 4 (30.8) | - | 2 (40) |
| Co-Amoxiclav | ||||||
| S | 4 (8.2) | 6 (12.8) | 7 (8.1) | 2 (6.7) | 10 (13.5) | 4 (9.8) |
| I | 23 (46.9) | 23 (48.9) | 47 (54.7) | 18 (60.0) | 30 (40.5) | 19 (46.3) |
| R | 22 (44.9) | 18 (38.3) | 32 (37.2) | 10 (33.3) | 34 (45.9) | 18 (43.9) |
| Colistin | ||||||
| S | - | 11 (84.6) | 24 (85.7) | 1 (50.0) | 6 (85.7) | 17 (100) |
| I | - | 2 (15.4) | 3 (10.7) | 1 (50.0) | 1 (14.3) | 0 (0) |
| R | - | 0 (0.0) | 1 (3.6) | 0 (0.0) | 0 (0) | 0 (0) |
| Erythromycin | ||||||
| S | 7 (22.6) | - | 1 (100.0) | 1 (5.6) | 0 (0) | 0 (0) |
| I | 17 (54.8) | - | 0 (0.0) | 14 (77.8) | 1 (100) | 3 (75) |
| R | 7 (22.6) | - | 0 (0.0) | 3 (16.7) | 0 (0) | 1 (25) |
| Imipenem | ||||||
| S | 11 (35.5) | 9 (17.6) | 29 (32.2) | 8 (30.8) | 36 (42.9) | 13 (31) |
| I | 17 (54.8) | 21 (41.2) | 41 (45.6) | 17 (65.4) | 23 (27.4) | 29 (69) |
| R | 3 (9.7) | 21 (41.2) | 20 (22.2) | 1 (3.8) | 25 (29.8) | 0 (0) |
| Gentamicin | ||||||
| S | 13 (27.7) | 10 (30.3) | 25 (-) | 15 (51.7) | 38 (50.0) | 15 (41.7) |
| I | 20 (42.6) | 18 (54.5) | 51 (32.9) | 14 (48.3) | 37 (48.7) | 21 (58.3) |
| R | 14 (29.8) | 5 (15.2) | 0 (0) | 0 (0) | 1 (1.3) | 0 (0) |
| Linezolid | ||||||
| S | 35 (77.8) | - | - | 7 (77.8) | - | 9 (100) |
| I | 7 (15.6) | - | - | 2 (22.2) | - | 0 (0) |
| R | 3 (6.7) | - | - | 0 (0.0) | - | 0 (0) |
| Meropenem | ||||||
| S | 6 (21.4) | 3 (7.0) | 13 (16.5) | 8 (27.6) | 20 (25.3) | 4 (9.5) |
| I | 20 (71.4) | 22 (51.2) | 49 (62.0) | 20 (9.0) | 37 (46.8) | 36 (85.7) |
| R | 2 (7.1) | 18 (41.9) | 17 (21.5) | 1 (3.4) | 22 (27.8) | 2 (4.8) |
| Nitrofurantoin | ||||||
| S | 2 (50.0) | 0 (0) | 44 (46.8) | 15 (50) | 72 (72.7) | 12 (66.7) |
| I | 1 (25.0) | 1 (33.3) | 39 (41.5) | 12 (40) | 15 (15.2) | 5 (27.8) |
| R | 1 (25.0) | 2 (66.7) | 11 (11.7) | 3 (10) | 12 (12.1) | 1 (5.6) |
| Oxacilin | ||||||
| S | 6 (35.3) | - | - | 6 (85.7) | - | - |
| I | 8 (47.1) | - | - | 1 (14.3) | - | - |
| R | 3 (17.6) | - | - | 0 (0) | - | - |
| Penicillin | ||||||
| S | 0 (0.0) | - | 0 (0) | 2 (6.9) | - | 2 (22.2) |
| I | 21 (47.7) | - | 1 (100) | 19 (65.5) | - | 6 (66.7) |
| R | 23 (52.3) | - | 0 (0) | 8 (27.6) | - | 1 (11.1) |
| Piperacillin | ||||||
| S | 7 (25.9) | 10 (21.3) | 9 (12.3) | 11 (39.3) | 17 (28.3) | 12 (33.3) |
| I | 14 (51.9) | 24 (51.1) | 55 (75.3) | 14 (50) | 31 (51.7) | 22 (61.1) |
| R | 6 (22.2) | 13 (27.7) | 9 (12.3) | 3 (10.7) | 12 (20) | 2 (5.6) |
| Piperacillin-tazobactam | ||||||
| S | 0 (0.0) | 3 (37.5) | 1 (100) | - | 1 (100) | 1 (100) |
| I | 1 (100.0) | 4 (50) | 0 (0) | - | 0 (0) | 0 (0) |
| R | 0 (0.0) | 1 (12.5) | 0 (0) | - | 0 (0) | 0 (0) |
| Rifampin | ||||||
| S | 17 (70.8) | - | 1 (100) | 17 (77.3) | 1 (100) | 3 (50) |
| I | 6 (25.0) | - | 0 (0) | 5 (22.7) | 0 (0) | 3 (50) |
| R | 1 (4.2) | - | 0 (0) | 0 (0) | 0 (0) | 0 (0) |
| Trimethoprim-sulfamethoxazol | ||||||
| S | 4 (33.3) | - | 1 (8.3) | 2 (40) | 2 (16.7) | 0 (0) |
| I | 7 (58.3) | - | 11 (91.7) | 3 (60) | 10 (83.3) | 7 (100) |
| R | 1 (8.3) | - | 0 (0) | 0 (0) | 0 (0) | 0 (0) |
| Vancomycin | ||||||
| S | 26 (54.2) | - | 1 (100) | 16 (53.3) | 1 (100) | 9 (69.2) |
| I | 11 (22.9) | - | 0 (0) | 10 (33.3) | 0 (0) | 4 (30.8) |
| R | 11 (22.9) | - | 0 (0) | 4 (13.3) | 0 (0) | 0 (0) |
Abbreviations: S, sensitive; I, intermediate; R, resistant.
a Values are expressed as No. (%).
4.3. Results by Year
The number of specimens sent to the laboratory by year is illustrated in Figure 2. The years with the highest number of isolates for coagulase-negative Staphylococcus (n = 17), E. coli (n = 29), P. aeruginosa (n = 19), K. pneumoniae (n = 31), and S. aureus (n = 10) were 2023, 2022, 2021, 2019, and 2021, respectively.
")
Frequency of samples by year (see Appendix 1 for more details)
Antibiotic susceptibility patterns from the years of the pandemic, spanning from January 2018 to July 2023, are presented in Tables 2 - 6 (see Appendix 1 for full results). There were significant differences in resistance to ceftazidime for coagulase-negative Staphylococcus and to amikacin, cefepime, ceftazidime, ciprofloxacin, co-amoxiclav, gentamicin, meropenem, piperacillin, and piperacillin-tazobactam for P. aeruginosa. For K. pneumoniae, significant differences were observed in resistance to amikacin, piperacillin, and ciprofloxacin. For S. aureus, significant differences were observed in resistance to meropenem, gentamicin, erythromycin, and Clindamycin. For E. coli, significant differences were found in resistance to imipenem, amikacin, and cefazolin.
| Variables | Year | P-Value | |||||
|---|---|---|---|---|---|---|---|
| 2018 | 2019 | 2020 | 2021 | 2022 | 2023 | ||
| Amikacin | 0.151 | ||||||
| S | 2 (40.0) | 3 (60.0) | 4 (100.0) | 4 (66.7) | 7 (77.8) | 12 (70.6) | |
| I | 3 (60.0) | 0 (0.0) | 0 (0.0) | 2 (33.3) | 1 (11.1) | 1 (5.9) | |
| R | 0 (0) | 2 (40.0) | 0 (0.0) | 0 (0.0) | 1 (11.1) | 4 (23.5) | |
| Ceftazidime | 0.007 | ||||||
| S | 1 (25.0) | 2 (66.7) | 1 (50.0) | 2 (33.3) | 0 (0.0) | 0 (0.0) | |
| I | 1 (25.0) | 1 (33.3) | 0 (0.0) | 3 (50.0) | 3 (42.9) | 0 (0.0) | |
| R | 2 (50.0) | 0 (0.0) | 1 (50.0) | 1 (16.7) | 4 (57.1) | 8 (100.0) | |
| Clindamycin | 0.016 | ||||||
| S | - | 3 (50.0) | 1 (100.0) | 1 (25.0) | 2 (40.0) | 4 (28.6) | |
| I | - | 1 (16.7) | 0 (0.0) | 3 (75.0) | 3 (60.0) | 1 (7.1) | |
| R | - | 2 (33.3) | 0 (0.0) | 0 (0.0) | 0 (0.0) | 9 (64.3) | |
Abbreviations: S, sensitive; I, intermediate; R, resistant.
a Values are expressed as No. (%).
| Variables | Year | P-Value | |||||
|---|---|---|---|---|---|---|---|
| 2018 | 2019 | 2020 | 2021 | 2022 | 2023 | ||
| Amikacin | 0.001 | ||||||
| S | 0 (0.0) | 3 (33.3) | 3 (30.0) | 13 (68.4) | 3 (50.0) | 0)0.0) | |
| I | 2 (100.0) | 0 (0.0) | 0 (0.0) | 0 (0.0) | 1 (16.7) | 0 (0.0) | |
| R | 0 (0.0) | 6 (66.7) | 7 (70.0) | 6 (31.6) | 2 (33.3) | 5 (100.0) | |
| Cefepime | 0.039 | ||||||
| S | 0 (0.0) | 0 (0.0) | 2 (20.0) | 9 (47.4) | 3 (50.0) | 0 (0.0) | |
| I | 2 (100.0) | 8 (100.0) | 7 (70.0) | 10 (52.6) | 2 (33.3) | 4 (100.0) | |
| R | 0 (0.0) | 0 (0.0) | 1 (10.0) | 0 (0.0) | 1 (16.7) | 0 (0.0) | |
| Ceftazidime | 0.009 | ||||||
| S | 0 (0.0) | 0 (0.0) | 4 (40.0) | 7 (36.8) | 3 (50.0) | 0 (0.0) | |
| I | 2 (100.0) | 8 (100.0) | 6 (60.0) | 12 (63.2) | 1 (16.7) | 5 (100.0) | |
| R | 0 (0.0) | 0 (0.0) | 0 (0.0) | 0 (0.0) | 2 (33.3) | 0 (0.0) | |
| Ciprofloxacin | 0.003 | ||||||
| S | 0 (0.0) | 3 (33.3) | 8 (80.0) | 14 (73.7) | 5 (83.3) | 0 (0.0) | |
| I | 2 (100.0) | 5 (55.6) | 2 (20.0) | 5 (26.3) | 1 (16.7) | 5 (100.0) | |
| R | 0 (0.0) | 1 (11.1) | 0 (0.0) | 0 (0.0) | 0 (0.0) | 0 (0.0) | |
| Co-Amoxiclav | 0.016 | ||||||
| S | 0 (0.0) | 0 (0.0) | 5 (50.0) | 1 (5.3) | 0 (0.0) | 0 (0.0) | |
| I | 2 (100.0) | 6 (66.7) | 4 (40.0) | 6 (31.6) | 3 (75.0) | 2 (66.7) | |
| R | 0 (0.0) | 3 (33.3) | 1 (10.0) | 12 (63.2) | 1 (25.0) | 1 (33.3) | |
| Gentamicin | 0.018 | ||||||
| S | 1 (100.0) | 4 (57.1) | 2 (40.0) | 3 (23.1) | 0 (0.0) | 0 (0.0) | |
| I | 0 (0.0) | 3 (42.9) | 3 (60.0) | 8 (61.5) | 0 (0.0) | 4 (100.0) | |
| R | 0 (0.0) | 0 (0.0) | 0 (0.0) | 2 (15.4) | 3 (100.0) | 0 (0.0) | |
| Meropenem | 0.008 | ||||||
| S | 0 (0.0) | 0 (0.0) | 0 (0.0) | 1 (6.7) | 2 (33.3) | 0 (0.0) | |
| I | 0 (0.0) | 2 (28.6) | 7 (77.8) | 11 (73.3) | 0 (0.0) | 2 (40.0) | |
| R | 1 (100.0) | 5 (71.4) | 2 (22.2) | 3 (20.0) | 4 (66.7) | 3 (60.0) | |
| Piperacillin | 0.037 | ||||||
| S | 0 (0.0) | 0 (0.0) | 0 (0.0) | 6 (31.6) | 3 (50.0) | 1 (33.3) | |
| I | 0 (0.0) | 5 (55.6) | 7 (77.8) | 10 (52.6) | 2 (33.3) | 0 (0.0) | |
| R | 1 (100.0) | 4 (44.4) | 2 (22.2) | 3 (15.8) | 1 (16.7) | 2 (66.7) | |
| Piperacillin-tazobactam | 0.036 | ||||||
| S | - | (0.0)0 | - | - | 2 (100.0) | 1 (20.0) | |
| I | - | 0 (0.0) | - | - | 0 (0.0) | 4 (80.0) | |
| R | - | 1 (100.0) | - | - | 0 (0.0) | 0 (0.0) | |
Abbreviations: S, sensitive; I, intermediate; R, resistant.
a Values are expressed as No. (%).
| Variables | Year | P-Value | |||||
|---|---|---|---|---|---|---|---|
| 2018 | 2019 | 2020 | 2021 | 2022 | 2023 | ||
| Amikacin | < 0.001 | ||||||
| S | 2 (28.6) | 19 (70.4) | 7 (58.3) | 14 (70.0) | 5 (50.0) | 2 (16.7) | |
| I | 5 (71.4) | 2 (7.4) | 1 (8.3) | 1 (5.0) | 2 (20.0) | 0 (0.0) | |
| R | 0 (0.0) | 6 (22.2) | 4 (33.3) | 5 (25.0) | 3 (30.0) | 10 (83.3) | |
| Cefazolin | 0.091 | ||||||
| S | 2 (33.3) | 2 (9.1) | 2 (18.2) | 3 (16.7) | 1 (12.5) | 1 (7.7) | |
| I | 4 (66.7) | 10 (45.5) | 6 (54.5) | 11 (61.1) | 4 (50.0) | 12 (92.3) | |
| R | 0 (0.0) | 10 (45.5) | 3 (27.3) | 4 (22.2) | 3 (37.5) | 0 (0.0) | |
| Ceftriaxone | 0.009 | ||||||
| S | 2 (25.0) | 0 (0.0) | 4 (30.8) | 4 (20.0) | 2 (28.6) | 2 (33.3) | |
| I | 4 (50.0) | 23 (88.5) | 7 (53.8) | 13 (65.0) | 5 (71.4) | 1 (16.7) | |
| R | 2 (25.0) | 3 (11.5) | 2 (15.4) | 3 (15.0) | 0 (0.0) | 3 (50.0) | |
| Ciprofloxacin | 0.152 | ||||||
| S | 2 (28.6) | 7 (23.3) | 5 (38.5) | 4 (19.0) | 4 (40.0) | 1 (8.3) | |
| I | 5 (71.4) | 15 (50.0) | 8 (61.5) | 16 (76.2) | 6 (60.0) | 10 (83.3) | |
| R | 0 (0.0) | 8 (26.7) | 0 (0.0) | 1 (4.8) | 0 (0.0) | 1 (8.3) | |
| Piperacillin | |||||||
| S | 0 (0.0) | 1 (4.5) | 2 (18.2) | 0 (0.0) | 1 (12.5) | 5 (55.6) | 0.006 |
| I | 4 (80.0) | 18 (81.8) | 8 (72.7) | 17 (94.4) | 6 (75.0) | 2 (22.2) | |
| R | 1 (20.0) | 3 (13.6) | 1 (9.1) | 1 (5.6) | 1 (12.5) | 2 (22.2) | |
Abbreviations: S, sensitive; I, intermediate; R, resistant.
a Values are expressed as No. (%).
| Variables | Year | P-Value | |||||
|---|---|---|---|---|---|---|---|
| 2018 | 2019 | 2020 | 2021 | 2022 | 2023 | ||
| Clindamycin | 0.024 | ||||||
| S | - | 0 (0.0) | 0 (0.0) | 1 (20.0) | 0 (0.0) | 1 (20.0) | |
| I | - | 1 (100.0) | 1 (100.0) | 4 (80.0) | 1 (100.0) | 0 (0.0) | |
| R | - | 0 (0.0) | 0 (0.0) | 0 (0.0) | 0 (0.0) | 4 (80.0) | |
| Erythromycin | 0.017 | ||||||
| S | - | 1 (33.3) | 0 (0.0) | 0 (0.0) | 0 (0.0) | 0 (0.0) | |
| I | - | 0 (0.0) | 1 (100.0) | 8 (100.0) | 1 (100.0) | 4 (80.0) | |
| R | - | 2 (66.7) | 0 (0.0) | 0 (0.0) | 0 (0.0) | 1 (20.0) | |
| Gentamicin | 0.031 | ||||||
| S | 1 (100.0) | 1 (16.7) | - | 4 (40.0) | 3 (50.0) | 6 (100.0) | |
| I | 0 (0.0) | 5 (83.3) | - | 6 (60.0) | 3 (50.0) | 0 (0.0) | |
| R | 0 (0.0) | 0 (0.0) | - | 0 (0.0) | 0 (0.0) | 0 (0.0) | |
| Meropenem | 0.020 | ||||||
| S | 1 (100.0) | 0 (0.0) | 0 (0.0) | 6 (60.0) | 1 (20.0) | 0 (0.0) | |
| I | 0 (0.0) | 6 (100.0) | 1 (100.0) | 4 (40.0) | 4 (80.0) | 5 (83.3) | |
| R | 0 (0.0) | 0 (0.0) | 0 (0.0) | 0 (0.0) | 0 (0.0) | 1 (16.7) | |
Abbreviations: S, sensitive; I, intermediate; R, resistant.
a Values are expressed as No. (%).
| Variables | Year | P-Value | |||||
|---|---|---|---|---|---|---|---|
| 2018 | 2019 | 2020 | 2021 | 2022 | 2023 | ||
| Amikacin | 0.008 | ||||||
| S | 0 (0.0) | 3 (50.0) | 6 (54.5) | 17 (73.9) | 22 (78.6) | 10 (76.9) | |
| I | 4 (100.0) | 2 (33.3) | 3 (27.3) | 2 (8.7) | 3 (10.7) | 0 (0.0) | |
| R | 0 (0.0) | 1 (16.7) | 2 (18.2) | 4 (17.4) | 3 (10.7) | 3 (23.1) | |
| Cefazolin | < 0.001 | ||||||
| S | 1 (16.7) | 0 (0.0) | 4 (26.7) | 6 (25.0) | 6 (24.0) | 4 (30.8) | |
| I | 5 (83.3) | 3 (33.3) | 3 (20.0) | 2 (8.3) | 5 (20.0) | 9 (69.2) | |
| R | 0 (0.0) | 6 (66.7) | 8 (53.3) | 16 (66.7) | 14 (56.0) | 0 (0.0) | |
| I | 2 (33.3) | 3 (75.0) | 7 (77.8) | 7 (70.0) | 8 (66.7) | 6 (50.0) | |
| R | 3 (50.0) | 0 (0.0) | 1 (11.1) | 2 (20.0) | 1 (8.3) | 0 (0.0) | |
| Co-amoxiclav | 0.056 | ||||||
| S | 0 (0.0) | 0 (0.0) | 4 (44.4) | 1 (5.9) | 3 (13.0) | 2 (15.4) | |
| I | 3 (75.0) | 4 (50.0) | 5 (55.6) | 7 (41.2) | 8 (34.8) | 3 (23.1) | |
| R | 1 (25.0) | 4 (50.0) | 0 (0.0) | 9 (52.9) | 12 (52.2) | 8 (61.5) | |
| Imipenem | 0.010 | ||||||
| S | 2 (33.3) | 3 (42.9) | 3 (25.0) | 4 (21.1) | 16 (59.3) | 8 (61.5) | |
| I | 2 (33.3) | 1 (14.3) | 5 (41.7) | 6 (31.6) | 9 (33.3) | 0 (0.0) | |
| R | 2 (33.3) | 3 (42.9) | 4 (33.3) | 9 (47.4) | 2 (7.4) | 5 (38.5) | |
Abbreviations: S, sensitive; I, intermediate; R, resistant.
a Values are expressed as No. (%).
5. Discussion
The COVID-19 pandemic has altered the AMR profiles and their clinical effects worldwide. Most of the available studies confirm an increased rate of AMR since the onset of the pandemic, particularly among hospitalized patients (15, 17-19). However, limited data are available regarding post-pandemic AMR, and resistance patterns vary among different species (17, 18). Therefore, there is an urgent need for studies that provide comprehensive data on AMR patterns in this era.
In this study, 382 clinical samples were collected from the hematology ward, with blood (49.7%) and urine (35.1%) cultures being the most common. The most prevalent microorganism isolated was E. coli (26.7%), followed by K. pneumoniae (25.4%). Coagulase-negative Staphylococcus (71.4%) and S. aureus (63.3%) were the most resistant pathogens to ampicillin. P. aeruginosa showed high resistance rates for the majority of the antibiotics surveyed.
Recent studies have shown that the AMR pattern of gram-negative bacteria has significantly changed due to the COVID-19 pandemic (17). Recent evidence reported K. pneumoniae, E. coli, P. aeruginosa, and A. baumannii as the most frequent gram-negative bacteria during the pandemic (20). According to our data, clinical isolates of E. coli were most resistant to cefazolin (47.8%) and co-amoxiclav (45.9%). The highest prevalence of E. coli was observed in 2020 and 2022 (35.3% and 41.4%, respectively). In our study, K. pneumoniae was the second most common species (25.4%), although its frequency has decreased since the pandemic. A pre-pandemic study conducted on 165 clinical isolates in Iran reported that the resistance rate of E. coli isolates to imipenem and meropenem was 10.6% and 19.5%, respectively, which was notably lower than our findings (29.8% and 27.8%, respectively) (21). Another study in northeast Iran examined the trends of gram-negative AMR during the COVID-19 pandemic (2). This study found that 42.7% of E. coli isolates were resistant to imipenem (2). Similarly, our results indicate that the trend of imipenem resistance among E. coli strains significantly peaked during the pandemic.
In a Brazilian study by Porto et al., clinical isolates collected from patients in the ICU were compared between the pre-pandemic (2019) and pandemic (2020) periods (22). The results showed no significant change in the frequency of carbapenem-resistant Enterobacteria, including Klebsiella and E. coli species (22). Similarly, our study found no significant change in the resistance pattern of Klebsiella to carbapenems from 2018 to 2023. However, the resistance profile of E. coli to imipenem (P-value = 0.01) did change. A systematic review reported a decreasing trend in extended-spectrum beta-lactamase (ESBL)-producing E. coli and K. pneumoniae, as well as a decline in carbapenem-resistant E. coli during the pandemic (19). However, the rate of carbapenem-resistant K. pneumoniae increased during this period (19). In a French study by Lemenand et al., it was reported that after the general lockdown in March 2020, among clinical isolates from nursing home residents and primary care patients, the frequency of ESBL-producing E. coli significantly decreased (23). This may be attributed to a lower rate of antibiotic use and infection transmission during the lockdown, which potentially improved antibiotic susceptibility patterns.
In contrast to Lemenand et al. (23), our results show that E. coli isolates exhibited higher rates of resistance to some beta-lactams, such as cefazolin, ceftriaxone, cefepime, and imipenem, during the pandemic years, particularly during the post-lockdown period. These findings may be linked to the varying standards of lockdown measures and different antibiotic use surveillance programs between high-income and non-high-income countries (18, 24).
Moreover, in our study, K. pneumoniae strains showed higher resistance to cefazolin during the pandemic period. However, the resistance trend of K. pneumoniae isolates to ceftriaxone changed significantly, with these isolates becoming more sensitive to ceftriaxone over the pandemic. Another study examined the susceptibility patterns of clinical E. coli samples during the pandemic (September 2019 to March 2020 and March 2020 to September 2020) (25). According to that study, among other gram-negative isolates, the prevalence of E. coli in the second period (25.5%) was significantly lower than in the first period (48%) (25). This study also demonstrated improved susceptibility to all antibiotics, except ampicillin, co-amoxiclav, amoxicillin, cefadroxil, and piperacillin, during the second period (25). However, our results revealed that the frequency of E. coli peaked during the pandemic years, from 2020 to 2022. Additionally, E. coli resistance patterns to amikacin, cefazolin, and imipenem significantly changed over the surveyed period. A retrospective study in Indonesia on bacterial blood isolates found that the resistance rate of E. coli and K. pneumoniae to third-generation cephalosporins did not increase during 2019 - 2020. Similarly, our results demonstrated relatively lower resistance rates to third-generation cephalosporins for K. pneumoniae during the pandemic years. However, the findings of the previous study are not entirely consistent with ours, as the highest frequencies of ceftriaxone-resistant E. coli were observed during the pandemic (26). In another retrospective study, Golli et al. compared pre- and post-COVID-19 resistance trends of bacterial isolates collected from ICU patients in Romania and reported that the most common pathogens were S. aureus (25.4%) and Klebsiella spp. (17.6%) (27).
Based on their findings, Klebsiella spp. exhibited a marked increase in resistance to gentamicin (45% to 65%), colistin (< 1% to 20%), and aztreonam (3% to 56%) (27). Similarly, the resistance rate of E. coli spp. to colistin also increased (4% to 32%) (27). In clear contrast to Golli et al., our results showed no significant change in the frequency of gentamicin- and colistin-resistant K. pneumoniae or the related resistance patterns (27). In contrast to the present study, which highlighted only one colistin-resistant K. pneumoniae isolate, a review study reported an increasing rate of K. pneumoniae resistance to colistin (median = 21.1%) during the pandemic (20).
Our results indicated that the frequency of P. aeruginosa peaked in 2020 (19.6%) and 2021 (22.6%). Moreover, the resistance patterns of P. aeruginosa against several cephalosporins (including ceftazidime and cefepime), amikacin, ciprofloxacin, co-amoxiclav, gentamicin, piperacillin, and meropenem significantly altered during the COVID-19 pandemic. In this context, a retrospective study by Albahrani et al. in Saudi Arabia reported the frequencies of P. aeruginosa resistant to both cephalosporins and carbapenems as 6.7%, 11.2%, 7%, and 11%, respectively, from 2019 to 2022 (28). Similarly, Serretiello et al. observed an increasing trend in the resistance rate of P. aeruginosa to imipenem, ceftazidime, and cefepime between 2020 and 2022 (29). According to Serretiello et al., the resistance rate to imipenem was 32.6%, which is lower than our findings (29). In comparison with these two studies, our results revealed that the resistance patterns of P. aeruginosa to cefepime, ceftazidime, and meropenem changed between 2018 and 2023. However, no significant trends were observed for cefazolin, cefoxitin, cefotaxime, ceftriaxone, and imipenem. On the other hand, a study by Coseriu et al. in a tertiary hospital in Romania suggested a decline in the frequency of Pseudomonas spp. infections and resistance rates against carbapenems, aminoglycosides, and fluoroquinolones from 2020 to 2022 (30). These findings are comparable to ours, which show the lowest P. aeruginosa resistance to meropenem in 2020 (22.2%) and 2021 (20%). However, our results also reported the highest prevalence of P. aeruginosa during this period, as well as increased imipenem resistance (50% in 2020 and 42.1% in 2021). Coseriu et al. also attributed the improved antibiotic sensitivity among Pseudomonas spp. to both preventive initiatives and the limitation of antibiotic abuse at that medical center during the pandemic period (30). Similarly, a meta-analysis study reported an association between the lack of preventive initiatives against AMR during the pandemic and increased AMR among gram-negative organisms, including P. aeruginosa (17). These findings highlight the potential impact of limiting environmental pathogen sources and implementing evidence-based antibiotic prescriptions in controlling P. aeruginosa infections.
The COVID-19 pandemic has had a lesser impact on AMR in gram-positive bacteria compared with Gram-negative bacteria (18). Nevertheless, the trend of MDR gram-positive bacteria has shown an increase similar to that of gram-negative bacteria (19). Abdollahi et al. conducted a retrospective study on 167 S. aureus bacteremia samples collected from March 2020 to March 2022 (31). The study reported the following resistance frequencies for S. aureus: Vancomycin (0%), clindamycin (69.5%), ciprofloxacin (77.2%), erythromycin (80.8%), and penicillin (95.8%) (31). The results indicated that ciprofloxacin-resistant S. aureus isolates were associated with increased mortality rates and a significant burden on hospitalized patients during the COVID-19 pandemic (31). In comparison, the resistance rates in our study were lower for clindamycin (30.8%), ciprofloxacin (24.1%), erythromycin (16.7%), and penicillin (27.6%) among S. aureus isolates. However, we found vancomycin resistance to be more prevalent (13.3%). Several studies have reported an increase in methicillin-resistant S. aureus (MRSA) infections during the pandemic (32, 33). On the other hand, Bentivegna et al. observed a significant reduction in MRSA infections during the pandemic, which was attributed to infection prevention and control (IPC) practices (34). Furthermore, a recent meta-analysis found no association between MRSA incidence density and the COVID-19 pandemic (17).
There are limited data regarding the impact of COVID-19 on the AMR patterns of coagulase-negative Staphylococcus (CoNS) species. In our study, CoNS species were the most frequent Gram-positive pathogens (12.8%), which contrasts with findings from the WHO-EMRO region (including Iran), where S. aureus species are the leading gram-positive cause of hospital-acquired infections (35). These findings raise concerns about the increasing trend of resistant CoNS species during the pandemic and post-pandemic periods (35). In this study, the prevalence of CoNS species was highest in the post-COVID period (14.3% in 2022 and 21.3% in 2023). Compared with our results, another retrospective study revealed a notable increase in CoNS frequency (up to 11.22%) in the post-COVID-19 era (27). This study also reported that CoNS was the most frequent pathogen responsible for bloodstream infections during both the pre- and post-COVID-19 periods (27). According to that study, more than 90% of CoNS isolates were resistant to penicillin, and more than 60% were resistant to clindamycin and clarithromycin (27). In our study, CoNS isolates were most resistant to ampicillin (71.4%), ceftazidime (53.3%), penicillin (52.3%), ciprofloxacin (47.8%), and ceftriaxone (42.3%), respectively. Another retrospective study on blood culture specimens collected from January 2018 to June 2021 revealed that more than 50% of CoNS isolates from COVID-19-negative patients were resistant to clindamycin and erythromycin (35). However, our results demonstrated that the resistance rates of CoNS species to clindamycin and erythromycin were lowest during the pandemic period and peaked in 2023. Moreover, the trend of CoNS resistance to clindamycin significantly changed between 2018 and 2023. This study had some limitations. The retrospective design is important because comprehensive demographic data, including previous antibiotic treatment and clinical outcomes of the patients, were not available. Furthermore, the data were extracted from only one hospital, which might influence the applicability of the results.
5.1. Conclusions
Although we have passed through the pandemic, its consequences, such as changes in AMR trends, continue to challenge the healthcare system. The data on AMR alterations during the pandemic and post-pandemic periods appear worryingly heterogeneous and inconclusive. Most studies on this issue suggest an increasing trend in AMR during this era. However, the trend of AMR profiles for each microorganism remains under discussion, as well as the differences in altered AMR trends between high-income and low-income countries. Coronavirus disease 2019 has significantly influenced the resistance patterns of both gram-negative and gram-positive MDR bacteria. Monitoring adherence to guidelines is essential to prevent the further prevalence of resistant strains, particularly in low-income countries, where attitudes toward antibiotic prescription and hygiene standards need improvement. This necessitates the strict implementation of antibiotic prescriptions based on updated guidelines and antimicrobial stewardship programs in these countries to mitigate the further emergence of AMR. We also recommend conducting more observational studies to provide additional data on post-COVID-19 AMR.
