1. Background
Among water pollutants, Natural Organic Matters (NOMs) are highly important for their problems in water treatment plants. Natural organic matters are a mixture of organic compounds that originate from natural and synthetic sources and vary in reactivity, structure, and color. The importance of NOMs in drinking water was formerly due to aesthetic and colorless purposes that raised consumer protests. However, today, they are mainly used because of non-degradability and formation of Disinfection Byproducts (DBPs), e.g., Trihalomethanes (THMs), that are often carcinogenic (1). Knowledge and experiments show that hydrophobic compounds are most effective in the formation of precursors and subsequently, DBPs. Hydrophobic compounds may also play a pivotal role in the formation of novel compounds in water with low humic substances. Some of these compounds may be much more toxic than chlorine components (2).
Different methods are used to remove organic pollutants from water and wastewater environments such as adsorption onto adsorbents and membrane or biological methods, each of which has disadvantages including problems with chemical and biological sludge, the limited adsorption capacity of adsorbents, the need for replacement of adsorbents, adsorbent regeneration, problems with exploitation of membrane filters and membrane blockage, or toxic effects of contaminants on biological systems. Another approach to removing organic and persistent pollutants from water and wastewater environments is the use of conventional and advanced oxidation methods. Unlike conventional oxidation, advanced oxidation methods lack the above-mentioned disadvantages due to the production of highly oxidizing free radicals and the ability to degrade and mineralize organic compounds to prevent the formation of toxic secondary compounds (1, 3, 4).
Among advanced oxidation methods, catalytic oxidation has received much attention since the advent of nanocatalysts. In catalytic oxidation methods, nanocatalysts are used to degrade pollutants. In Photocatalytic Oxidation (PCO), pollutants are converted into low-risk products at a particular state of the process performance (a certain range of pollutant concentrations, humidity, etc.), which is one of the goals of researchers (5). In photocatalytic oxidation, semiconducting metal oxides and sulfides are used in pure or doped forms. Common photocatalysts, including TiO2, ZnO, ZnO, ZnS, CdS, CeO2, ZrO2, SnO2, and WO3 are doped with a metal or non-metal dopant. The photocatalytic activity of some semiconductors (e.g., WO3, ZnS) has been tested thus far, but the results have been mostly disappointing when compared to TiO2. Therefore, TiO2 nanoparticles are suitable for the photocatalytic oxidation process. This is due to the unique characteristics of titanium dioxide, such as low cost, safety, and chemical stability.
The use of TiO2 is limited due to structural properties such as the wide bandgap (3.2 eV), low quantum efficiency, and electron-hole recombination. The currently used photocatalytic modification techniques include doping with metal ions (e.g., Mn2+, Ni2+, Zn2+, Ag, Au, Pt, Fe2+, etc.) and non-metal elements (e.g., B and N), color sensitization (sensitization with surface complexes), sensitization with polymers, and formation of heterogeneous nanoparticles with other semiconductors. However, among the above-mentioned methods, doping with metal ions has shown the best results. Among different metals used in doping methods, Fe3+ is suggested as a dopant of choice due to half-filled configuration, the high similarity of its ionic radius (0.645 Å) to that of Ti4+ (0.604 Å), and easy bonding to the crystalline structure of TiO2 (inhibition of electron-hole recombination) (6-10).
One of the problems with in-vitro and in-vivo uses of nanoparticles is their removal from solutions. Therefore, the introduction of nanoparticles that can absorb wide-range wavelengths, undergo photocatalytic degradation and are easily removed from the solution after the reaction is of great importance. The current study aimed at synthesizing and facilitating the application of Fe-doped TiO2 nanoparticles in-vitro and in-vivo (e.g., water and wastewater treatment plants) since they have a narrower bandgap than pure TiO2 and also have good magnetic characteristics for removal from the solution.
2. Objectives
This study aimed to survey the efficiency of photocatalytic degradation of humic acid using magnetic nanoparticles (Fe-doped TiO2@Fe3O4) in aqueous solutions.
3. Methods
3.1. Synthesis of Magnetic Iron Oxide (Fe3O4) Nanoparticles
In the current study, humic acid was purchased from Sigma Aldrich. Other chemicals were purchased from Merck (Germany). Chemical methods, especially co-precipitation, are the most common approaches to produce magnetic nanoparticles (especially magnetite and maghemite). For this purpose, 2 g of FeCl2 and 5.12 g of FeCl3 were added to 200 mL of distilled water. The mixture was stirred at 600 rpm. Then, 1.5 mM ammonia was dropwise added to the solution until reaching pH > 8. Then, a black precipitate was formed in the solution. Nitrogenization and solution stirring continued for two hours after adding ammonia. After the completion of the reaction, the obtained nanoparticles were washed several times with distilled water and dried at room temperature (11).
3.2. Synthesis of Fe-doped TiO2@Fe3O4 Nanoparticles
In the current study, the sol-gel method was used to synthesize Fe-doped TiO2@Fe3O4 and Fe-doped TiO2 catalysts. To synthesize the nanoparticles, certain amounts of Fe3O4, 2-propanol, deionized water, and HNO3 were poured into a flat-bottom balloon and stirred with a magnetic stirrer for 15 min until completely mixed (solution #1). In another Erlenmeyer flask, certain amounts of titanium (IV) isopropoxide, 2-propanol, and Fe3O4 were mixed with a stirrer to form a homogeneous solution (solution #2). Then, solution #1 was dropwise added to solution #2 while mixing. After 30 min of mixing of both solutions (solutions #1 and #2) and the formation of the sol, the balloon containing sol was left in the laboratory at room temperature for five hours until the gel with high strength and adhesion was formed. The prepared gel was dried in the oven at 80ºC for 24 h, and then the gel powder was calcined at 500ºC for one hour after washing several times with distilled water (12). We used SEM, EDX, FT-IR, XRD, VSM, BET, and DRS to characterize the synthesized Fe-doped TiO2@Fe3O4 nanoparticles.
3.3. Photocatalytic Activity of Prepared Nanoparticles
In this step, the effects of various variables such as pollutant concentration, Fe-doped TiO2@Fe3O4 nanoparticle concentration, UV exposure time, and initial pH of the solution were investigated on the efficiency of the photocatalytic process. A 15-Watt UVC lamp was used in the current study. To perform the photocatalytic process, we prepared 250 mL humic acid at different concentrations (5, 10, 15, and 20 mg/L) and pH values (3, 5, 7, 9, and 11). Sodium hydroxide and sulfuric acid (0.1 N) were utilized for pH adjustment. Then, certain amounts of Fe-doped TiO2@Fe3O4 nanoparticles (50, 100, 200, and 400 mg/L) were added. The prepared suspensions were placed in the dark for 30 min before exposure to UV light and the start of the photocatalytic process to reach the adsorption-desorption equilibrium. Then, the suspensions were sampled at different time intervals. After the separation of photocatalytic nanoparticles, the residual humic acid content was measured by a TOC meter model ANATOC SERIES II.
4. Results and Discussion
4.1. Scanning Electron Microscopy Analysis
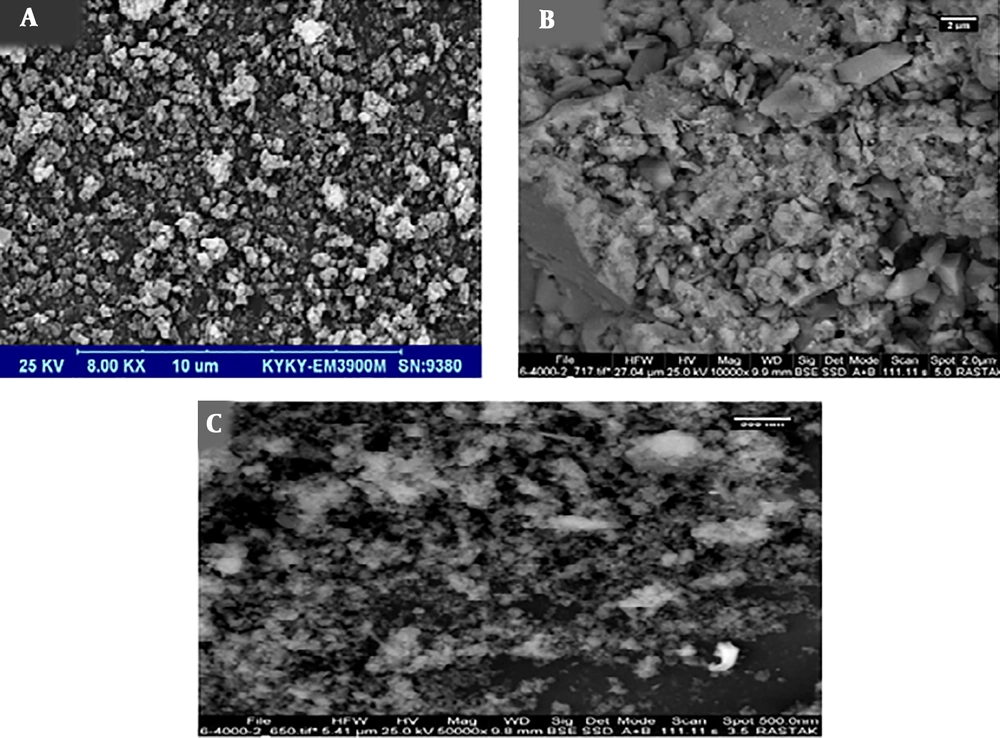
Scanning Electron Microscopy (SEM) is suitable for approximating nanoparticles’ shape and size distribution. Figure 1 shows the SEM images of Fe3O4, Fe-doped TiO2, and Fe-doped TiO2@Fe3O4 catalysts. The surface morphology of nanoparticles showed no obvious difference and the particles tended to accumulate in all samples. It could be due to the magnetic properties and fineness of the nanoparticles (13).
4.2. X-ray Diffraction Analysis
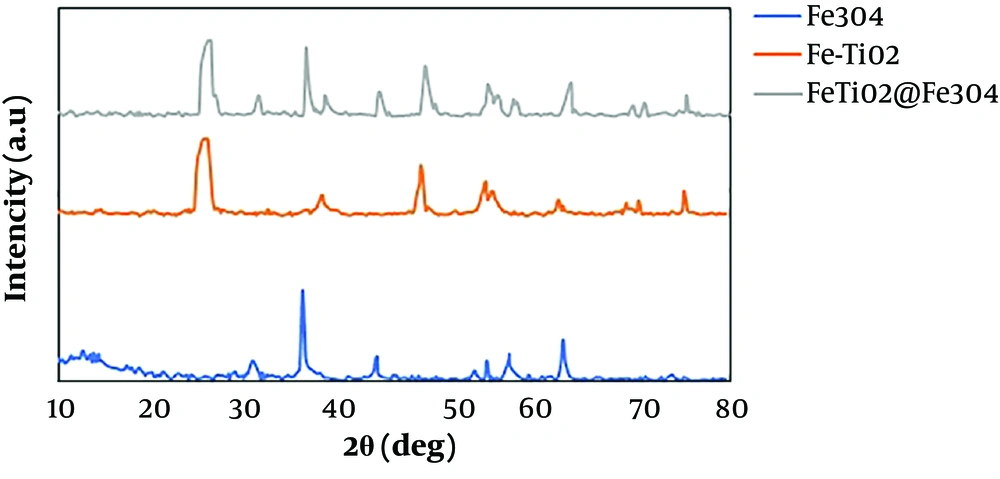
An X-ray Diffraction (XRD) spectrophotometer was used at the wavelength of 1.55418 Å to determine the crystal structure, size, and phase of the formed nanoparticles. Figure 2 shows the XRD spectra of Fe-doped TiO2 and Fe-doped TiO2@Fe3O4 nanoparticles at 10º - 80º (2θ).
The crystal size of the synthesized nanoparticles was calculated in all samples using the Debye-Scherrer equation, as follows:
where D is the mean diameter of the crystallite in nm, K is the refractive index of crystals (that is constant and usually equal to 0.9), λ is the X-ray wavelength used for XRD analysis (in the current study, 1.55418 Å), θ is the angle of diffraction in degrees, and β is the Full Width at Half Maximum (FWHM). As shown in Figure 2, the XRD spectrum of synthesized TiO2 had large, sharp peaks, indicating good crystalline structures of synthesized nanoparticles. The peaks at 25.32, 37.78, 47.98, 54.20, 55.02, 62.11, 69.21, 70.48, and 75.23 confirmed the crystalline anatase phase of Fe-TiO2.
Choi et al. studied the effect of different doping procedures on the phase transition from anatase to rutile and showed that small-radius dopers could directly integrate into the TiO2 crystalline lattice and form further the anatase phase, which has more photocatalytic activities than other phases (14). As shown in Figure 3, no Fe-related peak was observed in Fe-doped nanoparticles, which confirms that the TiO2 crystalline structure did not change significantly. Eadi et al. reported that the absence of a significant peak after the doping process could be due to the concentration of doped iron lower than detectable limits. On the other hand, due to the similarity of the ionic radius of Ti4+ (0.604Å) and Fe3+ (0.645 Å), some sites of the TiO2 lattice likely occupied by Fe ions (8, 15).
Rahul Reddy et al. showed that the substitution of iron in the crystalline lattice of TiO2 could lead to the reduction of the rutile phase, which may also be due to the reduction of oxygen sites on the surface of TiO2, thus preventing crystallization at other phases (16). On the other hand, an increase in the amount of iron could change reflections to narrower angles due to the replacement of Ti4+ with slightly larger Fe3+ (17). Kamani et al. reported that the anatase peaks became wider in samples, which can be due to the change of the absorption edge to the visible spectrum (12). According to the Fe3O4 nanoparticles graph, the diffraction peaks of 30.16, 35.36, 43.13, 54.57, 56.92, and 62.51 can be related to diffraction from the centered cubic lattice.
4.3. Diffuse Reflective Spectrum
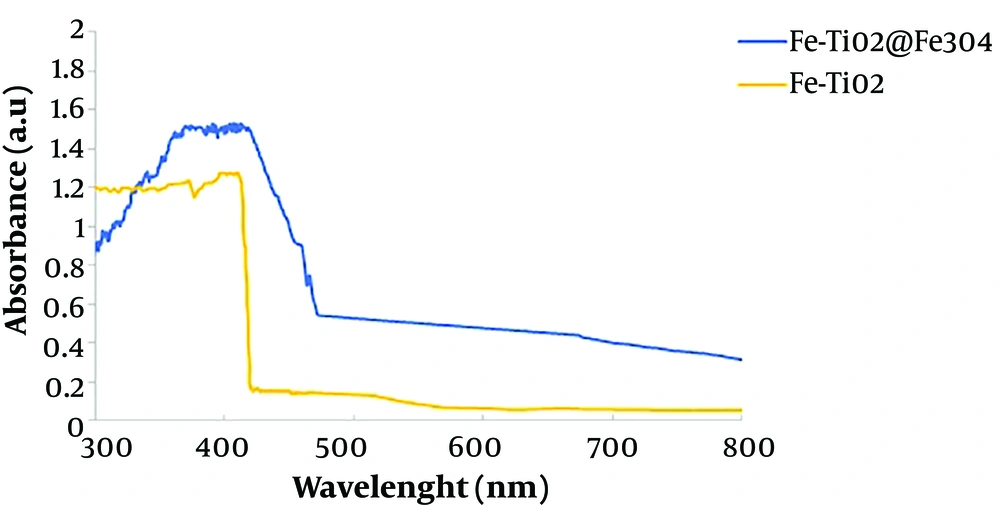
The Diffuse Reflective Spectrum (DRS) analysis is used to measure the reduction of the energy gap after doping of doped elements into the structure of synthesized nanoparticles. Figure 4 shows the absorption spectrum of two samples synthesized at 300 - 800 nm wavelengths. In addition, the bandgap of the nanoparticles can be determined using the DRS analysis data, the Kubelka-Monk function, and the Tauc method, followed by plotting ahv1/2 against the energy of the absorbed photons in hv.
where a is the absorption index, h is the Planck constant, v the light frequency, A is the absorption constant, Eg is the nanoparticle bandgap, and r is the optical transmission process.
The comparison of TiO2 nanoparticles synthesized without doping with commercial TiO2 with a bandgap of 3.2 eV indicated that the sol-gel synthesized nanoparticles had a lower bandgap. This difference could be due to influencing parameters during the synthesis of nanoparticles. Therefore, nanoparticles synthesized by the sol-gel method had better catalytic properties than commercial TiO2 (18, 19).
According to Figure 4, iron doping and magnetization of TiO2 caused the absorption wavelength to be shifted to larger wavelengths and get closer to the visible spectrum. Also, the decrease in the bandgap could be due to the reaction of the third orbital of Ti and the d orbital of Fe, where the intermediate placement of iron in TiO2 produced an additional energy balance between the capacitance and the conductivity layers of TiO2 nanoparticles. The iron doped in the structure of TiO2 acted as an intermediate energy balance, reduced the bandgap, and changed the absorption of light into the visible spectrum (8, 15).
4.4. Effect of pH Values
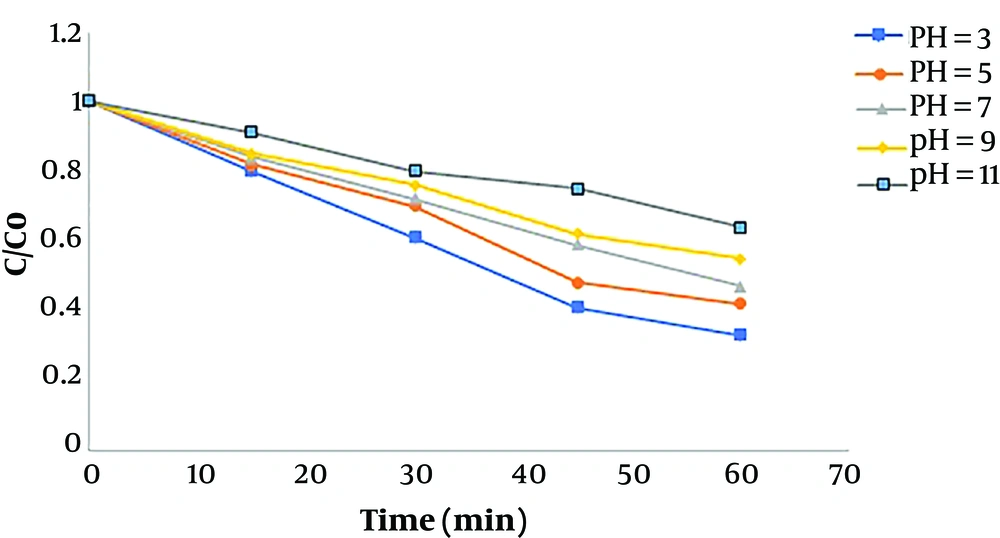
Figure 3 shows the effect of pH on the humic acid decomposition under acidic, neutral, and basic conditions at different time intervals when other variables were constant. The results showed that the efficiency of humic acid removal increased under acidic conditions and reached its maximum at pH 3, but decreased at basic and neutral pH values.
The solution pH is an important factor in photocatalytic and sonocatalytic processes through affecting the absorption of organic compounds on the catalyst surface, as the sonophotocatalytic degradation process often occurs on the catalyst surface (20). The dominant surface electric charge of different catalysts in the natural state may be positive or negative depending on surface properties, especially surface functional groups and components of the catalyst. In photocatalytic processes, pHzpc plays an important role, as, at pHzpc, the positive and negative electric charges reach the balance on the surface of the catalyst. By increasing the pH to above pHzpc, the dominant electric charge on the catalyst surface is negative, and by decreasing the pH below pHzpc, the dominant electric charge on the catalyst surface becomes positive. The results of the study by Kamani et al. showed that in advanced oxidation processes, the solution pH had a significant effect on the production of hydroxyl radicals as powerful oxidizing agents (21). The pHzpc of TiO2 ranges from 5.6 to 6.4. Therefore, the surface charge of Fe-doped TiO2 was positive when pH < pHzpc, negative when pH > pHzpc, and neutral when pH = pHzpc, according to Equations 3
Also, the structural characteristics of pollutants and intermediate oxidation products are changed when pH changes (18, 22).
Li et al., in the study of humic acid degradation by the photocatalytic process, showed that the maximum removal efficiency was obtained at acidic pH values. At acidic pH values, molecular humic acid is easily degraded by hydroxyl radicals. As the pH increases, the removal efficiency decreases, which may be due to the Scavenger effect of hydroxyl ions, because as the pH increases, the concentration of hydroxide ions (OH-) increases that subsequently react with some efficient radicals to form water molecules. In addition, at higher pH values, the electrostatic repulsion forces between humic acid and the catalyst surface increase, and the humic acid removal decreases (20).
Under acidic conditions, iron is degraded through both direct and indirect ways, directly by the reductive process and indirectly by the hydrogen production pathway in the iron oxidation cycle, both of which are performed better under acidic conditions. In addition, the Fenton-like process performs better in acidic conditions, which increases the removal efficiency. The gravitational forces between the catalyst and humic acid increase in acidic conditions and improve the absorption of humic acid on the photocatalyst surface while under basic conditions, the repulsion forces between humic acid and the catalyst decrease absorption and degradation rates (18).
4.5. Effect of Initial Humic Acid Concentration
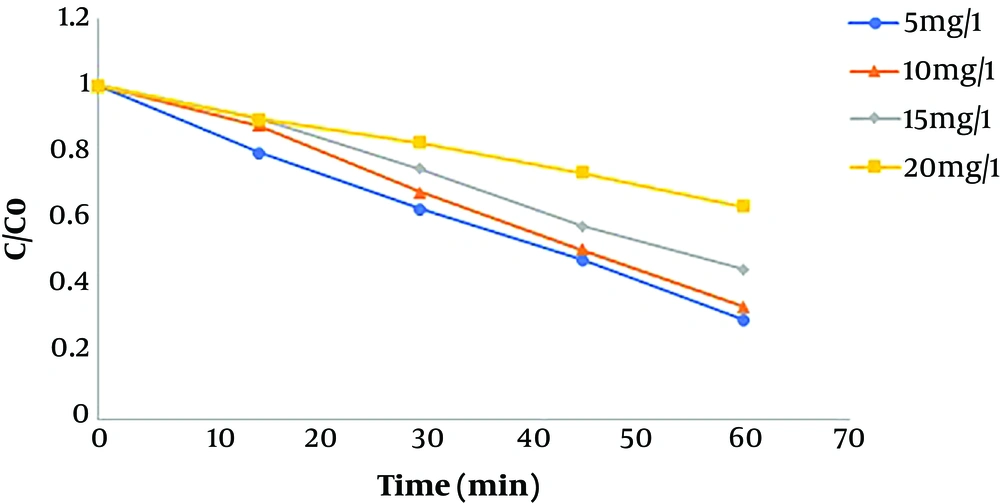
After determining the optimum pH, the effect of different humic acid concentrations was investigated on the removal efficiency. Different initial concentrations of humic acid were 5, 10, 15, and 20 mg/L. Figure 5 shows the effect of different initial concentrations of humic acid on its removal efficiency. The maximum efficiency occurred at lower initial humic acid concentrations, and the removal efficiency decreased with increasing the pollutant concentration. Li et al., in a study of the photocatalytic degradation of humic acid obtained a similar result and showed a significant decrease in efficiency with an increase in pollutant concentrations (20). Tabasideh et al., in a study of the sonophotocatalytic degradation of diazinon using Fe-TiO2 nanoparticles in aqueous solutions at different initial concentrations of diazinon (10, 20, 30, 40, 60, and 100 mg/L), concluded that the removal efficiency decreased by increasing diazinon concentration (23).
According to evidence of the effect of the initial pollutant concentration on the degradation process, the reduction in efficiency following an increase in the pollutant concentration can be due to some reasons. First, during the oxidation reaction, the intermediate products are formed due to the degradation of the pollutant; at higher concentrations, the competition increases between pollutant molecules and intermediate products to occupy the nanocatalyst surface active sites. Thus, by occupying some active sites by intermediate products, fewer pollutant molecules can bind to the active sites. Second, produced hydroxyl radicals react with both humic acid molecules and intermediate products, thereby decreasing the effectiveness of sonocatalytic degradation, while the concentrations of hydroxyl radicals produced during the oxidation process are constant (24).
The results of the study by Mohammadi et al. showed that as the concentration of the pollutant increases, more pollutant molecules adhere to the catalyst surface and occupy the active sites of the catalyst, thereby reducing the formation of hydroxyl radicals. Sohrabnezhad et al. showed that increasing the concentration of pollutants can increase the absorption of light and decrease the number of photons reaching the catalyst surface, thereby decreasing the stimulation of catalytic nanoparticles and production of hydroxyl radicals (25, 26).
4.6. Effect of Fe-doped TiO2@Fe3O4 Concentration
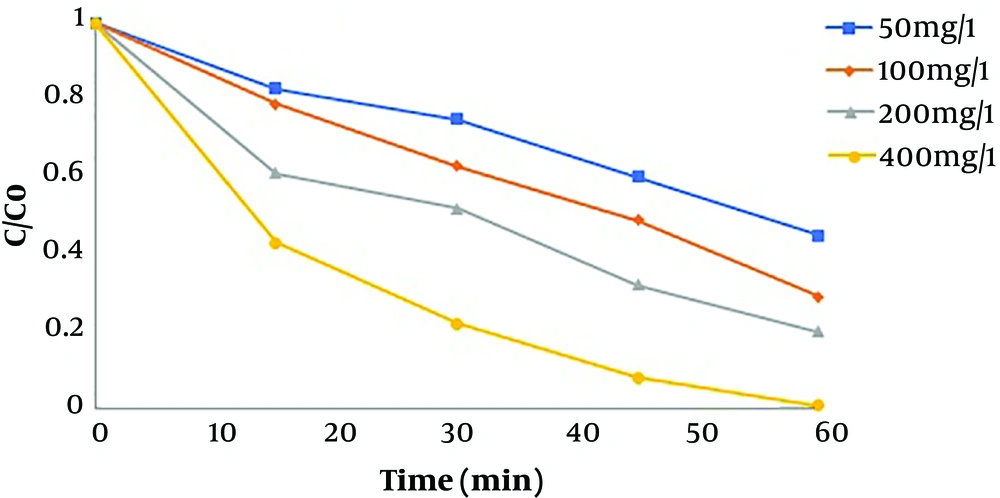
One of the most important parameters affecting the optimum efficacy of hybrid and catalytic oxidation processes is the nanoparticle or catalyst dosage used in the process. Four different concentrations (50, 100, 200, and 400 mg/L) were used to investigate the effect of TiO2 concentration. Figure 6 shows the effect of different concentrations of nanoparticles on the photocatalytic degradation of humic acid. As shown, the degradation increased with increasing the concentration of nanoparticles.
The study by Geng et al. on the sonophotocatalytic degradation of humic acid showed that the removal efficiency increased with increasing the catalyst concentration from 0.25 to 1.00 g/L. The reason for this finding could be many available active sites and more humic acid molecules absorbed on the surface of the catalyst, which ultimately resulted in the increased degradation efficiency (27). The study by Fallah Shojaei et al. showed that dye removal efficiency increased by increasing the concentration of doped magnetic TiO2 nanoparticles from 10 to 30 mg/L (28). The results of the study by Ezzatahmadi et al. on the degradation of 2,4- dichlorophenol using palygorskite-supported Fe/Ni nanocomposite showed that the removal efficiency increased with increasing nanoparticle concentration since the number of active sites on the catalyst surface and formation of hydroxyl radical were greater (29).
4.7. Conclusion
The current study aimed at evaluating the efficacy of photocatalytic oxidation for humic acid removal in aqueous environments using Fe-doped TiO2 magnetic nanoparticles. In the study, the effects of various parameters including pH, initial humic acid, and initial synthesized nanoparticle concentrations were investigated. The different analyses of the synthesized nanoparticles showed that the nanoparticles had good uniformity and dispersion. The surface morphology of the nanoparticles showed that they tended to accumulate. In the XRD analysis, the large and sharp peaks confirmed the good crystalline structure of the synthesized nanoparticles. Doping of iron into the structure of TiO2 changed the absorption wavelength to higher wavelengths, closer to the visible spectrum. The maximum removal efficiency of dichlorophenol was achieved using a 15-W UVC lamp in optimum conditions of pH 3, initial humic acid concentration of 5 mg/L, doped magnetic nanoparticle dosage of 400 mg/L, and 60 min reaction time. Therefore, due to the high efficiency of the photocatalytic process, its application is suggested for the removal of humic acid in water purification processes.
