1. Background
Today, workers from various occupations such as transportation, industry, agriculture, and mining are exposed to excessive occupational whole-body vibration (WBV). WBV occurs when the human body is in contact with a vibrating surface causing the vibration to transfer to the parts of the body, which are almost distant from the contact areas. WBV is usually transmitted into the human body through several critical routes such as the legs, the buttock, the waist, and the back (1-3). Exposure to mechanical vibrations in moving machinery and devices may disturb workers’ comfort, work efficiency, and health and safety (4, 5). Numerous epidemiological studies have demonstrated that one of the indispensible risk factors in increasing the frequency and intensity of the back pain among professional drivers is the continuous and longtime exposure to WBV (6, 7). Within the context of occupational ergonomics, such exposure is considered as musculoskeletal disorder or back pain and is mentioned ergonomics risk assessment (8, 9). The process of risk assessment also appeared differently in safety and ergonomics (10). Additionally, epidemiological studies on North American locomotive engineers showed that the prevalence of different neck and lumbar disorders were about two times more than the control group (11, 12).
International standard organization in ISO 2631-1: 1997 and ISO 2631-5: 2004 standards, has offered three methods for evaluating human exposure to WBV involving shock and impact vibrations; the mathematical method proposed by ISO in 2004, quantitatively states the relationship between damages to lumbar vertebral discs, and vibration accompanied with repeated shocks (6).
In the ISO2631-1 standard, basic and vibration dose value (VDV) methods and in the 5th part of the evaluation method for determining the pressure on lumbar spine is provided, respectively.
The risk associated to the exposure to WBV above the permissible limit is well documented all over the world, and particular requirements have been proposed for preventing or mitigating the levels of exposure (13). However, there is little information about WBV and the working conditions of metro drivers in the current literature of vibration and occupational health. To the best of our knowledge, almost no systematic or documented measurements have been made to assess the health effects from exposure to WBV among Tehran metro drivers with either using previous or current standards. Train drivers are typically exposed to a considerable amount of WBV and shock, the rate of which depends on some factors such as the design of train cabins, the speed of the train, the way a driver performs the functional tasks, the route they drive on, etc. (14). Although limited studies have already evaluated the level of whole-body vibration (WBV) exposure experienced by the metro train drivers based on the ISO 2631-1:1997 methodology, no study has yet recruited ISO 2631-5:2004. Therefore, using these two standards, in the present study, the evaluation of the metro train drivers WBV exposure was carried out and the results were compared.
2. Methods
The study was conducted on 23 trains in 4 lines of Tehran metro, with the average time measurement of 1.4 hours and the standard deviation of 0.42 hours and varied from 0.44 hours to 2.54 hours. These trains were randomly selected from different lines, by the help of Tehran metro exploitation management, and WBV was measured on the drivers’ seats in three directions as mentioned in ISO 2631-1 standard for at least a complete work shifts.
The trains in lines 1, 2, and 4 of Tehran metro are of alternating current (AC) and direct current (DC) types, while in line 5, they are of trailer model 1 (TM1) and trailer model 2 (TM2) types. During conducting the measurements, we picked samples from all available train types. The trains were divided into 4 groups based on the sort of their supplied energy and the type of trackers used in their structure. These trains are mainly made in China and their energy system is 750 Watt DC electricity of the third rail and the express train of Tehran- Mehrshahr is 25000 Watt AC. According to the observations, during measuring the vibration, the average speed of the trains was approximately about 65 - 75 Km/h.
The investigated drivers aged from 26 to 33, and it has been at least 2 years since their first exposure to WBV took place. During the daily 10.5-hour work shift, each driver drives for 7.5 hours when he is exposed to the vibration, and rests in a specific place for 3 hours.
In WBV investigation, according to ISO 2631-1, two different frequency weighting bands are used: this range of weighting band based document of ISO 2631-1 is coincide of critical frequency of human body, one weighting band (W_d) for vibration in the two lateral and longitudinal (X&Y) axes and one weighting band (W_k) for vibration in vertical axis (Z) (15). The measurements were performed by an accelerometer and an analyzer (SVAN958) during a complete period covering and at least one complete road trip, in order to investigate the drivers’ total daily exposure to vibration on their seats.
Moreover, a review has been done according to ISO 2631-5 standard by using the measurement values of equivalent static compressive stress (Sed) and the risk (R) factor. Values of the total axis RMS, the peak acceleration, and the crest factor have also been calculated for each axis.
The crest factor is a dimensionless quantity defined as the ratio of the peak acceleration to the r.m.s acceleration. Evaluating health vibration effects is usually done according to ISO 2631-1 and by using r.m.s frequency weighting rate, however, when the crest factor is more than 9, then the standard for evaluation suggests two alternatives: Maximum Transient Vibration Value (MTVV) and VDV. MTVV is defined as the maximum of the current r.m.s value in the measurement period, and the current r.m.s is the highest acceleration in the previous second (2, 14, 16). In this study MTVV values are not mentioned because this index only shows the highest acceleration in one second, which is not considered functional for measuring the periods between 1584 and 9180 seconds.
In ISO 2631-1 standard: 1997, a health guidance caution zone (HGCZ), is available in order to interpret the results of the axis that has the dominant frequency weighting acceleration value (12). The lower boundary of HGCZ of an 8-hour-allowed exposure is about 0.45 m/s2 and its higher boundary for an 8-hour exposure is about 0.9 m/s2. In the VDV-based evaluations, the higher and the lower limits of HGCZ are 8.5 m/s1.75 and 17 m/s1.75, respectively (16, 17). Also, ISO 2631-5 standard in 2004 offered a criterion for evaluating the lumbar spine health effects related to the exposure to vibration including repeated shocks. This criterion is offered as the daily equivalent static compression dose, Sed, which is then used for calculating another risk factor called R.
According to ISO 2631-5 standard, when R factor values are less than 0.8, they show the “low possibility of undesirable health effects” for lumbar spinal area and when the R factor values exceed 1.2, they usually indicate the “higher possibility of undesirable health effects”. Also, when Sed values are less than 0.5 Mpa, they show the “possibility of the lower undesirable health effects” for lumbar spinal area, and when such values are more than 0.8, they show “possibility of the higher undesirable health effects”. In calculating the R factor, the user’s current age, his age when his first exposure to vibration occurred, daily exposure hours, and the total number of his exposure years are required. Such information was collected through a designed questionnaire and the interviews with the drivers for this study (17-19). Further details of the calculations in this study can be obtained through documents of ISO 2631.
Moreover, the estimated operation and limited time periods in this study were calculated with the use of the following equation.

Where for each evaluation method, D is the estimated time (hour), BL is the determined lower or upper boundary (e.g. 8.5 and 17 m/s1.75 for VDV method), Vm is the measured values corresponding to BL, and P refers to the related powers which equal 2, 4, and 6, respectively for the basic, VDV, and Sed or R methods (16, 18, 20). Analysis and calculation of whole-body vibration in this research was conducted by Excel and SPSS 16 programs.
3. Results
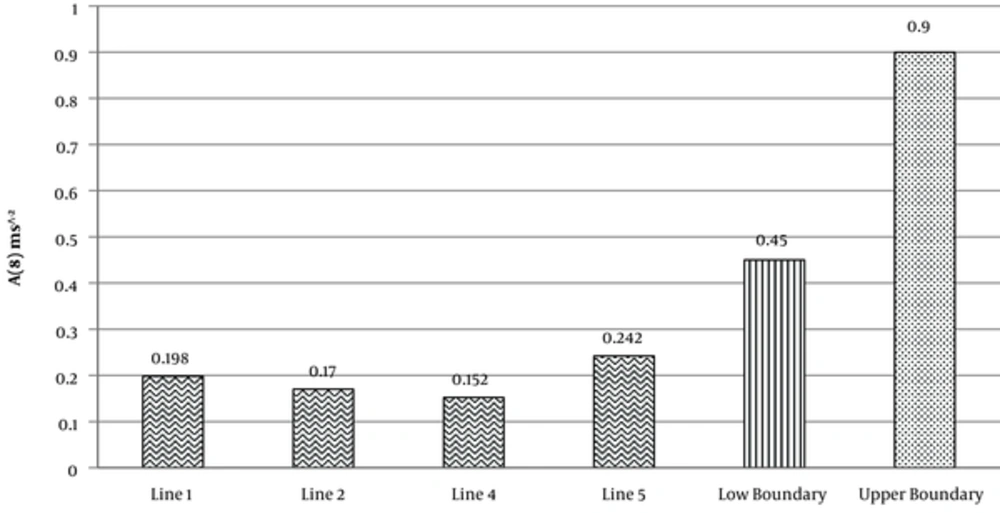
The results of this study were interpreted according to three criteria proposed by ISO 2631 standard: the basic method offered by ISO 2631-1 for evaluating human response to WBV, includes the evaluation and investigation of r.m.s weighting acceleration rate of vibration signal within the human frequency sensitivity. Measurements and calculations of the 8-hour-long equivalent acceleration in the studied metro lines have indicated that in all the cases, the equivalent acceleration was lower than the lower boundary of HGCZ. The mean values of the measured data in varies lines has been shown in Figure 1.
In VDV methods, of 23 subjects from the lines 1, 2, 4, and 5, 11 subjects (47.8%) levels of exposure were in the lower zone of the lower boundary of HGCZ (< 8.5 m/s1.75), 8 subjects levels of exposure (34.8%) were within the HGCZ (8.5 - 17 m/s1.75), and 4 cases (17.4%) were exposed to the levels above the upper level of HGCZ (> 17 m/s1.75).
The values of Sed frequency of all subjects, 14 (60.86%), 5 (21.74%), and 7 (17.4%), were respectively considered as low (> 0.8 MPa), moderate (0.5 - 0.8 MPa), and high (< 0.5 MPa) health risk categories.
R Factor evaluation revealed that only 3 of 23 subjects (3 of the investigated drivers) were within the category of (0.8 < R < 1.2) HGCZ, and the rest of the drivers fell into the category with low health risk probability (R < 0.8); therefore, none of the drivers were among the category with high health risks (R > 1.2). Generally, 2 of the 3 drivers, whose exposure levels were within HGCZ, came from line 1, and the other one was from line 2. Other drivers’ exposures were below lower boundary of HGCZ.
The dominant vibration axis among all of the subjects from the line 5 (Tehran- Mehrshahr), was the vertical axis. This can be contributed to the fact that this rout is far more uneven than 3 others and accordingly axis Z is the dominant one.
Since all of the calculated values of crest factor in this measurement, except the calculated value on axis Y for sample TM2-L7, were more than 9, thus VDV values are reported and calculated based on them.
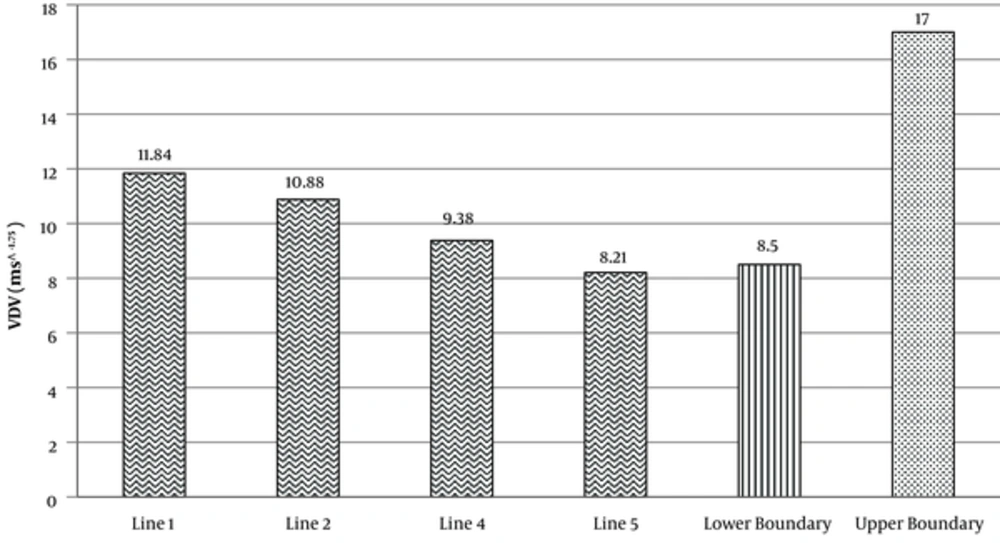
The total VDV calculated values for 4 subjects are more than the upper boundary of HGCZ (17 m/s1.75) offered by ISO 2631, and of these 4 subjects 3 cases were from line 1. Of all 23 subjects, 8 had exposure levels within HGCZ (8.5 - 17 m/s1.75) and of these 8 subjects 3 were from the line 1,3 were from line 2, 1 was from line 4, and 1 was from the line 5. The rest of the 11 subjects are less than the lower limit of HGCZ (< 8.5) offered by ISO 2631-1. The mean values of VDV measured in these four lines are presented in Figure 2.
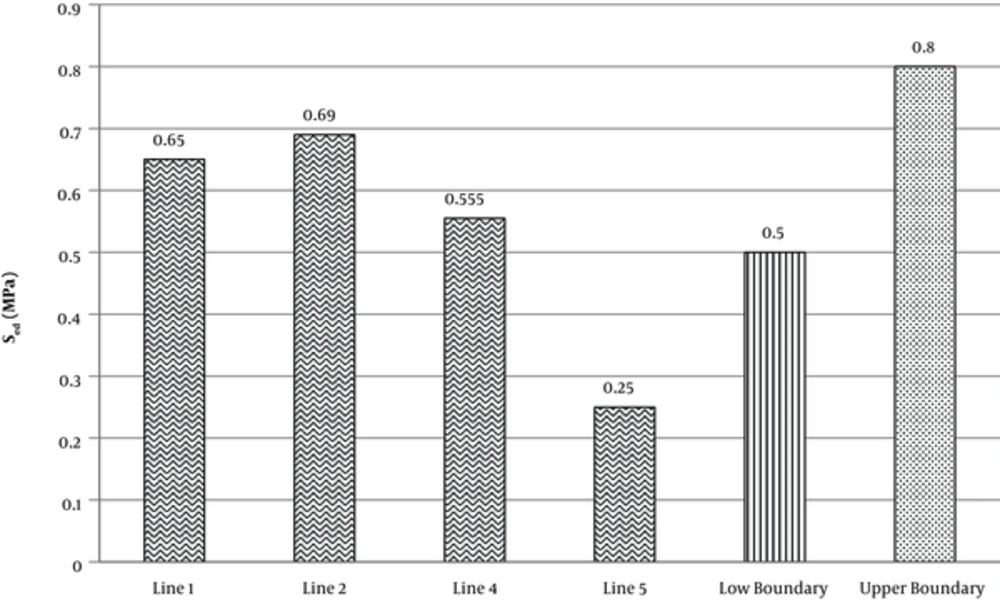
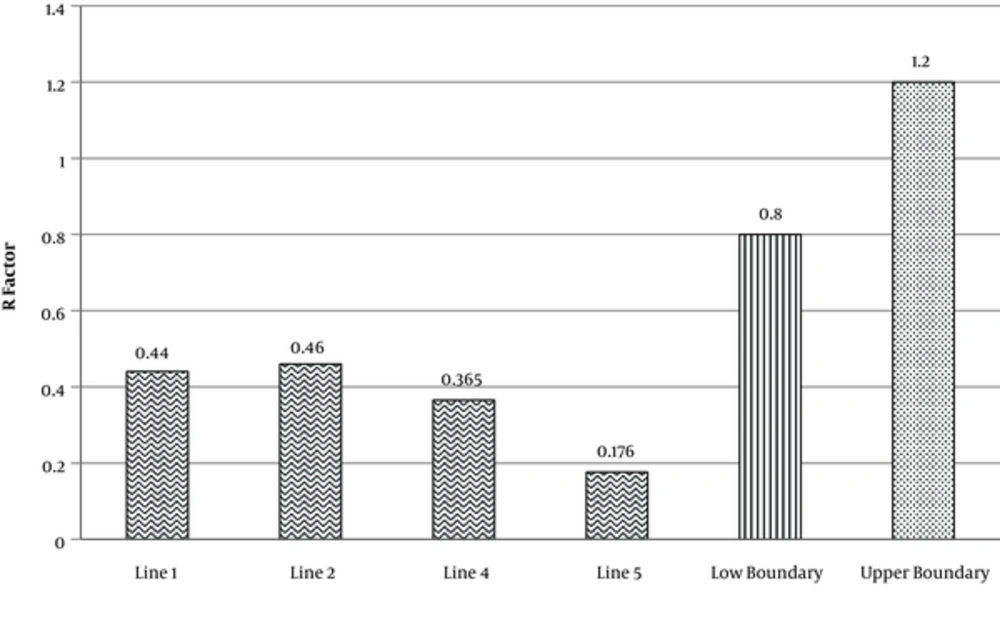
According to ISO 2631-5:2004, the daily equivalent static pressure dose on lumbar spinal areas of the 23 drivers of the metro trains was measured. The range of the calculated values is between 0.09 and 1.33 Mpa. The evaluations based on this method showed that 4 of the drivers were exposed to higher risk of HGCZ (> 0.8) than what is offered in standard ISO 2631-5, among whom 3 subjects were from line 1, and 1 subject was from line 2. In addition, out of 23 drivers, 7 drivers had exposure levels within the HGCZ (0.5- 0.8 Mpa), of whom 2 subjects were from the line 1, 4 subjects were from the line 2, and 1 subject was from the line 4. A total of 12 subjects’ exposures were lower than HGCZ (< 0.5) and showed the low possibility for health risks. The means of Sed and R Factor values measured in quadruple lines is presented in Figures 3 and 4.
Figure 2 depicts the comparison of the exposures in different lines. It is evident that all of the calculated values of A8h in all of the 4 lines are less than the lower boundary of HGCZ. In the case of VDV, which is offered in Figure 2, due to the criterion differences, it is plotted separately from the other indices. It can be seen that this mean value is declining in the lines 1, 2, 4, and 5 respectively, and almost all of them are in the suggested HGCZ. Investigating mean values of Sed in various lines states that the rate of this index is declined in lines 1, 2, 4, and 5, respectively, and the calculated mean values of the lines 1, 2, and 4 are in HGCZ with “the possibility of potential undesired health effects”, however, this value in line 5 is less than the low limit of HGCZ. The investigation of the average of R factor values in various lines states that these values like Sed, are declined in lines 1, 2, 4, and 5; the only difference is that the average of R values for all lines are less than the low limit of HGCZ suggested by ISO 2631-5.
In order to compare the obtained values, the amounts estimated by different evaluation methods and to make all the indicators with different units harmonized, different estimated exposure times from the evaluating methods should be compared. In this way, the permissible hours of exposure for each method are easily compared with one another and the level of the risk, which has been determined in that method is specified. That is, the greater the intensity of the predicted risk by such method the less exposure time will be allowed. The exposure time estimated by the different methods is provided in Table 1.
aAccording to lower boundary of HGCZ in methods of ….
bAccording to upper boundary of HGCZ in methods of ….
4. Discussion
In all the cases, the 8h equivalent acceleration in the studied lines was lower than the low limit of HGCZ. In the VDV-based evaluation, 6 subjects from the line 4, 1 subject from the line 2, and 1 subject from the line 4 fell within the HGCZ (8.5 - 17 m.s-1.75) and high level (> 17 m.s-1.75) of HGCZ. Moreover, 1 subject from line 5 fell within HGCZ. It is almost implied that the use of VDV indicator results in more risk probability than the 8-hour equivalent acceleration.
In R factor method, only 3 of the subjects (13%) were within the (0.8 < R < 1.2) of HGCZ and other drivers were in the category with low health risk probability (R < 0.8); none of the drivers were in the high health risk category (R > 1.2).
Comparison of the calculated mean values by the RMS and VDV methods along with the results from Figures 2 and 3 reveal that the risk levels assessed by the VDV method are greater than the ones determined by the RMS method. According to the comparison of the Sed and VDV method, lines 1 and 2 have higher health risk while line 5 has lower level. The mean values obtained in this study are greater than the values presented by Narayanamoorthy et al. (21) and relatively less than the values reported by Sayed et al. at the Cairo metro system (22).
Based on the study conducted by Lewis and Griffin, the use of VDV to evaluate the health effects of vibration containing critical shocks, results in safer and more cautious assessment compared to baseline method (23).
The evaluation of Tehran metro drivers’ exposure was done by using this index according to the offered related equation in ISO 2631-5. This result also showed that when drivers’ exposure assessment is performed by the R method, usually the lowest risk compared to the other assessment procedures is obtained and thus, the maximum daily exposure time is permitted. The other two methods, the VDV and Sed, exposure times were shorter. In other words, the values obtained by the R method specified a lack of agreement for the HGCZ.
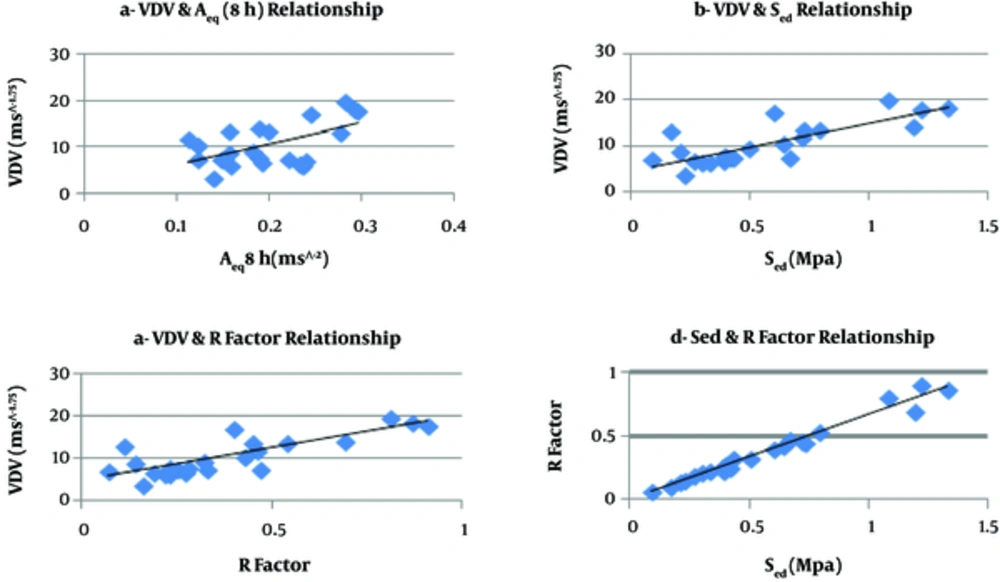
Evaluating the drivers by this index states that none of the considered drivers in this study have R values more than the upper boundary of HGCZ. Also, Figure 5 shows that according to factor R, there are just three individuals within HGCZ with the moderate risk among whom, 2 subjects were from line 1 and 1 subject was from line 2. The exposure levels for the rest of the 20 subjects were below the boundary of HGCZ. The relationship between the calculated values of VDV and Sed, Sed and R, VDV and R, and VDV and A (8 hours) is presented in Figure 5. The most linear correlation with A (8 hours) is between the values of Sed and R; VDV and R; VDV and Sed, respectively.
With regard to the mutual and direct influence of R and Sed on each other, the strong correlation between them was predictable.
Moreover, the least calculated daily exposure time is associated with Sed and just after that when the VDV method was employed less exposure time was allowed. However, the two exposure times were somewhat similar. The average daily exposure action time and permissible time (the lower bound and high ISO 2631) in different methods are presented in Table 1. When upper limit of HGCZ was considered these calculated times were above 8 hours in all lines and all methods.
The lack of consistency between the different methods of assessment in determining exposure time is well defined in Table 1. Such inconsistency has also been observed between different components of the standard and the boundaries of HGCZ in the other studies in other fields.
Alem et al. in a study conducted on military vehicles in 2005, found that evaluations by Sed are more accurate than VDV for types of exposures to multiple shocks (24).
A similar conclusion was obtained in the studies of Cooperrider and Gordon (2006), Eger et al. (2008) and Smets et al. (2010) (17, 25, 26). In these studies, the health risks caused by the WBV on locomotive drivers such as study of Cooperrider and Gordon, 2006 (25), load-haul-dumps (LHDs) in the study of Eger et al. 2008 (17), and haulage trucks in the study of Smets et al. 2010 (26) were predicted according to ISO 2631- 1:1997 and ISO 2631-5:2004. The health risks predicted according to ISO 2631-1:1997 were higher than those predicted according to ISO 2631-5:2004.
The positive point considered in the context of train drivers is the compatibility between VDV and Sed data in this study.
The issue of compatibility between the limits provided in ISO2631 studies have already been mentioned in the studies by Alem, Zhao, and Schindler, and each of these researchers in turn have proposed specific corrective reforms for the VDV and Sed methods in the study of military vehicles and average loaders (20, 24). As recommended by Alem, if the corrective reform of 5/3 to 8/4 in is used for VDV method, the health risk level of all the drivers might be higher than the upper boundaries and the health risk (24). Also, when in the Sed method (as recommended by the study of Schindler and Zhao) the range of correction is from 34/0 to 52/0 the mean exposure in lines 1,2, and 4 would be above the upper boundaries and will probably contribute to the health risk (20).
Although all A (8h) values are lower than the allowed limit, some of these cases are near the limit, so if evaluation is done based on 0.315 m/s2 criterion of vibration acceleration in 4 - 8 Hz for 8 working hours suggested by ACGIH, the possibility of undesirable health effects on that group of people who are exposed to vibration and are more sensitive is predicted (24).
Based on the basic evaluation method in this study, z direction was the most dominant one, which was comparable to the studies conducted on industrial vehicles in study of Wolfgang R, Burgess-Limerick R 2004, Eger 2006, Smiths 2010, and Zhao and Schindler (17, 20, 26, 27), trains (El Sayed et al. in Egypt) (28), and cars (Funakoshi 2004, Egypt) (29).
Since the metro train drivers’ exposure occurs on daily basis and usually lasts for long periods of time during their lifetime and even though they are usually exposed to a modest daily exposure level, such long time is considered as a potent risk factor and should be thoroughly evaluated.
4.1. Conclusions
Tri-axial accelerations of WBV were measured on the seat surface in urban metro drivers during normal workday operations. The suggested methods by ISO 2631-1, 5 were used for predicting the health risk of whole-body vibration among metro drivers.
The lack of a direct relationship between different parts of the standards has caused concern and could lead to confusion. For instance, if the evaluation methods in this study were based on the RMS and R, lower health risk for the spine would be reported. On the other hand if VDV and Sed assessment procedures are recruited, the health risk levels of moderate to high will be reported for exposure to the whole body vibration. Therefore, it is possible that the results are intentionally or unintentionally misinterpreted and manipulated to make the exposure levels permissible or safe while the probability of an adverse health risk really exists. Thus, until the ambiguities are obviated, a highly risky method should be utilized.
As a limitation of this study, it should also be noted that measurement of the whole body vibration is affected by factors such as the type of vehicle, direction of movement, leading operational tasks, seat, and cab drivers properties. For reducing this interference, more studies must be done in the future with large sample size.
We also suggested that the design of studies should be done with the aim of the revision of VDV in ISO 2631-1 and Sed and R factor in ISO 2631-5 methods, especially the upper boundary of its, and future studies should be done with more subjects.
In addition, it is suggested for the future researches to study the first and the last cars of trains and evaluate different parts of the cars to determine an exact exposure amount.
