


1. Background
Heat is one of the harmful physical factors in the workplace. It can directly influence individuals’ metabolism, heart rate, and amount of sweating, leading to diseases and increasing frequency of work-related errors (1-4). The ideal environment for humans is the one with a temperature of 21 - 24°C and a humidity of 50%. In order to assess heat stress in work environments, some indices are used that are indicative of thermal stress. Over the past century, more than 45 indices have been suggested, with some of them being approved by the International Organization for Standardization (ISO). These indices can be generally classified into three groups of rational, experimental, and direct categories. Rational methods are based on the principles of heat change of the man body in warm, neutral, and cold environments. Experimental indices, on the other hand, originate from human response to various environmental factors (1).
WBGT is an experimental technique introduced in 1957 and approved by ISO in 1989 under the ISO-7243 standard. WBGT, frequently utilized to measure heat stress, was developed by the U.S. Navy (5). Moran et al. proposed a new index, known as the environmental stress index (ESI), which is calculated based on environmental variables. Moran et al. have demonstrated a strong correlation between this newly developed index and WBGT. ESI is different from other introduced indices in two aspects: (1) in addition to environmental temperature, it considers relative frequency and solar radiation in the environment and (2) in measuring the three indices, no time lapse is required to balance the device (6, 7).
Wet-bulb dry temperature (WBDT) is an experimental index calculated in the light of measuring three environmental parameters, namely natural wet temperature, dry temperature, and radiation temperature (8).
Thermal work limit (TWL) is regarded as the standard index for assessing heat stress by the Australian Institute of Occupational Hygienists (AIOH) (9). Heat index (HI) was suggested by the U.S. National Weather Service and developed by Steadman in 1997. It is calculated based on the two environmental parameters of relative humidity and dry temperature (10, 11).
SET is the most comprehensive index of thermal comfort calculated based on physiological responses (12). PET is a temperature physiological index obtained from the human energy balance equation (13). In order to improve workers’ health and efficiency and prevent accidents in the workplace, it is necessary to understand the effect of workplace conditions on physiological responses such as deep temperature, heart rate, and blood pressure (14).
Moran et al. introduced some other indices like physiological strain index (PSI) and physiological strain index based on heart rate (PSIHR), which are calculated by comparing body’s deep temperature (T) and heart rate (HR) at baseline and under heat stress (15).
Pelletizing industry is very important in Iran. Workers in this industry are exposed to various sources of heat (furnace) in an indoor space. There are, nonetheless, a few studies focusing on the relationship between heat stress and physiological parameters.
2. Objectives
Thus, further research in this regard is required. As a result, the following objectives were pursued in this study:
1. Measuring environmental variables at workstations
2. Measuring operators’ physiological responses
3. Calculating ESI, WBGT, WBDT, TWL, HI, SET, PET, PSI, PSIHR
4. Defining the correlation between ESI and heat indices including WBGT, WBDT, TWL, HI, SET, PET, PSI, and PSIHR
3. Methods
3.1. Research Design
This cross-sectional, descriptive-analytical study was conducted in the summer of 2016 in one of the pelletizing factories located in southeastern Iran. Various stations along the furnace were selected for measuring environmental variables and workers’ physiological responses at the workstation and workers’ physiological responses. The measurements were conducted on various days. Additionally, the workers’ medical records were studied to select participants who were completely healthy, did not use drugs, did not smoke, and did not suffer from cardiovascular diseases.
3.2. Participants
The participants were selected from among workers working in the pelletizing factory. The mean and standard deviation of their age, experience, and body mass index were 4.05 ± 31.75 years, 23 ± 7 years, and 25.26 ± 2.15 kg/m2. According to the ISO 8996 standard, operators’ metabolic rate was set at 90 - 140 (w/m2) (16).
3.3. Sampling Procedure
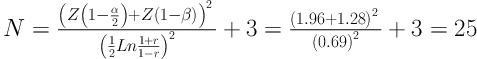
With the aim of examining physiological parameters, the participants were selected through random sampling. Based on Equation 1, subjects were selected. However, to improve the reliability of the present work, 30 workers were selected. In Equation 1, Z is the Z value, α is the type 1 error, β is the type 2 error, r is the correlation coefficient, and N is the sample size.
3.4. Measuring Environmental Parameters
In order to measure environmental factors, a calibrated WBGT meter (Model Casella-1232342, Casella Co., London, England), a Kipp and Zonen solar radiometer (Model SR11-TR, Hukseflux Co., Netherlands), and an anemometer hot-wire (Model VT 50, Kimo Co., Canada) were used (17, 18).
3.5. Measuring Physiological Responses
Physiological responses were measured in two phases by calibrated instruments. In the first stage, after 20 and 30 minutes of rest, the workers’ physiological responses (i.e. core body temperature and heart rate) were measured. In the second stage, after 40 and 60 minutes of work in their workstations, the workers’ physiological responses were evaluated. Heart rate and tumble curtain temperature were measured respectively using (Model V800, Polar Co., Finland), and (Model FT 78, Beurer Co., Germany).
3.6. Measuring Heat Stress Indices
3.6.1. Environmental Stress Index
Moran et al. introduced ESI, which is calculated based on the measurement of dry temperature (Ta), relative humidity (RH), and solar radiation (SR) using Equation 2 (7).

3.6.2. Wet-Bulb Globe Temperature
According to the ISO 7243 standard, WBGT is computed based on the measurement of wet temperature (Tnw), globe temperature (Tg), and dry temperature (Ta) using Equations 3 and 4.
For outdoor workplace:

For indoor workplace:

It should be noted that all selected sites were thermally homogeneous (based on pre-test), and the measurements were made only in the lumbar region (1/1 m).
3.6.3. Wet-Bulb Dry Temperature
WBDT is computed by measuring dry temperature (Ta) and natural wet temperature (Tnw>) using Equation 5 (8).

3.6.4. Thermal Work Limit
This index presents the maximum amount of tolerable metabolism using five environmental parameters (dry temperature, wet temperature, radiation temperature, airflow velocity, and the barometric pressure of the environment) and considering clothing insulation. Accordingly, adapted individuals with proper hydration status could work in a particular thermal environment.
In the current study, TWL was calculated using a TWL calculator (9).
3.6.5. Heat Index
The two environmental parameters of relative humidity (RH) and dry temperature (Ta) are used to calculate HI based on Equation 6 (19):

3.6.6. Standard Effective Temperature
In this study, SET was calculated in the light of appropriate metabolism for each individual and clothing insulation (kv) using RayMan version 1.2 model (20).
3.6.7. Physiological Equivalent Temperature
Environmental temperature, vapor pressure, air velocity, and average radiant temperature of the surroundings are taken into account for calculating PET. This index was calculated by the use of RayMan version 1.2 model (12).
3.6.8. Physiological Strain Index
PSI, which was presented in 1998, examines the core temperature (T) and heart rate (HR) (21, 22). PSI is calculated through Equation 7.
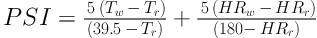
Where Tw is the core temperature in the working situation (°C), Tr is the core temperature in the resting situation (°C), HRw is the heart rate in the working situation (beat/min), HRr is the heart rate in the resting situation (beat/min), PSI has a range of 0 to 10, in increments of one unit.
3.6.9. Physiological Strain Index Based on Heart Rate
PSIHR is computed by taking into account the fluctuations of heart rate in the working and resting conditions Equation 8.
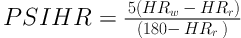
PSIHR has a range of 0 to 5 in increments of one unit (22).
3.7. Statistical Analysis
The collected data were analyzed by Statistical Package for Social Sciences (SPSS) V. 20 (SPSS Inc., Chicago, IL, USA) using statistical tests such as the Pearson correlation coefficient and linear regression.
4. Results
4.1. Mean and Standard Deviation of Environmental Variables
The mean and standard deviation of 30 environmental variables were measured in 10 selected stations. The results of t-test indicated that there was a significant difference in the mean scores of these environmental variables between various working stations (P < 0.0001). Air temperature, wet temperature, and dew point were higher in the side layer station than in the other stations. Globe temperature was higher in rail checking, but relative humidity was higher in the mixer station.
4.2. Mean and Standard Deviation of Physiological Parameters and Workers’ Metabolic Rate
The mean and standard deviation of physiological parameters (deep temperature, heart rate in resting condition, and heart rate in working condition) and the workers’ metabolic rates were determined in the 10 stations. The core body temperature in working condition was higher in the side layer station than in the other stations. The heart rate in working condition was higher in rail checking.
4.3. Mean Scores of ESI, WBGT, WBDT, TWL, HI, SET, PET, PSI, and PSIHR
Table 1 summarizes the mean scores of the indices in the 10 working stations. Accordingly, the highest values of ESI, WBGT, PSI, and PSIHR were computed in the side layer chut. It should be noted that there was a significant difference in the mean scores of these indices between various working stations (P < 0.0001).
| No. | Measurment Stations | ESI | WBGT | WBDT | TWL | HI | SET | PET | PSI | PSIHR |
|---|---|---|---|---|---|---|---|---|---|---|
| 1 | Beginning of side layer chut | 34.8 ± 0.82 | 33.2 ± 0.62 | 38.2 ± 0.82 | 163 ± 2.45 | 53 ± 0.82 | 35.1 ± 0.47 | 46 ± 0.82 | 4.8 ± 0.12 | 2.5 ± 0.16 |
| 2 | Grate bar supply | 32.2 ± 0.82 | 31.8 ± 0.82 | 35.02 ± 0.82 | 180.6 ± 3.68 | 46 ± 0.82 | 32.7 ± 0.82 | 41.4 ± 0.82 | 3.8 ± 0.29 | 1.99 ± 0.01 |
| 3 | Burners | 31.6 ± 0.47 | 31.9 ± 0.47 | 34.8 ± 0.82 | 187.3 ± 2.05 | 45.6 ± 0.47 | 32.5 ± 0.82 | 41.1 ± 0.82 | 4.1 ± 0.22 | 2.04 ± 0.04 |
| 4 | Slide rail checking | 33.02 ± 0.82 | 32.6 ± 0.82 | 35.7 ± 0.82 | 167 ± 1.63 | 47.3 ± 0.47 | 33.6 ± 0.82 | 42.9 ± 0.82 | 4.04 ± 0.04 | 2.01 ± 0.09 |
| 5 | Furnace corridor | 30.05 ± 0.82 | 29.2 ± 0.66 | 33.4 ± 0.82 | 221.6 ± 2.87 | 41.3 ± 0.47 | 30.9 ± 0.47 | 40 ± 0.82 | 3.3 ± 0.19 | 1.53 ± 0.12 |
| 6 | Furnace chamber | 23.3 ± 0.82 | 22.1 ± 0.82 | 24.4 ± 0.82 | 317.3 ± 2.05 | 28 ± 0.82 | 22.6 ± 0.59 | 26.1 ± 0.62 | 2.4 ± 0.45 | 0.77 ± 0.05 |
| 7 | Disk corridor | 28.1 ± 0.82 | 27 ± 0.82 | 29.1 ± 0.9 | 255.6 ± 4.5 | 34.3 ± 0.47 | 25.9 ± 0.41 | 31.9 ± 0.82 | 2.3 ± 0.05 | 0.7 ± 0.08 |
| 8 | Rate feeder | 27.8 ± 0.82 | 27.1 ± 0.82 | 29.4 ± 1.27 | 250 ± 8.1 | 35 ± 0.82 | 26.6 ± 0.82 | 32.1 ± 0.9 | 3.1 ± 0.09 | 1.23 ± 0.12 |
| 9 | Mixer | 28.6 ± 0.82 | 27.8 ± 0.82 | 29.6 ± 1.03 | 239.6 ± 4.1 | 36 ± 0.82 | 26.9 ± 0.82 | 32.5 ± 0.82 | 3.03 ± 0.05 | 1.1 ± 0.14 |
| 10 | Raw pellets alley | 25.8 ± 0.82 | 24.6 ± 0.82 | 27.3 ± 0.98 | 277 ± 2.45 | 30 ± 0.82 | 25.3 ± 0.82 | 31.2 ± 0.47 | 2.8 ± 0.16 | 0.9 ± 0.08 |
Mean and Standard Deviation of ESI, WBGT, WBDT, TWL, HI, SET, PET, PSI, and PSIHR Indices
4.4. The Correlation Between ESI and Environmental/Physiological Factors
The results of the correlation between ESI and environmental/physiological parameters and other indices are presented in Table 2. It is observed that the strongest correlation was recorded between ESI and dry temperature (r = 0.96), natural wet temperature (r = 0.96), and heart rate in working condition (HRw) (r = 0.94).
| Environmental / Physiological Parameters | Correlation (r) | R-Square (%) | Slope | P Value |
|---|---|---|---|---|
| Ta | 0.96 | 93.4 | 0.63 | < 0.0001 |
| Tg | 0.93 | 88.2 | 0.604 | < 0.0001 |
| Tnw | 0.96 | 92.5 | 1.184 | < 0.0001 |
| RH | 0.54 | 30 | -0.212 | < 0.0001 |
| Dp | 0.76 | 58.9 | 0.903 | < 0.0001 |
| SR | 0.36 | 13.5 | -0.007 | < 0.0001 |
| TW | 0.32 | 10.4 | 1.33 | < 0.0001 |
| Tr | 0.04 | 0.2 | 0.193 | < 0.0001 |
| HRW | 0.94 | 88.7 | 0.229 | < 0.0001 |
| HRr | 0.63 | 40.5 | 0.469 | < 0.0001 |
| WBGT | 0.98 | 97.4 | 0.941 | < 0.0001 |
| WBDT | 0.99 | 98 | 0.802 | < 0.0001 |
| TWL | 0.94 | 89 | - | < 0.0001 |
| HI | 0.97 | 94 | 0.424 | < 0.0001 |
| SET | 0.96 | 93.2 | 0.809 | < 0.0001 |
| PET | 0.96 | 93.5 | 0.534 | < 0.0001 |
| PSI | 0.85 | 72.3 | 3.687 | < 0.0001 |
| PSIHR | 0.91 | 83.8 | 5.181 | < 0.0001 |
The Results of the Relationship Between ESI and Environmental/Physiological Factors and Other Indices
5. Discussion
The present study aimed at comparing ESI with other heat indices including WBGT, WBDT, TWL, HI, SET, PSI, and PSIHR. To this end, data were collected from 30 workers in a pelletizing factory in southeastern Iran. The obtained results revealed strong, significant correlations between ESI and all the indices mentioned above (P < 0.0001).
The highest correlation coefficient was recorded between ESI and WBDT (r = 0.99) (Table 2). Another striking finding was that ESI had the strongest slope coefficients with PSI (a = 5.181) and PSIHR (a = 3.687). This shows that, in comparison with ESI, PSI and PSIHR experience fewer variations in different rates in various ranges of ambient conditions (Table 2).
The mean of the WBGT index for workers working in different stations (at the beginning of side layer chut, grate bar supply, burners, slide rail checking, and furnace corridors) was in line with the suggested values of ISO 7243 standard for an adapted individual (28°C) who is exposed to heat stress. The results also indicate that the obtained values for TWL in some of the stations (including at the beginning of side layer chut, grater supply, burners, and slide rail checking) were within the range of adaption zone (140 - 220). Thus, adapted individuals are allowed to work in these stations. The results further showed a strong correlation between ESI and TWL (r = 0.94). In addition, the recorded correlation between ESI and HI was 0.97. The mean scores of HI at the beginning of side layer chut, grate bar supply, burners, slide rail checking, and furnace corridor were within the risk range (41 - 54).
Saeidi and Arjmand sought to examine the effect of HI on human activities in the coastal area of Bushehr. The results indicated that for six months (from April to September), the HI is within the risk range (23). The obtained values for SET shows that the station at the beginning of side layer chut is located in the hot zone (35 - 41), while the furnace chamber is located in the comfortable zone (18 - 23).
The values of PET are within the very hot zone (PET > 41) for some stations including the beginning of side layer chut, grate bar supply, burners, and slide rail checking. It should be noted that, in this study, a strong, significant correlation was detected between ESI and PET (r = 0.96). This can be attributed to the influence of two environmental parameters, including dry temperature and relative humidity, on calculating the above-mentioned indices.
According to the obtained results, the values of PSI were within the low heat strain range at the beginning of side layer chut, grate bar supply, burners, and slide rail checking, whereas the values of PSIHR in the same stations were within the low strain range. The present study also investigated the correlation between WBGT and indices like PSI, PSIHR, and physiological parameters (heart rate and deep temperature). The results showed strong, significant correlations between WBGT and PSI (r = 0.85), PSIHR (r = 0.91), and heart rate in the working condition (HRw) (r = 0.94).
Jafari et al. demonstrated that the correlation coefficients of WBGT with PSI and PSIHR were 0.65 and 0.56, respectively (24). The results of the present study yielded stronger correlation coefficients. Similarly, Dehghan et al. studied heat stress among workers in the melting and casting industry by examining the role of environmental factors and physiological responses. They argued that despite moderate correlations between WBGT and ear canal temperature (r = 0.69) and PSI (r = 0.67), WBGT is not applicable in working stations with hot and dry conditions like melting and casting industries. Thus, assessing heat stress by the use of physiological parameters is more valid and reliable in such conditions (25). In the present study, the obtained correlation coefficients of WBGT with PSI and deep temperature (as measured through tumble curtain temperature) were 0.31 and 0.85, respectively.
Moran et al. studied the possibility of replacing ESI with WBGT. They discovered that the correlation coefficient between ESI and WBGT was 0.98, suggesting that ESI can be a good replacement for WBGT (15). Moreover, Hajizadeh et al. aimed at examining heat stress among outdoor occupations in hot areas and deserts (as identified based on meteorological data). They concluded that ESI is strongly correlated with WBGT (r = 0.98) (26). In this study, a similarly high correlation coefficient was discovered between ESI and WBGT (r = 0.98). In another study, Moran et al. examined ESI in hot-dry and hot-humid areas, concluding that the correlation coefficient between ESI and WBGT was 0.98 (27). The findings of our work also revealed a significant correlation between ESI and WBGT (r = 0.98).
Moran et al. examined the relationship between ESI and physiological parameters, demonstrating strong correlations between ESI and physiological parameters including deep temperature, heart rate, and PSI (0.97). They recommended further studies on the relationship between ESI and physiological parameters under various conditions (6). Besides, Moran et al. studied the association between ESI and physiological parameters, indicating a strong correlation between ESI and physiological parameters including heart rate, deep temperature, and sweating rate (0.83) (27). In the present study, the correlation coefficients of ESI with deep temperature, heart rate, and PSI were 0.85, 0.32, and 0.94, respectively (Table 2). In the current study, the relationship between ESI and deep temperature (Tr) was 0.32, while the correlation coefficient of the relationship between ESI and heart rate (HRw) was 0.94 (Table 2).
Habibi et al. also studied the relationship between ESI and infrared (IR), as a replacement for solar radiation, in indoor working environments. They demonstrated a strong correlation between ESI and WBGT (r = 0.96), a finding that is very similar to the results of this study (28). So far, many studies have been conducted to evaluate thermal stress scope among ESI and other thermal indices (WBGT, WBDT, TWL, HI, SET, PET, PSI, and PSIHR), but a few studies have precisely shown the correlation of these indices with the ESI in industrial environments. In addition, only a few indices have been compared in previous studies. Therefore, our study compared the correlation between ESI and a number of thermal indices in the workplace more than the number investigated in prior research and environmental parameters of the workplace were evaluated more precisely than they done in past studies.
5.1. Conclusion
The obtained results revealed strong correlation coefficients between ESI and heat indices including WBGT, WBDT, TWL, HI, SET, PET, PSI, and PSIHR. The highest coefficient was recorded for the relationship between ESI and WBDT. It should also be noted that there was a significant difference between ESI and other above-mentioned indices (P < 0.0001). Furthermore, strong correlations were detected between ESI and physiological parameters including heart rate in the working condition and environmental parameters including dry temperature, WBGT, natural wet temperature, and dew point. In some of the stations, the obtained mean scores for some indices were larger than the legitimate range. Thus, necessary measures should be taken to reduce heat stress and physiological strain among workers with regard to these indices.
