1. Background
In industries, especially paints, thinners, lacquers, and printing industries, exposure to solvents mixture is one of the most common kinds of exposure (1). The workers of the printing industry are potentially exposed to hazardous levels of solvents, inks, adhesives, organic and inorganic pigments, and polycyclic aromatic hydrocarbons. Organic solvents such as toluene and xylene are widely used as an industrial solvent in the composition of inks, adhesives, dilution solvents, and especially in cleaning solvents in the printing sector (2). Workers’ exposure to these solvents can occur through inhalation or skin absorption during the printing process (3).
Urine hippuric acid (HA) is the primary metabolite of toluene, given that around 80% of inhaled toluene is found in urine as HA and the urinary HA concentration depends on the level of toluene exposure (4). The principal urinary metabolites of ortho-, meta-, and para-xylenes (o-, m-, and p-xylene) are respectively considered to be ortho-, meta-, and para-methylhippuric acids (o-, m-, and p-MHAs). Numerous studies have shown the application of these biomarkers for biological monitoring in various fields of occupations (5). Moreover, occupational exposure limit (OEL) values in Iran refer to the urinary excretion of hippuric acid (HA) and methyl hippuric acid (MHA) as the biological indicators of exposure to toluene and xylene, respectively (6).
Toluene and xylene have not been classifiable as carcinogenic to humans (IARC group 3) asserted by the International Agency of Research on Cancer (7). However, chronic exposure to toluene and xylene may cause brain and neurobehavioral disorders in workers (8). In addition, there are significant health risks, such as dermatitis, cancers, neurological damage, as well as liver and renal impairments, that are associated with solvents and other chemicals and need to be considered in the printing industry (9).
Owing to the unique factors of each individual, environmental monitoring of workers exposed to toluene and xylene will not precisely evaluate the actual exposure level. Consequently, biological monitoring, which is commonly performed by urinalysis, is more helpful in occupational health care programs when workers are exposed to organic solvents (4).
2. Objectives
There is evidence regarding the determination of metabolite concentrations of toluene and xylene in some occupational settings (10-12). To the best of our knowledge, so far, no study has been conducted in Iran on printing workers in order to consider occupational exposure to toluene and xylene and their relationship with exposure biomarkers. Hence, this study attempted to determine the urinary metabolites of toluene and xylene in occupationally exposed workers of the printing industry.
3. Methods
3.1. Subjects
This retrospective cohort study was performed using urine samples from 84 subjects; 44 printing workers (34 males and 10 females) aged 31.30 ± 4.86 years who were exposed to solvent mixtures composed mainly of toluene and xylene, compared to 40 office employees (31 males and nine females) aged 32.30 ± 8.00 years as control subjects who were non-exposed occupationally to the mentioned solvents. The exposed group was composed of all workers from the sectors of offset and gravure printing, lamination, glue, and platemaking who were working at least for one year in two printing factories in Birjand, Iran. Age, BMI, blood pressure, smoking habit, and work experience were recorded by a questionnaire.
3.2. Ethics
The study protocol was approved by the Ethics Committee on Medical Research of Zahedan University of Medical Sciences in Zahedan, Iran (No. IR.ZAUMS.REC.2016.85). All participants gave written informed consent to participate in the study.
3.3. Monitoring of Solvent Exposure, and Urinalysis for Hippuric Acid, Methyl Hippuric Acids, and Creatinine
To determine the concentration of toluene and xylene isomers in the breathing air, the personal, 8-h time-weighted average (TWA) exposure of each worker was monitored by activated carbon tubes (SKC, 226-01) and analyzed by gas chromatography (Agilent GC-FID, 7890A) in accordance with analytical method No. 1501 of the National Institute for Occupational Safety and Health (NIOSH) (13). According to the method used, the limit of detection (LOD) was 0.1 ppm, common to air-borne organic solvents.
Urine samples (50 mL) from both the groups were collected at the end of a shift after two days of exposure to toluene and xylene and analyzed for urinary metabolites and creatinine. The samples were stored in polyethylene bottles containing 0.1 g crystals of thymol and refrigerated at 4°C until analysis. The quantification of the levels of urinary metabolites was carried out by high performance liquid chromatography (HPLC) using a Knauer C18 column and a UV detector for the simultaneous determination of hippuric acid (HA) and methyl hippuric acids (o-, m-, and p- MHAs) as the principal metabolites of toluene and xylene, respectively, according to NIOSH analytical method No. 8301 (14).
Based on this method, an aliquot of 1 mL urine sample was transferred to a 10 mL glass vial with a screw cap. The sample was acidified with 80 µL of hydrochloric acid (6 N). After vortexing, 0.3 g of sodium chloride was added and then the extraction was done with 4 mL of ethyl acetate. The sample was mixed and centrifuged for 5 min at 1500 g for phase separation. 200 µL of the upper organic phase was transferred to an autosampler vial. The solution was then evaporated to dryness using a heated water bath (35°C) with a gentle stream of nitrogen before reconstitution. The residue was dissolved in 200 µL of distilled water and 10 µL was injected to the HPLC system. The mobile phase was a mixture of distilled water, acetonitrile, and glacial acetic acid at the volume ratio of 84:16: 0.025 at a flow rate of 1.5 mL/min. According to the method used to quantify these metabolites, the limits of detection was 4 μg/mL for HA, 5 μg/mL for o-MHA, and 6 μg/mL for m and p-MHA.
3.4. The Calibration Curves for Urinary Metabolites
The calibration curves for the mixture of urinary HA and o-, m- and p-MHA were obtained from mixed working standard solutions using a stock solution. Six calibration standards with concentrations ranging from 10 to 1000 µg/mL were prepared from these working standard solutions by diluting with distilled water. The peak areas for HA and o-, m- and p- MHA were used for plotting the calibration curves.
3.5. The Accuracy and Precision of the Method
A pooled unexposed urine sample was spiked to HA and o-, m- and p-MHAs and analyzed in five replicates at six different concentration levels from 10 to 1000 µg/mL for determining the within-day and between-day accuracy and precision of the method. The relative standard deviations (RSDs) were calculated for three days. The recovery of these metabolites was 96% with RSDs of less than 2%.
The urinary creatinine was measured by a colorimetric method using commercial laboratory kits (Roche/Cobas Integra 400 analyzer; Roche, Germany) and the levels of the urinary metabolites were reported following correction for creatinine concentration.
3.6. Statistical Analysis
Data analysis was performed using STATA version 11. Independent samples t-tests and chi-square test were used to compare the means and proportions between the two groups. Furthermore, scatter plots and Pearson’s correlation coefficients and tests were employed to assess the relationship between quantitative variables. Linear multiple regression models were fitted to assess the relationship between outcome and predictors after controlling for confounding variables. The data were expressed as means ± standard deviation (SD). The differences were considered significant at P < 0.05.
4. Results
The demographic characteristics of the study group are presented in Table 1. There was no significant difference in the mean of age, BMI, blood pressure, and urine creatinine, as well as in the proportions of gender and smoking habit, between printing workers and the non-exposed control group (P > 0.05). None of the study subjects consumed alcohol.
| Variables | Non-Exposed Group (N = 40) | Exposed Group (N = 44) | P Value |
|---|---|---|---|
| Age, y | 32.30 ± 8.00 | 31.30 ± 4.86 | 0.495 |
| Body mass index, Kg/m2 | 24.58 ± 3.94 | 23.26 ± 3.73 | 0.119 |
| Work experience, y | 8.60 ± 6.40 | 6.98 ± 4.85 | 0.198 |
| Urine creatinine, mg/dL | 140.74 ± 68.93 | 149.91± 53.89 | 0.497 |
| Systolic blood pressure, mmHg | 112.50 ± 9.81 | 112.84 ± 9.96 | 0.875 |
| Diastolic blood pressure, mmHg | 71.10 ± 9.42 | 71.02 ± 10.32 | 0.992 |
| Non-smokers, No. (%) | 37 (92.5) | 35 (79.5) | 0.090 |
| Male, No. (%) | 31 (77.5) | 34 (77.3) | 0.980 |
The Characteristics of the Non-Exposed Control Group and Exposed Group (Printing Workers)a
The TWA exposure levels of toluene and each of the three isomers of xylene in the breathing zone of printing workers are shown in Table 2. The workers were exposed primarily to toluene (37.64 ± 24.09 ppm). The mean concentrations of o-, m-, and p-xylene were less than the current occupational exposure limit value (100 ppm) ascertained by the American Conference of Governmental Industrial Hygienists (ACGIH). Furthermore, xylene exposure for individual isomers showed that the leading isomer was p-xylene (51.20 ± 33.01 ppm) and the average levels of m-xylene and o-xylene were nearly equal to each other (35.94 ± 20.05 ppm and 29.22 ± 14.40 ppm, respectively).
The Exposure Levels of Toluene and Xylenes in the Breathing Air of Printing Workers
The urinary metabolite levels of toluene and xylene isomers, established as urinary biomarkers of exposure, in the exposed group (printing workers) and non-exposed subjects are presented in Table 3. The results indicated statistically significant differences in the levels of urinary hippuric acid (HA) between printing workers and the control group (P < 0.001). Although urinary HA levels in the exposed group were higher, they were very lower than the biological exposure indices (BEIs) values (1.6 g g-1 creatinine) determined by the ACGIH. Similarly, the levels of o-MHA and m- and p-MHA in urine, as exposure biomarkers of xylene, in the exposed group were lower than the BEI values (1.5 g g-1 creatinine). The analysis of urine samples showed that the non-exposed group did not present the urinary biomarkers of o-, m- and p- MHA, and only was HA found in the urine of these subjects.
The Comparison of the Levels of Exposure Biomarkers to Toluene and Xylenes in the Urine Samples of Printing Workers and Control Subjects
The correlations between exposure to airborne toluene and xylene isomers and the levels of urinary biomarkers in the exposed group are shown in Table 4.
| Variables | HA (g/g Creatinine) | o-MHA (g/g Creatinine) | m- and p-MHA (g/g Creatinine) |
|---|---|---|---|
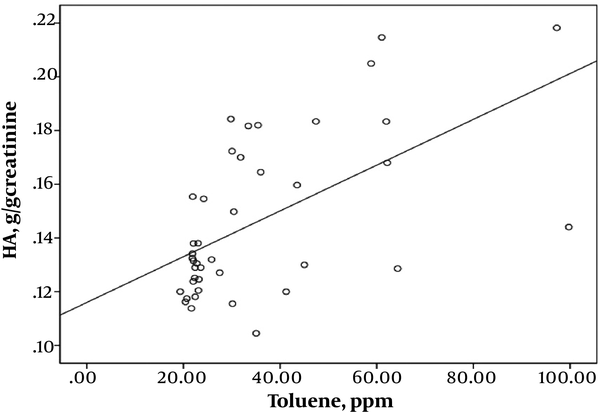
| Toluene, ppm | r = 0.567; P < 0.001 | NS | r = 0.461; P = 0.002 |
| o-xylene, ppm | NS | NS | NS |
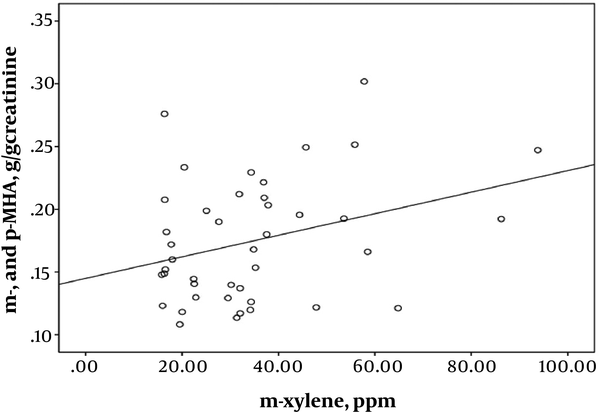
| m-xylene, ppm | NS | NS | r = 0.320; P = 0.039 |
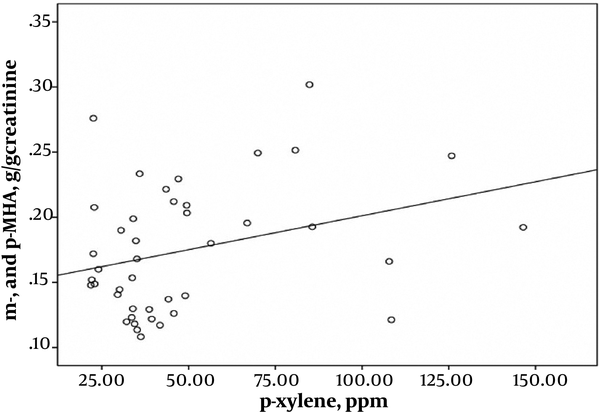
| p-xylene, ppm | r = 0.299; P = 0.049 | NS | r = 0.313; P = 0.043 |
Correlation Coefficients Between Exposure to Airborne Toluene and Xylenes and Exposure Biomarkers in the Urine of Printing Workers (N = 44)a
Pearson’s correlation coefficient analysis indicated highly significant correlations between exposure intensity to solvents and urinary biomarkers of exposure. A strong correlation was found between the toluene exposure levels and the urinary HA levels (r = 0.543; P < 0.001) (Figure 1). Toluene exposure was also correlated positively with the levels of urinary biomarkers (m- and p-MHA) while no significant correlation with the urinary o-MHA levels was observed. The correlations were also found between urinary biomarker levels of m- and p-MHA and m-xylene levels (r = 0.337; P = 0.025) (Figure 2) and p-xylene levels (r = 0.322; P = 0.033) (Figure 3). We also found no significant correlation between o-xylene levels and the levels of urinary MHA biomarker (P > 0.05). The results of multiple regression models indicated that confounding factors such as age, gender, and smoking did not have any significant impact on the level of urinary metabolites in the exposed group.
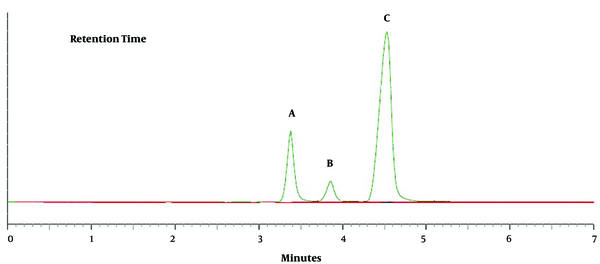
The chromatograms of HA, o- MHA, and m- and p-MHA are shown in Figure 4. All the metabolites were completely separated within five minutes. The retention times were 3.4 minutes for HA, 3.9 minutes for o-MHA, and 4.7 minutes for m- and p-MHA.
Chromatograms of the three metabolites; A, hippuric acid (HA); B, o-methyl hippuric acid (o-MHA); and C, m- and p-methyl hippuric acid (m- and p-MHA) extracted from a working standard solution with a concentration of 400 µg/mL. The peaks and retention times are 3.4 minutes for HA, 3.9 minutes for o-MHA, and 4.7 minutes for m- and p-MHA.
5. Discussion
As a standardized protocol, biomonitoring (I) determines the existence of occupational exposure; (II) quantifies the exposure dose (internal, effective, or cumulated); and (III) ascertains whether exposure limits are respected or not (16). In this line, the present study evaluated the simultaneous determination of hippuric acid and o-, m- and p-methylhippuric acids in the urine samples of printing workers.
The results of the study displayed that toluene concentrations in the breathing air were 1.8-fold higher and the exposure levels of xylene isomers were below the values recommended by the ACGIH (15). This finding confirms the high-level exposure of the printing workers to toluene. Toluene concentrations in the air ranged from 19.33 to 132.67 ppm; the highest exposure to toluene and xylene was found in the offset printing sector compared to the gravure-printing sector.
Previous studies have also found high levels of toluene in the air (ranging from 0.14 to 919 mg/m3) among rotogravure printing workers (17, 18). Some studies have observed that the cleaning activities followed in the offset printing presses can lead to solvent exposure up to 10 times that of other activities; besides, the exposure level of printing workers depends on the number of cleaning steps and changing stages of press plats (19). In this study, the most commonly used compounds in cleaning solvents were petroleum and gasoline applied in cleaning the offset printing presses, but the main component of cleaning solvents in gravure printing was ethyl acetate. It is reported that toluene and mixtures of the three isomers of xylene are extensively used as a solvent in petroleum and gasoline additives (20).
The results of the biological monitoring of toluene and xylene indicated that the levels of urinary hippuric acid (HA) and o-, m-, and p-methyl hippuric acids (MHAs) in the exposed group were very low, and all the biomarkers of exposure were lower than the biological exposure index (BEI) recommended by ACGHI (21). However, this study found higher concentrations of HA in printing workers when compared to the non-exposed group (P < 0.001). These results are similar to study findings that demonstrated low concentrations of urinary HA among printing workers and observed that only 8% of the workers had HA concentrations of higher than the BEI as suggested by ACGIH (17). It has been proposed that the validity of urinary markers such as o-CR and HA to monitor TWA toluene exposure will be reduced when the toluene concentration is low (e.g., in the range of less than 50 ppm). However, it has been pointed out that un-metabolized toluene in urine and blood samples, as biological indicators of low-level exposure to toluene (e.g., in the range of 10 ppm or less), could be a more specific biomarker than HA (22).
Other studies have also reported low levels of biomarkers of exposure for toluene (i.e. HA) and xylene (i.e. MHA) in painters occupationally exposed to these two solvents (23). It was observed that in combined exposure of toluene and xylene, the extent of urinary biomarkers decreased by 20% - 30% for HA and by 40% for MHA. This can be due to the antagonistic activity of solvents that is related to the competitive activity on cytochrome P-450 (CYP- 450), the major component leading to the biotransformation of organic solvents (24).
In the current study, the low levels of each of the xylene isomers can also be corroborated by the low levels of their urinary metabolites, o-MHA and m- and p-MHA. It should be recalled that slight HA concentrations were found in the urine of the non-exposed group. This is probably due to the dietary intake of benzoic acid or benzoates, which are biotransformed to toluene metabolites (23). There is evidence suggesting that the typical excretion of HA in non-exposed individuals is 1.0 g-1g creatinine, and MHA isomers are not found in non-exposed individuals (14).
Moreover, the present study found correlations between exposure to airborne toluene and xylene isomers and the levels of urinary biomarkers. A strong positive correlation was found between urinary excretions of HA and airborne toluene values (Figure 1). Additionally, the low concentrations of urinary MHA (m- and p-MHA) were significantly correlated with the isomers of m-xylene (Figure 2) and p-xylene (Figure 3) in printing workers. These findings are in accordance with the previous studies that demonstrated exposure to toluene (18, 25) and xylene (10, 20) correlates significantly with the low-level of urinary metabolites of these solvents. It has also been pointed out that the unmetabolized concentrations of toluene and xylene in the blood (23, 26) and urine (27, 28) correlate significantly with low-level exposure to each solvent. The results of this study showed that the urinary level of m- and p-MHA was slightly higher than that of o-MHA. However, a study conducted by Kawai et al. revealed that the slopes of the regression lines for the isomers of o- and m-xylene were similar, whereas that for p-xylene was greater (29).
The results of this study also displayed a significant correlation between working years in the printing industry and urinary levels of HA (r = 0.363, P = 0.02) and each of the isomers of m- and p-MHA (r = 0.307, P = 0.04) and o-MHA (r = 0.332, P = 0.03) in the exposed group. It should be added that confounding factors such as age, sex, BMI, and smoking habit did not have any statistically significant effect on the low levels of HA and MHA isomers in the urine of the exposed group (P > 0.05). This was probably because none of the printing workers was a heavy smoker when heavy smoking was defined as the consumption of > 10 cigarettes/day (22).
Our study is consistent with a previous study that found no significant interaction between the urinary metabolites of toluene and xylene isomers and the confounders of age and sex among workers exposed to these solvents (27). While, in some studies, cigarette smoking has not been a factor affecting the urinary metabolites of toluene (10, 12, 18, 25) and xylene (10, 20), others have reported a significant difference in the urinary MHA levels between smokers and non-smokers who were exposed to xylene in the workplace (30).
In the printing factories under study, there was a lack of engineering control such as using local exhaust ventilation, and personal protective equipment was inadequate for protecting the safety and health of the workers. In addition, most solvent components were not described in the safety data sheets (SDSs) of solvents or on the label of containers.
In conclusion, the results revealed that even though all the urinary biomarkers of exposure were lower than the biological exposure limits, the concentrations of HA and MHAs were increased in printing workers when compared to non-exposed subjects. Therefore, monitoring occupational exposure to toluene and xylene is helpful in identifying and following up the affected workers in the printing industry.


