


1. Background
Hepatic encephalopathy (HE) is a type of brain dysfunction characterized by the disturbance of nitrogen metabolism that is caused by acute and chronic liver dysfunction or portal-systemic shunts (1). It can be divided into three types: type A is induced by acute liver failure; type B is typically induced by portal-systemic shunts; and type C, the most common type of HE, is usually associated with hepatic cirrhosis and portal hypertension, with or without portal-systemic shunts.
The pathogenesis of HE remains unclear. Previously, hyperammonemia has been widely recognized as the main cause of the neurological alterations of HE. In recent year, manganese (Mn), serving as an essential trace element for metabolism and a coenzyme of glutamine synthetase (GS) (2), has been increasingly proposed to be a potential target for the development of HE since brain Mn accumulation in HE has been identified (3-6). Studies have shown that both ammonia and Mn participate in the brain ammonia metabolism through the glutamine/glutamate cycle by regulating the GS activity of astrocytes in HE (7-9).
Glutamine (GLN) is a product of the glutamine/glutamate cycle that is catalyzed by GS to condense glutamate (GLU) and ammonia into GLN. Hyperammonemia leads to the excessive uptake of ammonia by astrocytes, forming abundant GLN under the catalysis of GS. Astrocytes are the cells most affected by both the accumulation of Mn and ammonia. Accumulation of brain Mn can also increase GLN accumulation in the brains of cirrhotic rats (10). In addition, studies have shown that Mn and ammonia produce similar effects, such as inhibition of GLU transport (11, 12) and astrocytic morphological changes, leading to Alzheimer type II astrocytosis (13, 14). Furthermore, Mn and ammonia can act synergistically, and Mn exerts its effects on hepatic cirrhosis via ammonia and GLN (Figure 1) (15).
.")
Metabolic pathways related to the effect of Mn and ammonia on glutamine/glutamate cycle. *, Hyperammonemia and low Mn deposition can enhance GS activity while high Mn deposition inhibits GS activity (Mn, manganese; GS, glutamine synthetase).
However, the interaction between brain Mn and ammonia or whether brain Mn or brain ammonia accumulation will regulate the content of each other is still unknown. Moreover, magnesium (Mg) plays a neuroprotective role in eclampsia-like seizure rats via significantly reducing the response of inflammatory cytokines in the cerebrospinal fluid (16). Our previous study found that Mg could reduce intestinal Mn absorption and reduce brain Mn deposition in portal-systemic shunt encephalopathy (PSE) rats (17).
2. Objectives
In this study, we constructed rat models of minimal HE (MHE), chronic manganism (CHM) and chronic hyperammonemia (CHA) to induce the accumulation of Mn and/or ammonia in the brain, used magnesium sulfate to reduce brain Mn deposition, and aimed to investigate the interaction between brain Mn and ammonia in HE rats.
3. Methods
3.1. Ethics Statement
This study was a conditional control study, which was approved by the Institutional Review Board of Jinshan Hospital, Fudan University. All procedures, including animal studies, were in accordance with the guidelines of the Institutional Animal Care and Use Committee of Fudan University.
3.2. Animals and Experimental Treatments
A total of 48 female Sprague-Dawley (SD) rats (180 - 200 g, Jiesijie Laboratory Animal Co. LTD, Shanghai, China) were randomly divided into the following four groups: the control group (n = 6); the MHE group (n = 18); the CHM group (n = 12); and the CHA group (n = 12). Specifically, MHE rats were induced by intraperitoneal injection of thioacetamide (TAA, Sigma-Aldrich, St. Louis, MO, USA) twice a week at a dosage of 250 mg/kg of body weight in normal saline for eight weeks. TAA could lead to periportal infiltration and pronounced ductal proliferation. This method has been widely used to induce liver fibrosis. The CHM rats were induced by oral administration of MnCl2·4H2O (Sigma-Aldrich, St. Louis, MO, USA) at a dosage of 20 mg/kg/day for seven weeks. The CHA rats were induced by oral administration of ammonium acetate at a dosage of 30 mg/kg/day for seven weeks.
Moreover, six rats were randomly selected from the MHE group and subjected to the following behavioral tests: Morris water maze (MWM), Y maze, and narrow beam walk test (NBT). The remaining 12 rats of the MHE group and all the rats of the CHM and CHA groups were randomly divided into two subgroups, according to the MgSO4 treatment (oral administration at a dosage of 496 mg/kg/day for seven weeks): (1) MHE-7W (without treatment, n = 6) and MHE + Mg-7W (MgSO4 treatment, n = 6); (2) CHM-7W (without treatment, n = 6) and CHM + Mg-7W (MgSO4 treatment, n = 6); and (3) CHA-7W (without treatment, n = 6) and CHA + Mg-7W (MgSO4 treatment, n = 6) (Figure 2).
.")
Study grouping and treatment (SD: Sprague-Dawley; MHE, minimal hepatic encephalopathy; CHM, chronic manganism; CHA, chronic hyperammonemia; TAA, thioacetamide).
The rats were kept in a room under standard environmental conditions: a 12 - 12 h light/dark cycle, a temperature of 23 ± 1°C, and food and deionized water available ad libitum. Each rat was placed in a metabolic cage. The weight of the rat, the amount of food and water consumption, and the fecal weight of each rat were recorded.
3.3. Behavioral Assessment of MHE Rats
Morris water maze (MWM) was used to evaluate the spatial learning and memory of rats (18). The escape latency to reach the platform was recorded. The number of entries in the novel arm of Y maze (NENY) was recorded to evaluate spatial recognition memory. The latency and the total time of the NBT were recorded. Therefore, MWM, Y maze, and NBT were performed according to the previous protocols (17-20).
3.4. Blood Ammonia, Brain Mn, Mg, and Fecal Mn Content Measurements
Rats were anesthetized by intraperitoneal injection of 2% pentobarbital sodium (0.25 mL/100g), and 1 mL of blood was drawn from the ventriculus dexter for assessing blood ammonia level (Vitros350, Johnson & amp, NJ, Johnson, USA). Then, rats were sacrificed by cervical dislocation and transcardially perfused with cold saline. The brain was removed, washed in distilled water, dried and were separated according to an anatomical atlas. The tissue samples were frozen at -80°C. The fecal samples (approximately 0.1 g) from CHM and CHA rats were collected and dried at each time point for all rats. The contents of Mn and Mg in the brain and feces were measured using an inductively coupled plasma (ICP) spectrometer.
3.5. Enzyme Activity Assay
The tissue samples (approximately 0.1 g) were weighed and homogenized. The levels of GS activity and GLN content in the brain were quantified using corresponding kits in accordance with the instructions (Jiancheng Bioengineering Company, Nanjing, China).
3.6. Immunohistochemical Analyses
The brain was immersed in a fixed solution (4% paraformaldehyde) for 24 h. The samples were dehydrated in graded aqueous solutions of ethanol from 50% to 95% (for 10 min each), followed by 100% ethanol (three times, 10 min/time). Paraffin-embedded tissues were serially sectioned (4 microns). Immunohistochemistry was performed according to previous protocols (17). Sagittal sections of tissue were examined for the presence of GS (rabbit polyclonal antibody; Abcam, United States). Images under 20 × magnification were captured with a digital camera (Olympus BX43, Tokyo, Japan).
3.7. Statistical Analysis
Data were analyzed with SPSS 21.0 for Windows (SPSS Inc., Chicago, IL, USA). One-way analysis of variance (ANOVA) with a Bonferroni correction was used to compare the differences among groups. All values are presented as the mean ± standard deviation. A P-value of less than 0.05 was considered statistically significant.
4. Results
4.1. Behavioral Assessment of MHE Rats
The escape latency on MWM gradually decreased with increasing training time in control rats. A significantly longer escape latency on days 3, and 4 was observed in MHE rats than in control rats. NENY was significantly reduced in MHE rats compared with control rats. A significantly longer latency and total time in NBT were observed in MHE rats than in control rats. Behavioral assessment results indicated that the rats had minimal cognitive and motor dysfunction, and subsequently, the MHE model was successfully constructed (Table 1).
| Groups | The Escape Latency of Morris Water Maze | Y Maze | Narrow Beam Test | ||||
|---|---|---|---|---|---|---|---|
| Day 1, s | Day 2, s | Day 3, s | Day 4, s | NENY, Times | Latency, s | Total Time, s | |
| MHE | 60 ± 0 | 52.12 ± 10.05 | 44.67 ± 3.78B | 38.5 ± 6.4B | 9 ± 1.26B | 9.98 ± 2.94A | 31.58 ± 8.5B |
| Control | 60 ± 0 | 44.28 ± 4.12 | 30.17 ± 3.43 | 9.8 ± 2.5 | 12.83 ± 1.17 | 4.1 ± 1.33 | 10.05 ± 1.15 |
4.2. Brain Mn and Magnesium Contents
The Mn content in basal ganglia was significantly higher in MHE, MHE-7W, CHM-7W, and CHM + Mg-7W rats than in control rats; it was lower in MHE + Mg-7W rats than in MHE rats and MHE-7W rats, and in CHM + Mg-7W rats than in CHM-7W rats. The Mn content in the hippocampus was significantly higher in MHE, MHE-7W, MHE + Mg-7W, CHM-7W, and CHM + Mg-7W rats than in control rats; it was significantly lower in MHE + Mg-7W rats than in MHE-7W rats. The Mn content was significantly higher in CHM-7W and CHM + Mg-7W rats than in control rats in the cortex, and in MHE, MHE-7W, CHM-7W, and CHM + Mg-7W rats than in control rats in the cerebellum. No significant difference in Mn content was found among CHA-7W, CHA + Mg-7W rats, and control rats (Figure 3A-D).

Brain Mn content in A, basal ganglia; B, hippocampus; C, cortex; D, cerebellum; E, brain Mg content in basal ganglia; F, hippocampus; G, cortex; and H, cerebellum. Six rats in each subgroup, *, P < 0.05; **, P < 0.01; ***, P < 0.001, compared with control rats, #, P < 0.05; ##, P < 0.01; ###, P < 0.001, compared with untreated groups, including MHE-7W, CHM-7W, and CHA-7W rats. The P value is calculated using one-way ANOVA with a Bonferroni correction. NC, control group; MHE, MHE rats for evaluating the HE model; MHE-7W, MHE rats without treatment for 7 weeks; MHE + Mg-7W, MHE rats treated with MgSO4 for 7 weeks; CHM-7W, CHM rats without treatment for 7 weeks; CHM + Mg-7W, CHM rats treated with MgSO4 for 7 weeks; CHA-7W, CHA rats without treatment for 7 weeks; CHA + Mg-7W, CHA rats treated with MgSO4 for 7 weeks.
No significant difference in Mg content was found before and after Mg treatment (Figure 3E-H).
4.3. Blood Ammonia
Blood ammonia levels were significantly higher in MHE, MHE-7W, CHM-7W, CHM + Mg-7W, CHA-7W, and CHA + Mg-7W rats than in control rats, and were significantly lower in MHE + Mg-7W rats than in MHE-7W rats, in CHM + Mg-7W rats than in CHM-7W rats, and in CHA + Mg-7W rats than in CHA-7W rats (Figure 4).

Blood ammonia levels in different groups
4.4. GS Activity
A significantly higher GS activity was observed in MHE, MHE-7W, MHE + Mg-7W, CHM-7W, and CHA-7W rats than in control rats, respectively, in basal ganglia, hippocampus, and cortex. Moreover, GS activity was significantly lower in CHA + Mg-7W rats than in CHA-7W rats in the hippocampus and cortex. No significant difference was found in the hippocampus and cortex among CHM + Mg-7W, CHM-7W and control rats, or in basal ganglia between CHM + Mg-7W and CHM-7W rats (Figure 5A-C).

GS activity in A, basal ganglia; B, hippocampus; and C, cortex. GLN content in D, basal ganglia; E, hippocampus; and F, cortex
4.5. GLN Content
The GLN content in basal ganglia was significantly higher in MHE, MHE-7W, MHE + Mg-7W, CHM-7W, CHA-7W and CHA + Mg-7W rats than in control rats. The GLN content in basal ganglia was lower in MHE + Mg-7W rats than in MHE-7W rats, and in CHM + Mg-7W rats than in CHM-7W rats. The GLN content in the hippocampus was significantly higher in CHM-7W, CHA-7W, and CHA + Mg-7W rats than in control rats; was lower in CHM + Mg-7W rats than in CHM-7W rats, and in CHA + Mg-7W rats than in CHA-7W rats. The GLN content in the cortex was significantly higher in MHE, MHE-7W, CHM-7W, CHA-7W, and CHA + Mg-7W rats than in control rats, while it was lower in CHM + Mg-7W rats than in CHM-7W rats, and in CHA + Mg-7W rats than in CHA-7W rats (Figure 5D-F).
4.6. GS Immunohistochemistry
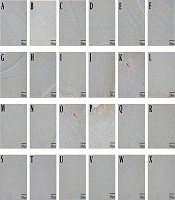
The number of GS-positive cells was higher in MHE, CHM and CHA rats than in control rats. The number of GS-positive cells was lower in MHE + Mg-7W rats than in MHE-7W rats, in CHM + Mg-7W rats than in CHM-7W rats, and in CHA + Mg-7W rats than in CHA-7W rats (Figures 6).
, MHE (B), MHE-7W (C), MHE + Mg-7W (D), CHM-7W (E), CHM + Mg-7W (F), CHA-7W (G), CHA + Mg-7W (H); in cortex: Control group (I), MHE (J), MHE-7W (K), MHE + Mg-7W (L), CHM-7W (M), CHM+Mg-7W (N), CHA-7W (O), CHA + Mg-7W (P); in basal ganglia. Control group (Q), MHE (R), MHE-7W (S), MHE + Mg-7W (T), CHM-7W (U), CHM + Mg-7W (V), CHA-7W (W), CHA + Mg-7W (X).")
GS immunohistochemistry in hippocampus: Control group (A), MHE (B), MHE-7W (C), MHE + Mg-7W (D), CHM-7W (E), CHM + Mg-7W (F), CHA-7W (G), CHA + Mg-7W (H); in cortex: Control group (I), MHE (J), MHE-7W (K), MHE + Mg-7W (L), CHM-7W (M), CHM+Mg-7W (N), CHA-7W (O), CHA + Mg-7W (P); in basal ganglia. Control group (Q), MHE (R), MHE-7W (S), MHE + Mg-7W (T), CHM-7W (U), CHM + Mg-7W (V), CHA-7W (W), CHA + Mg-7W (X).
5. Discussion
To explore the possibility of an interaction between brain Mn and ammonia in HE, we used TAA to induce an MHE rat model. This model was constructed for the most common type of HE, type C HE. Brain Mn accumulation has been confirmed in HE (5, 6). In addition to the commonly recognized ammonia, Mn has been found to play an important role in the development of HE. Furthermore, we constructed CHM and CHA rat models in which brain Mn or ammonia is considered an independent pathogenic factor. Consequently, the roles of Mn, ammonia and their interaction can be separately investigated in CHM and CHA rat models and can be comprehensively investigated in the MHE model.
In CHA rats, blood ammonia levels and GLN content were higher than in control rats. The brain Mn content showed no significant difference between CHA rats and control rats. The results indicated that the increase in ammonia did not lead to an increase in the brain Mn content. After MgSO4 treatment, blood ammonia levels and GLN content decreased in CHA rats. The brain Mn content showed no significant difference between CHA + Mg and CHA rats. The results indicated that the decrease in ammonia did not lead to a decrease in the brain Mn content. Our study suggests that the change in the ammonia level does not affect the content of brain Mn.
In CHM rats, the brain Mn content was significantly higher than in control rats. Blood ammonia level and brain GLN content were also higher in CHM rats than in control rats. The results indicated that the increase in brain Mn content could lead to an increase in blood ammonia levels and brain GLN contents. After MgSO4 treatment, brain Mn content significantly decreased in basal ganglia in CHM rats. Blood ammonia level and brain GLN content in basal ganglia were also lower in CHM + Mg-7W rats than in CHM-7W rats. The results indicated that the decrease in brain Mn content could lead to decreases in blood ammonia level and brain GLN content. However, brain Mn contents in the cortex and hippocampus were not significantly lower in CHM + Mg-7W rats than in CHM-7W rats. This might be because the treatment duration was not long enough, and the dose of Mg was relatively low. Our study suggests that changes in brain Mn content can affect the ammonia level.
The brain Mn content was higher in basal ganglia than in the hippocampus, cortex, and cerebellum in all rats. This finding was consistent with the findings of previous studies that have shown basal ganglia is the main site affected by Mn deposition in the brain (21, 22). This finding could also explain the results that only brain Mn content in basal ganglia was significantly decreased after MgSO4 treatment in CHM and MHE models.
Our results also showed that MgSO4 could decrease blood ammonia levels and brain GLN content. As the brain Mg content showed no significant difference among groups, we speculated that a direct impact of MgSO4 on decreasing ammonia was less likely. As we concluded above, the change in ammonia level did not affect brain Mn content, while the change of brain Mn content affected the ammonia level. By further considering previous studies (17, 23), which revealed that MgSO4 could significantly increase fecal Mn excretion to reduce brain Mn content, we speculated that MgSO4 decreased the blood ammonia level and brain GLN content by increasing the amount of fecal Mn excretion to decrease the brain Mn content and by regulating brain GS activity.
Previous studies have demonstrated that both Mn and ammonia can regulate GS activity (8, 17). The GS activity was significantly higher in CHA groups than in the control group in basal ganglia, hippocampus, and cortex, which was consistent with previous studies (24, 25). Considering that no significantly different Mn contents were found between the CHA group and the control group, we speculated that the higher GS activity was related to hyperammonemia rather than a high Mn content. In addition, the GS activity in the hippocampus and cortex significantly decreased in CHA rats after MgSO4 treatment. These results indicated that MgSO4 decreased the blood ammonia level by downregulating brain GS activity. The GS activity showed no significant differences in the CHM groups (except the CHM-7W group in the basal ganglia) compared with the control group. The results were in accordance with those of previous studies, which showed that relatively high brain Mn deposition significantly inhibited GS activity (10, 26). Furthermore, the GS activity in the CHM groups showed no significant differences after MgSO4 treatment. This may be because the originally low GS activity in the CHM-7W group could not be further decreased; however, a previous study showed that Mg could also regulate the activity of GS (27). Therefore, the effect of Mg on GS activity could be ignored in this study because the Mg content showed no significant difference among groups.
Changes in the brain GS activity resulted in changes in brain GLN content. Indeed, GLN is a product of the glutamine/glutamate cycle that can reflect brain ammonia contents. The GLN contents in the hippocampus and cortex in CHA groups were significantly increased, while the brain Mn content showed no significant difference compared with the control group. These results further confirmed that the increasing brain ammonia level could not increase the brain Mn content. In contrast, the reduction in the brain Mn content could reduce the brain ammonia content, as the GLN content was significantly lower in the CHA + Mg-7W group than in the CHA-7W group, and in the CHM + Mg-7W group than in the CHM-7W group despite no difference in GS activity between the CHM groups. This might be because the blood ammonia level decreased after MgSO4 treatment, leading to a decrease in brain ammonia in the glutamine/glutamate cycle. The changes in the brain GS activity were consistent with the changes observed from GS immunohistochemistry that showed the number of GS-positive cells increased in MHE rats, CHM rats, and CHA rats compared with control rats and decreased after MgSO4 treatment in basal ganglia and cortex. The results indicated that the brain Mn deposition or ammonia accumulation could upregulate the activation of GS-positive cells, while MgSO4 treatment could decrease the brain Mn content and downregulated the activation of GS-positive cells.
In MHE rats, an increase in Mn accumulation and hyperammonia occurred simultaneously. The brain Mn contents in basal ganglia and hippocampus, and the blood ammonia level were significantly higher in MHE rats than in control rats and were significantly decreased after MgSO4 treatment. The brain GS activities were significantly increased in MHE rats, and insignificantly decreased after MgSO4 treatment. A significant increase in cortical GS activity was found in MHE rats compared with control rats; however, there were no significant increases in the cortical brain Mn content. The possible reason for this result is that ammonia plays a more important role than Mn in affecting GS activity in the cortex of MHE rats. The GLN content in the basal ganglia was significantly lower in MHE rats after decreasing brain Mn content by MgSO4 treatment. Therefore, we speculated that ammonia might play a more important role than Mn in the pathogenesis of MHE at this time point.
This study had some limitations. First, the design of the experiment could be improved. We only focused on the effect of reducing brain Mn treatment in manganism and hyperammonemia rats. Further studies should be performed to investigate the effect of reducing brain ammonia treatment in manganism rats to complementally confirm that the accumulation of brain ammonia has no effect on the content of brain Mn. Second, although we speculated that ammonia might play a more important role than Mn in the pathogenesis of MHE at this limited time point, it was impossible for this study to determine if ammonia or Mn is the dominant factor in the pathogenesis of HE, and therefore, further studies should be performed.
In this study, we confirmed that brain Mn accumulation could increase brain ammonia levels, while the accumulation of brain ammonia had no effect on the content of brain Mn. Ammonia might play a more important role than Mn in the pathogenesis of MHE at this time point. MgSO4 may decrease blood ammonia levels and GLN content by increasing the excretion of fecal Mn to decrease the brain Mn content and by regulating brain GS activity.
