


1. Background
The liver is one of the most important organs in the body, which is responsible for the detoxification of drugs, production of blood coagulation factors, glycogen storage, and regulation of glucose and fat metabolism. In addition, the liver plays an essential role in the uptake of fat and the defense against microbes and toxins absorbed via foods (1). The importance of fatty liver disease (FLD) is due to the degradation of liver cells, which can lead to cirrhosis if not timely diagnosed and properly treated (2). Fatty liver disease encompasses a range of mild liver diseases in which the fat accumulates within liver cells, which may progress to the inflammation of liver cells in some patients over time, leading to a chronic, irreversible liver disease called cirrhosis (3). The high prevalence of fatty liver is associated with obesity and metabolic syndrome (4). Fatty liver disease imposes a high clinical and economic burden and is the second leading cause of liver transplantation in the USA (5).
The prevalence of Non-alcoholic fatty liver disease (NAFLD) in the general population is estimated at 2.5%, but its incidence is even higher in some parts of the world, as well as in some patients (6). Non-alcoholic fatty liver disease, the most common chronic liver disease worldwide, affects about 30% and 25% of people in Western and Asian countries, respectively (7). The prevalence of NAFLD in Iran is reported to be 2.9% - 7.1% in the general population (8). However, according to the results of previous studies, the prevalence of NAFLD is 59.8% in patients with type 2 diabetes mellitus (9).
The prevalence of NAFLD is related to a variety of factors, including age, sex, ethnicity, sleep apnea, and endocrine system disorders (e.g., hypothyroidism, hypopituitarism, hypogonadism, and polycystic ovary syndrome) (10). Besides, risk factors such as obesity, diabetes, hyperlipidemia, insulin resistance (IR), oxidative stress, and metabolic syndrome play important roles in the pathogenesis of this disease (11).
The association of high blood pressure, hyperlipidemia, obesity, and diabetes (all of which are the components of the metabolic syndrome) has been observed with fatty liver disease (12). Therefore, researchers have suggested FLD as the hepatic presentation of insulin resistance or metabolic syndrome (6). In other words, fatty liver disease can be an indication of insulin resistance, which is why the early diagnosis and appropriate treatment of FLD prevent damage to liver cells and major cardiovascular complications that are the most important causes of mortality in these patients (13, 14). Fatty liver disease has detrimental effects on patient’s health and the economy of the country. Previous studies have shown that FLD, together with type II diabetes and insulin resistance, is associated with a higher risk of death (2). There are limited studies on FLD in Iran (15), and there is a lack of a consensus regarding the relationship between insulin resistance and fatty liver disease (16-18).
2. Objectives
This study aimed to investigate the correlation between insulin resistance and FLD in a random population at a hospital affiliated to Shahid Beheshti University of Medical Sciences in 2019.
3. Methods
3.1. Subjects and Study Design
The present research was a cross-sectional, field, and laboratory study. It was part of a larger project, and the study sample was randomly selected from among the clients of a university-affiliated nutrition consolidation center. At least 2,160 subjects in the age range of 20 - 60 years with an alcohol intake of < 20 grams per day for women and < 30 grams per day for men (to ensure no alcoholic fatty liver) were recruited from April to December 2019, and informed consent was obtained from all of them upon entry into the study. The questionnaires required for the study were completed by the subjects and collected at baseline. Subsequently, the participants were introduced to the Central Laboratory of Shahid Beheshti University School of Nutrition to donate blood samples. The inclusion criterion was the willingness to participate in the project, and the exclusion criteria were the presence of diseases affecting the patient’s metabolic status such as cancer, confirmed diabetes, hepatic disease, thyroid disorders, and consumption of chemotherapy, lipid-lowering, or diabetes drugs.
3.2. Ethics Approval and Consent to Participate
The study protocol followed the Helsinki Declaration and was confirmed by the Fasa University of Medical Sciences’ Ethics Committee (approval code: IR.FUMS.REC.1398.091). The participants were informed of the objectives of the research, and written informed consent was obtained from them before starting the survey. The study was supported by the Fasa University of Medical Sciences (grant no.: 97193).
3.3. Clinical Measurements
The subjects were introduced to the central laboratory of Shahid Beheshti University of Medical Sciences for the measurement of laboratory parameters. After 12-h fasting, 10 mL of peripheral blood was taken in a sterile tube without anticoagulants to measure fasting blood glucose, fasting insulin, alanine aminotransferase (ALT), aspartate aminotransferase (AST), and alanine aminotransferase (ALP) enzymes, low-density lipoprotein (LDL), high-density lipoprotein (HDL), triglyceride (TG), and total cholesterol, as well as evaluate biochemical parameters using the calorimetric method in the laboratory. Immediately after sampling, the blood samples were transferred to the laboratory in ice bags (4°C). The serum samples were centrifuged at 2,500 rpm for 6 - 8 minutes to measure the mentioned parameters. Also, 2-h insulin and 2-h fasting blood glucose were assessed after two hours of baseline fasting and consumption of 75 g glucose (OGTT) by taking new blood samples from the participants. Besides, fasting plasma glucose (FPG) and 2-h glucose were measured two hours after the meal by the enzymatic assay (Pars Azmun commercial kits), and the insulin concentration was evaluated by ELISA.
3.4. Method for Calculating Insulin Resistance and Beta Cell Function
Insulin resistance and beta-cell activity were calculated by the Homeostasis model assessment (HOMA) formula, in which HOMA2-IR is used to evaluate insulin resistance, and HOMA2-IB represents beta cell activity, as follows:
Transient elastography was performed with FibroScan (Echosens, Paris, France) (19) using a standard probe (named the M probe) by an individual sonographer. The fat in the liver was measured by the appropriate controlled attenuation parameter (CAP) with decibels per meter (dB/m) units (20). The CAP scores of lower than 238 dB/m indicated S0 steatosis grade with 0 to 11% extent of fat in the liver, defined as a normal liver. The CAP scores of 238 - 260 dB/m were defined as mild fatty liver with S1 steatosis grade and 11% to 33% extent of fat in the liver. The CAP scores of 260 - 293 dB/m were defined as a moderate fatty liver with S2 steatosis grade and 33 to 66% extent of fat in the liver. The CPA scores of more than 293 dB/m indicated S3 steatosis grade and above 66% extent of fat in the liver, defined as a severe fatty liver.
3.5. Anthropometric Parameters
Weight, height, and waist circumference were calculated by a trained person. Participants’ height was measured by a stadiometer at 0.1 cm precision, and their weight was determined using a digital scale with 0.1 kg precision (Seca 767, Japan). After measuring the height and weight of participants, their body mass index (BMI) was calculated by dividing the weight (kg) by the square of height (m2). Waist circumference (cm) was determined by measuring the widest area between the lower edge of the lowest rib and the iliac crest.
3.6. Data Collection
The demographic information questionnaire was developed through a review of previous studies and included variables considered in the majority of relevant investigations. Demographic data such as gender, age, and menopause, as well as smoking, were collected by the questionnaire. Furthermore, the physical activity assessment was completed by the abridged and validated form of the International Physical Activity questionnaire (IPAQ) and reported as the metabolic equivalent per week (MET-min/ Week) per minute (21).
3.7. Statistical Analysis
Tables, percentages, mean, and standard deviation were used for descriptive statistics. In the analytical statistics section, the odds ratio was computed by the logistic regression model. The chi-square test was used to test the correlation between variables. Finally, the receiver operating characteristic (ROC) curves were used to identify the ability of FPG, fasting insulin, 2-h glucose, 2-h insulin, and Homeostasis model of insulin resistance (HOMA-IR) to diagnose patients with NAFLD. We selected 30% of the data randomly and calculated the cutoff points for this sample and the total data. The maximum Youden Index (sensitivity + specificity - 1) was used to define the optimal cutoff value of the independent variables. A two-tailed P < 0.05 was considered statistically significant. All the analyses were performed using SPSS version 20 software at a significance level of 5%.
4. Results
The mean age was 35 ± 9 in healthy subjects and 49 ± 8 in NAFLD patients. Participants with NAFLD had a higher mean BMI, waist circumference, FPG, fast insulin, 2-h glucose, 2-h insulin, HOMA-IR, Homeostatic model assessment of β cell function (HOMA-B), LDL, TG, total cholesterol, ALT, and AST than healthy subjects. The participants with NAFLD also had higher systolic blood pressure (13.09 vs. 12.47, P < 0.001) and diastolic blood pressure (8.84 vs. 8.04 mg/dL, P < 0.001) than those without NAFLD. However, the NAFLD group had lower HDL (38.88 vs. 48.18, P < 0.001), physical activity (18.3 vs. 24.090, P < 0.001), and smokers (16.8% vs. 17%, P < 0.001). The baseline characteristics of the study subjects in sex groups are shown in Table 1. Out of 10,000 visitors to the clinic, 2,500 participants were selected, of whom 340 were excluded, and finally, 2,160 participants remained for analysis (Figure 1).
| Male (N = 1103) | Female (N = 1057) | P-Value | Total | |
|---|---|---|---|---|
| Age, y | 39 ± 10 | 41 ± 11 | < 0.001 | 40 ± 11 |
| Weight, kg | 84.34 ± 13.30 | 88.03 ± 14.53 | < 0.001 | 86.15 ± 14.04 |
| BMI, kg/m² | 26.70 ± 4.50 | 27.99 ± 4.81 | < 0.001 | 27.33 ± 4.70 |
| Waist circumference, cm | 100.66 ± 15.73 | 107.38 ± 19.85 | < 0.001 | 103.95 ± 18.17 |
| Physical activity, MET/24 h | 23.9 ± 5.9 | 21.3 ± 5.3 | < 0.001 | 22.6 ± 5.8 |
| Energy, kcal | 2469.81 ± 443.79 | 2521.26 ± 450.10 | < 0.001 | 2494.99 ± 447.53 |
| FPG, mg/dL | 104.75 ± 15.44 | 107.12 ± 16.74 | < 0.001 | 105.91 ± 16.13 |
| Fast insulin, µU/mL | 9.82 ± 4.56 | 10.66 ± 4.67 | < 0.001 | 10.23 ± 4.63 |
| Two-hour glucose, mg/dL | 117.35 ± 20.14 | 123.77 ± 20.90 | < 0.001 | 120.49 ± 20.76 |
| Two-hour insulin, µU/mL | 46.28 ± 14.45 | 44.16 ± 13.83 | < 0.001 | 45.24 ± 14.18 |
| HOMA-IR | 1.03 ± 0.28 | 0.99 ± 0.25 | < 0.001 | 1.01 ± 0.27 |
| HOMA-B | 71.75 ± 16.83 | 72.28 ± 18.12 | 0.480 | 72.01 ± 17.47 |
| Systolic blood pressure, mmHg | 12.48 ± 1.65 | 12.90 ± 1.66 | < 0.001 | 12.68 ± 1.66 |
| Diastolic blood pressure, mmHg | 8.25 ± 1.08 | 8.38 ± 1.06 | < 0.001 | 8.31 ± 1.07 |
| LDL, mg/dL | 100.20 ± 18.54 | 101.05 ± 18.55 | 0.284 | 100.61 ± 18.55 |
| HDL, mg/dL | 44.10 ± 8.56 | 45.88 ± 9.05 | < 0.001 | 44.97 ± 8.84 |
| TG, mg/dL | 190.49 ± 28.53 | 202.01 ± 28.20 | < 0.001 | 196.13 ± 28.94 |
| Total cholesterol, mg/dL | 182.23 ± 19.96 | 183.19 ± 18.28 | 0.246 | 182.70 ± 19.16 |
| ALT, IU/L | 44.33 ± 16.48 | 48.84 ± 16.19 | < 0.001 | 46.53 ± 16.49 |
| AST, IU/L | 36.07 ± 14.88 | 40.63 ± 16.23 | < 0.001 | 38.30 ± 15.72 |
| GGT, IU/L | 28.72 ± 13.24 | 27.65 ± 12.40 | 0.052 | 28.20 ± 12.84 |
| Smoking | ||||
| Yes | 193 (17.5) | 172 (16.3) | 0.914 | 365 ± 16.9 |
Demographic and Basic Information of the Participants in Sex Groupsa

Flow chart of inclusion and exclusion criteria for non-alcoholic fatty liver disease
By univariate analysis, there were positive associations between NAFLD and FPG (OR = 1.09) and abnormal 2-h glucose (OR = 1.03). Also, there were associations between NAFLD and fasting insulin (OR = 1.38) and 2-h insulin (OR = 1.07). In addition, there was an association between NAFLD and HOMA-IR (OR = 48.30).
The logistic regression model indicated that after the adjustment for confounding variables, the risk of NAFLD was 1.01 (95% CI: 1.00 - 1.02) for one unit increase in FPG, which was statistically significant. According to the adjusted results of the logistic regression model, the risk of NAFLD was 1.05 (95% CI: 1.00 - 1.10) for one unit increase in fasting insulin, and 1.01 (95% CI: 1.00 - 1.02) for one unit increase in 2-h insulin, which indicated a statistically significant relationship between NAFLD and fasting insulin and 2-h insulin. Moreover, the adjusted risk of NAFLD was 1.00 (95% CI: 0.99 - 1.00) for one unit increase in 2-h glucose, which was not statistically significant (Table 2). Finally, the adjusted risk of NAFLD was 1.29 (95% CI: 1.00 - 1.69) for one unit increase in HOMA-IR, which was statistically significant (Table 3).
| Model 1a OR (95%CI) | Model 2b OR (95%CI) | |
|---|---|---|
| FPG | 1.092 (1.083 - 1.100) | 1.016 (1.004 - 1.027) |
| 2-h glucose | 1.035 (1.030 - 1.040) | 1.000 (0.994 - 1.006) |
| Fasting insulin | 1.381 (1.342 - 1.421) | 1.052 (1.004 - 1.103) |
| 2-h Insulin | 1.078 (1.069 - 1.087) | 1.011 (1.001 - 1.022) |
| HOMA-IR | 5.737 (4.692 - 7.015) | 1.292 (1.008 - 1.695) |
| Sex | 1.316 (1.101 - 1.572) | 0.033 (0.023 - 0.047) |
| BMI | 1.160 (1.135 - 185) | 1.009 (0.964 - 1.056) |
| Waist circumference | 1.048 (1.042 - 1.054) | 0.999 (0.985 - 1.014) |
| Waist to hip ratio | 5.059 (2.607 - 11.837) | 1.481 (0.432 - 5.084) |
| Waist to height ratio | 3.400 (1.491 - 7.652) | 0.998 (0.493 - 2.019) |
| Physical activity | 0.865 (0.853 - 0.865) | 0.969 (0.935 - 1.003) |
| Menopause | 12.031 (9.198 - 15.738) | 1.257 (0.842 - 1.875) |
| LDL | 1.023 (1.018 - 1.028) | 0.998 (0.989 - 1.007) |
| HDL | 0.964 (0.954 - 0.974) | 0.989 (0.968 - 1.010) |
| Total cholesterol | 1.022 (1.017 - 1.027) | 1.002 (0.993 - 1.011) |
| Systolic blood pressure | 1.199 (1.135 - 1.266) | 0.985 (0.912 - 1.063) |
| Diastolic blood pressure | 1.396 (1.281 - 1.521) | 0.899 (0.780 - 1.035) |
| ALT | 1.045 (1.039 - 1.051) | 1.018 (1.005 - 1.031) |
| AST | 1.048 (1.041 - 1.054) | 1.013 (1.000 - 1.026) |
| GGT | 1.024 (1.017 - 1.021) | 1.001 (0.989 - 1.014) |
| Total energy intake | 1.316 (1.101 - 1.572) | 1.120 (1.011 - 1.650) |
Relationship Between Insulin Resistance and the Status of Disease
| Cutoff Point | Sensitivity | Specificity | AUC | PPV | NPV | PLR | NLR | |
|---|---|---|---|---|---|---|---|---|
| FPG, mg/dL | ||||||||
| Female | 96.50 | 93.95 | 88.57 | 0.952 | 97.9 | 72.1 | 8.22 | 0.06 |
| Male | 100.72 | 88.44 | 90.00 | 0.950 | 95.9 | 74.5 | 8.84 | 0.13 |
| Total | 101.72 | 88.69 | 90.50 | .951 | 97.20 | 68.30 | 9.34 | 0.12 |
| Fasting insulin, µU/mL | ||||||||
| Female | 6.72 | 96.73 | 90.00 | 0.975 | 98.2 | 82.9 | 9.67 | 0.03 |
| Male | 9.31 | 86.99 | 95.38 | 0.969 | 98.0 | 73.4 | 18.85 | 0.14 |
| Total | 9.31 | 87.48 | 95.00 | 0.971 | 98.50 | 67.10 | 17.50 | 0.13 |
| 2-h glucose, mg/dL | ||||||||
| Female | 121.55 | 72.54 | 90.00 | 0.861 | 97.6 | 36.6 | 7.25 | 0.31 |
| Male | 117.58 | 65.90 | 90.77 | 0.830 | 95.0 | 50.0 | 7.14 | 0.38 |
| Total | 121.04 | 67.43 | 92.50 | 0.850 | 97.10 | 43.30 | 8.99 | 0.35 |
| 2-h insulin, µU/mL | ||||||||
| Female | 39.46 | 82.12 | 84.29 | 0.893 | 96.7 | 45.4 | 5.23 | 0.21 |
| Male | 43.07 | 83.24 | 83.85 | 0.906 | 93.2 | 65.3 | 5.15 | 0.20 |
| Total | 43.72 | 78.06 | 86.50 | 0.890 | 95.60 | 51.50 | 5.78 | 0.25 |
| HOMA-IR | ||||||||
| Female | 0.963 | 75.06 | 87.14 | 0.860 | 97.1 | 38.1 | 5.84 | 0.29 |
| Male | 1.00 | 79.19 | 86.15 | 0.881 | 93.8 | 60.9 | 5.72 | 0.24 |
| Total | 1.00 | 74.29 | 87.50 | 0.862 | 95.70 | 47.80 | 5.94 | 0.29 |
Receiver Operating Characteristic Curve Analysis for Defining the Ideal Independent Variables’ Cutoff Points Based on Nonalcoholic Fatty Liver Disease
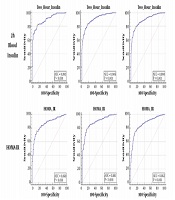
Using the ROC curve, the optimal cutoff point of HOMA-IR was 0.963 for women. The area under the curve (AUC) of HOMA-IR was 0.86 for predicting NAFLD in women. Also, the optimal cutoff point of HOMA-IR was 1.00 for men. The AUC of HOMA-IR was 0.88 for predicting NAFLD in men (Figure 2). The AUC values derived from independent variables are presented in Figure 2.
 curve to identify the cutoff values for fasting blood glucose, fasting insulin, 2-h glucose, 2-h insulin, and HOMA-IR to predict the existence of fatty liver")
Receiver operating characteristic (ROC) curve to identify the cutoff values for fasting blood glucose, fasting insulin, 2-h glucose, 2-h insulin, and HOMA-IR to predict the existence of fatty liver
5. Discussion
This study was performed on 2,160 subjects. The prevalence of NAFLD in the present study was 34.5%, which was similar to other studies by Ma et al. (39%) (22), Vassilatou et al. (36.84%) (23), and Qu et al. (33%) (24) but lower than the prevalence seen in two previous studies by Srinivas-Prasad et al. (68%) (25) and Karoli et al. (66.67%) (26). The main reason for the different prevalence of NAFLD can be different methodologies used to assess the symptoms. Also, this may be explained by different sampling methods or patient characteristics.
The findings showed a significant relationship between NAFLD and FPG, fasting insulin, and 2-h insulin. Also, our findings demonstrated a relationship between NAFLD and HOMA-IR (OR = 1.29, 95% CI 1.00 - 1.69). However, the present study failed to demonstrate the significant effect of 2-h glucose on NAFLD. The possible effect of 2-h glucose on NAFLD can be justified by its effect on some risk factors of NAFLD. Insulin resistance causes excess lipolysis in adipose tissue and leads to fat accumulation in liver cells. Fatty liver occurs when the accumulation of hepatic triglyceride exceeds the synthesis and excretion of low-density lipoprotein (27).
Some studies have reported similar findings. The study by Mansour-Ghanaei et al. (28) showed that with the elevation of FPG level, the risk of developing NAFLD increases (OR = 1.013, CI: 1.008 - 1.018), which was statistically significant. Also, they found that systolic blood pressure, diastolic blood pressure, AST, ALT, GGT, AST/ALT ratio, TG, TC, HDL, and LDL were correlated with NAFLD (28). In a study conducted in Sri Lanka, this subject was confirmed, and it was demonstrated that fasting blood glucose was increased among NAFLD groups (P = 0.005) (17). But, in a study in Australia, the opposite result was reported, and no significant relationship was found between NAFLD and FPG (18). The differences in reported NAFLD in these studies have been attributed to several factors, such as methodological differences, intervention measures, instruments applied, and patient characteristics. For example, a study by Albracht-Schulte et al. (17) was solely among women.
In this study, there was a significant relationship between HOMA-IR and NAFLD. Therefore, individuals with HOMA-IR were at higher risk of NAFLD than were healthy individuals. HOMA-IR can increase the risk of NAFLD through some factors such as increased liver enzyme levels and serum gamma-glutamyl transferase (29, 30). Also, IR can increase lipolysis and the production of free fatty acids. The penetration of free fatty acids into the liver, combined with alterations in the fat metabolism in the liver, leads to the accumulation of triglycerides within hepatocytes (31, 32). The effect of HOMA-IR on NAFLD has already been reported in some studies. For instance, Li et al. (33) reported that the mean HOMA-IR levels were higher in the NAFLD group than in the control group (2.6 ± 1.6 vs. 1.2 ± 0.7, P > 0.001). Varma et al. also showed that having HOMA-IR is a risk factor for NAFLD. They demonstrated that HOMA-IR was significantly higher among women with NAFLD than in those without NAFLD (34).
In this study, a significant relationship was found between fasting insulin and NAFLD. This finding is in agreement with that of El-Koofy et al. (35), who indicated that the probability of NAFLD was higher in those who had fasting insulin than in others. Also, they showed a close association between obesity metabolic syndrome, insulin resistance, and NAFLD. Another study by Harsha Varma et al. (34) showed that that the probability (OR) of NAFLD was 1.82 (95% CI: 1.22 - 2.51) times higher in those who had fasting insulin than in others. As known, IR contributes to the development of not only steatosis but also fibrosis by increasing oxidative stress and fatty acid β-oxidation (36).
In the present study, we found that NAFLD was significantly elevated in patients with 2-h insulin. A previous study reported that fatty acids are associated with insulin resistance, fasting insulin, 2-h insulin, and 2-h glucose (37). Thus, this factor might increase the risk of NAFLD and justify our results. Contrary to the results of previous studies on the significant effect of 2-h glucose on NAFLD (38), this study failed to show a statistically significant relationship between 2-h glucose and NAFLD. The possible reason for this finding could be the small number of subjects with abnormal 2-h glucose in this study.
The cutoff points determined for HOMA-IR by the generation of ROC curves were in disagreement with Motamed et al. study (39). The cutoff points of HOMA-IR to identify NAFLD in our study was 1.0 in men and 0.96 in women. A previous cohort population-based study in Iran reported that the cutoff points of HOMA-IR to detect future NAFLD were 1.79 in men and 1.95 in women. Moreover, Maitra et al. (40) reported in a cross-sectional study that the predictive cutoff point for the possibility of fatty liver disease was HOMA-IR > 2.9 (sensitivity 63.27%, specificity 93.94). These differences may be based on the study design and patient characteristics of the study.
The strength of our study includes the relatively large sample size, the diverse subgroup analysis, and using strong and sensitive indicators such as fibro scans and fatty liver index (FLI) index. The present study has several limitations. First, since this was a cross-sectional study, causal associations could not be evaluated. A cohort study to find factors predicting NAFLD development is necessary. Second, this study may be affected by selection bias and may not represent the whole population, since data were collected in some centers in Tehran. Further multicenter collaborative research is required. The present study demonstrated that FPG, fasting insulin, 2-h insulin, and HOMA-IR were associated with NAFLD. The results support the implementation of care packages and services focusing on individuals with abnormal FPG, fasting insulin, 2-h insulin, and HOMA-IR, especially before NAFLD. Therefore, the results of this study may be useful for health policymakers to design suitable preventive and therapeutic interventions for those with NAFLD to prevent and control this disease.
