

1. Background
Non-alcoholic fatty liver disease (NAFLD) is the most common chronic liver disease with a wide spectrum of diseases, ranging from simple steatosis and steatohepatitis, fibrosis, to cirrhosis. Non-alcoholic steatohepatitis (NASH) with advancing fibrosis causes an increased risk of liver-related mortality (1), which indicates the importance of assessing the severity of liver fibrosis in NAFLD patients. Liver biopsy is the gold standard for assessing liver fibrosis. While there are some non-invasive methods for this purpose, liver biopsy is invasive and difficult to repeat evaluation (2). Although magnetic resonance elastography or acoustic radiation force impulse (ARFI) has a high diagnostic ability (3), it requires expensive equipment with limited availability (4). Indirect serum markers for liver fibrosis staging, such as aspartate aminotransferase (AST) to platelet ratio index (APRI) or fibrosis-4 (FIB-4) index, are widely used. However, they have limitations, such as a wide range of grey zone and a low predictive ability for mild or significant liver fibrosis (5).
Progression of liver fibrosis is accompanied by an increase in serum Mac-2 binding protein (M2BP) glycosylation isomer (M2BPGi); therefore, it can be applied as a diagnostic marker for liver fibrosis (4). Previous studies have applied M2BPGi to assess the stage of liver fibrosis and to predict the prognosis, the risk of liver-related complications, and hepatocellular carcinoma of chronic liver diseases, especially in patients with chronic hepatitis B or C virus infection (6-9). Although previous biopsy-based studies and a review article have evaluated the diagnostic accuracy of M2BPGi in assessing the severity of liver fibrosis for NAFLD patients, the cut-off values of different fibrosis stages were inconclusive, and there were no data about the diagnostic ability of M2BPGi using ARFI as the standard reference of liver fibrosis (4). In addition, only a study by Alkhouri et al. (10) compared NAFLD patients with healthy controls, but no difference of M2BPGi levels was noted among healthy controls, NAFLD, and early NASH.
2. Objectives
This study aims to provide another evidence for the administration of ARFI as the standard reference to determine the fibrosis stage about the utility of M2BPGi for assessing the severity of liver fibrosis in NAFLD patients and healthy controls.
3. Methods
3.1. Inclusion and Exclusion Criteria
Following a cross-sectional design, the current study is performed using the baseline data from the participants of the Tzu Chi NAFLD cohort (TCNC) in Taipei Tzu-Chi Hospital, which is carried out from May 2018 to December 2019. The subjects referring to the health examination center of our hospital were consecutively invited to join the study. Both NAFLD patients and healthy controls were enrolled after obtaining informed consent. The NAFLD patients were also randomly enrolled from those referring to our outpatient department. Abdominal ultrasound examination was performed for all subjects, and the diagnosis of fatty liver depends on typical imaging. A formal questionnaire, including information on past history, drug, smoking, and drinking, was performed by an experienced studying nurse. Participants with alcohol consumption of more than 30 g/day in men and 20 g/day in women were excluded. Drugs that may induce fatty liver, such as amiodarone, tamoxifen, corticosteroid, and tetracycline, were assessed. Patients with a history of cancer or other known chronic liver diseases, such as HBV, HCV, alcohol or drug, etc., were excluded.
3.2. Evaluation of Liver Fibrosis
The stage of liver fibrosis was evaluated by M2BPGi, APRI, FIB-4, and ARFI. In this study, ARFI, expressed as median (M) in meters/second (m/s), was used as the standard reference to determine the liver fibrosis stage. Since the ratio of interquartile range to the median (IQR/M) reflects the variability, the higher value means poor quality and reduced accuracy of ARFI. Therefore, if IQR/M is > 15%, the results were defined as unreliable and excluded (11). The serum M2BPGi was compared with APRI and FIB-4 in predicting the severity of liver fibrosis.
3.3. Measurement of Serum M2BPGi
The serum level of M2BPGi was obtained using the immunoassay technique (HISCL@-5000; Sysmex, Kobe, Japan) and expressed as a cutoff index (COI) by the following formula: [(M2BPGi) sample-(M2BPGi) negative control]/[(M2BPGi) positive control-(M2BPGi) negative control] (12). The APRI was calculated by [AST/upper limit of normal/platelet count (109/L)] × 100. The FIB-4 was calculated by the equation: [Age (years) × AST/Platelet count (109/L) × ALT1/2] (13, 14).
3.4. Statistical Analyses
Statistical analysis was administered using SPSS version 25.0. The Kolmogorov-Smirnov test was applied to test for a normal distribution. Demographic and clinical characteristics of participants with various severities of liver fibrosis were analyzed by one-way ANOVA in continuous variables following normal distribution and Pearson’s chi-square tests in categorical variables. Kruskal-Wallis test was used for those continuous data without normality. Post-hoc comparisons were done using Scheffe’s test for those data following normality and Mann-Whitney U-test for those without. Spearman’s correlation coefficients were used to assess correlations between M2BPGi and ARFI, APRI, and FIB-4. The accuracy of M2BPGi, APRI, and FIB-4 in the diagnosis of liver fibrosis was calculated using receiver operating characteristics (ROC) analysis. Statistical significance was considered when P-value < 0.05.
4. Results
4.1. Demographic and Clinical Characteristics
A total of 902 participants were recruited in the TCNC study until Jul 26, 2020. Two hundred and sixty-eight subjects with available data of M2BPGi (COI), ARFI, and FIB-4 were recruited. Forty-two participants were excluded due to IQR/M > 15% in the data of ARFI. Eventually, 226 subjects were included in the final analysis, of whom 130 (57.5%) were NAFLD patients. According to the liver fibrosis stages, determined by ARFI, 125 patients were in F0; 87 in F1; 5 in F2; 5 in F3, and 4 in F4; they were further divided into three groups of F0, F1, and F ≥ 2. The serum AST, ALT, APRI, M2BPGi (COI), and the fatty liver grade on ultrasonography were significantly different between the three groups (P < 0.05), but there was no difference concerning the FIB-4 score between the three groups (P = 0.093) (Table 1).
| F0 (N = 125) | F1 (N = 87) | F ≥ 2 (N = 14) | P-Value | |
|---|---|---|---|---|
| Age, y | 59.61 ± 9.76 | 60.62 ± 10.23 | 60.21 ± 12.41 | 0.772A |
| Male | 57 (45.6) | 40 (46) | 6 (42.9) | 0.977C |
| Platelet, × 103/µL | 244.20 ± 51.76 | 247.23 ± 55.69 | 217.29 ± 53.75 | 0.151A |
| AST, U/L | 22.0 (9.0 - 77.0)2,3 | 24.0 (12.0 - 63.0)1 | 29.0 (17.0 - 74.0)1 | 0.002B |
| ALT, U/L | 29.0 (14.0 - 144.0)2,3 | 31.0 (14.0 - 144.0)1 | 40.5 (19.0 - 106.0)1 | 0.004B |
| AST/ALT | 0.78 ± 0.20 | 0.75 ± 0.24 | 0.77 ± 0.31 | 0.585A |
| Bilirubin, mg/dL | 0.82 (0.18 - 3.56) | 0.79 (0.18 - 2.77) | 0.77 (0.34 - 2.16) | 0.679B |
| Albumin, g/dL | 3.9 (2.9 - 4.6) | 4.0 (3.5 - 4.5) | 3.9 (2.7 - 4.3) | 0.254B |
| APRI | 0.24 (0.10 - 0.93)3 | 0.25 (0.11 - 0.56)3 | 0.43 (0.19 - 0.78)1,2 | 0.003B |
| FIB-4 | 1.06 (0.11 - 2.45) | 1.05 (0.33 - 2.21) | 1.27 (0.67 - 2.45) | 0.093B |
| M2BPGi (COI) | 0.63 (0.20 - 2.85)3 | 0.65 (0.24 - 2.51) | 0.79 (0.43 - 2.85)1 | 0.027B |
| Median ARFI value, m/s | 1.33 (0.94 - 3.27)2,3 | 1.45 (1.27 - 1.65)1,3 | 1.86 (1.67 - 3.27)1,2 | 0.001B |
| Glucose, mg/dL | 97.0 (57.0 - 258.0) | 97.5 (57.0 - 239.0) | 101.5 (84.0 - 258.0) | 0.128B |
| HbA1c, % | 5.7 (4.2 - 10.1) | 5.8 (4.2 - 10.1) | 5.9 (4.9 - 9.6) | 0.130B |
| TG, mg/dL | 111.0 (27.0 - 735.0) | 119.5 (27.0 - 735.0) | 127.0 (47.0 - 579.0) | 0.324B |
| CHO, mg/dL | 176.0 (15.0 - 321.0) | 176.0 (15.0 - 321.0) | 171.5 (133.0 - 197.0) | 0.462B |
| LDL, mg/dL | 115.62 ± 30.52 | 112.71 ± 34.93 | 104.00 ± 24.56 | 0.472A |
| Fatty liver grade | 0.002C | |||
| No | 64 (51.2) | 29 (33.3) | 3 (21.4) | |
| Mild | 34 (27.2) | 24 (27.6) | 3 (21.4) | |
| Moderate | 27 (21.6) | 31 (35.6) | 6 (42.9) | |
| Severe | 0 | 3 (3.4) | 2 (14.3) |
4.2. Characteristics Between NAFLD Patients and Healthy Controls
The NAFLD patients were younger (P = 0.024) and had a higher percentage of male gender (P = 0.018) than healthy controls. In metabolic components, NAFLD patients had higher body mass index (BMI), waist circumference, glucose, HbA1c, and triglyceride levels than healthy controls (P < 0.05). Regarding the liver function tests, NAFLD patients had higher serum AST, ALT, albumin, APRI, and ARFI scores than healthy controls (P < 0.05), but there was no difference concerning the FIB-4 (P = 0.068) and M2BPGi (COI) (P = 0.857) between the two groups (Table 2).
| Total (N = 226) | NAFLD (N = 130) | Control (N = 96) | P-Value | |
|---|---|---|---|---|
| Age, y | 60.04 ± 10.08 | 58.73 ± 9.78 | 61.80 ± 10.25 | 0.024 |
| Male | 103 (45.6) | 68 (52.3) | 35 (36.5) | 0.018 |
| BMI, kg/m2 | 25.28 ± 3.67 | 26.57 ± 3.35 | 23.55 ± 3.37 | < 0.001 |
| Waist (cm) | 85.05 ± 10.34 | 88.80 ± 9.38 | 79.92 ± 9.37 | < 0.001 |
| Platelet, × 103/µL | 243.70 ± 53.64 | 249.58 ± 58.16 | 235.73 ± 45.94 | 0.047 |
| AST, U/L | 24.84 ± 10.20 | 27.21 ± 12.09 | 21.64 ± 5.46 | < 0.001 |
| ALT, U/L | 36.03 ± 21.96 | 42.94 ± 25.67 | 26.67 ± 9.51 | < 0.001 |
| AST/ALT | 0.77 ± 0.22 | 0.71 ± 0.23 | 0.85 ± 0.18 | < 0.001 |
| Bilirubin, mg/dL | 0.94 ± 0.50 | 0.88 ± 0.44 | 1.01 ± 0.56 | 0.062 |
| Albumin (g/dL) | 3.94 ± 0.27 | 3.98 ± 0.23 | 3.89 ± 0.30 | 0.043 |
| FIB-4 | 1.11 ± 0.44 | 1.06 ± 0.45 | 1.17 ± 0.41 | 0.068 |
| APRI | 0.27 ± 0.13 | 0.30 ± 0.15 | 0.25 ± 0.08 | 0.002 |
| > 0.7 | 3 (1.3) | 3 (2.3) | 0 | 0.264 |
| M2BPGi (COI) | 0.72 ± 0.38 | 0.73 ± 0.33 | 0.72 ± 0.41 | 0.857 |
| > 1 | 36 (15.9) | 20 (15.4) | 16 (16.7) | 0.795 |
| ARFI | 0.015 | |||
| F0 | 125 (55.3) | 61 (46.9) | 64 (66.7) | |
| F1 | 87 (38.5) | 58 (44.6) | 29 (30.2) | |
| F2 | 5 (2.2) | 3 (2.3) | 2 (2.1) | |
| F3 | 5 (2.2) | 5 (3.8) | 0 | |
| F4 | 4 (1.8) | 3 (2.3) | 1 (1) | |
| Median ARFI value, m/s | 1.37 ± 0.25 | 1.41 ± 0.26 | 1.33 ± 0.24 | 0.015 |
| Glucose, mg/dL | 104.53 ± 24.97 | 111.20 ± 29.06 | 95.63 ± 13.96 | < 0.001 |
| HbA1c, % | 5.86 ± 0.79 | 6.06 ± 0.91 | 5.61 ± 0.52 | < 0.001 |
| TG, mg/dL | 126.65 ± 84.76 | 151.59 ± 96.64 | 93.14 ± 48.73 | < 0.001 |
| CHO, mg/dL | 177.61 ± 36.91 | 178.54 ± 40.90 | 176.39 ± 31.06 | 0.668 |
| LDL, mg/dL | 113.78 ± 31.97 | 114.90 ± 34.89 | 112.28 ± 27.73 | 0.532 |
Characteristics of Participants, Separated by the Study Groupsa
4.3. M2BPGi (COI) Among Difficult Stage of Liver Fibrosis
The levels of M2BPG1 (COI) were significantly higher in the group of significant fibrosis (F ≥ 2) than those without fibrosis (F = 0) (P = 0.016). There were no difference in M2BPGi (COI) levels either between F0 and F1 (P = 0.139) or between F1 and F2 (P = 0.082) (Figure 1).
 levels among normal, mild, and significant liver fibrosis")
Comparison of M2BPGi (COI) levels among normal, mild, and significant liver fibrosis
4.4. Comparison Among M2BPGi (COI), APRI and FIB-4
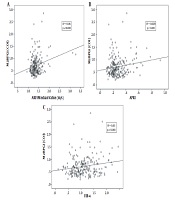
The levels of M2BPGi (COI) were correlated with those of ARFI (R2 = 0.06, P < 0.001), APRI (R2 = 0.029, P = 0.011), and FIB-4 (R2 = 0.03, P < 0.001) (Figure 2A-C). Comparing F0 with F ≥ 1, the AUC of M2BPGi (COI), APRI, and FIB-4 were 0.580, 0.562, and 0.547, respectively (Figure 3A). The AUC value for M2BPGi, APRI, and FIB-4 were 0.680, 0.666 and 0.620, respectively. (Figure 3B). The cut-off value of M2BPGi (COI) was 0.58 for mild liver fibrosis and 0.68 for significant liver fibrosis. The sensitivity, specificity, positive predictive value (PPV), and negative predictive value (NPV) are provided in Table 3.
 and ARFI; B, The correlations between M2BPGi (COI) and APRI; C, The correlations between M2BPGi (COI) and FIB-4.")
; A, The correlations between M2BPGi (COI) and ARFI; B, The correlations between M2BPGi (COI) and APRI; C, The correlations between M2BPGi (COI) and FIB-4.
 for assessing liver fibrosis. (A) Comparing F0 and ≥ 1, the AUC of M2BPGi (COI), APRI and FIB-4 were 0.580, 0.562, and 0.547, respectively; B, Areas under the receiver operating characteristic curves (AUCs) for assessing liver fibrosis. (B) Comparing F0-1 and F ≥ 2, the AUC of M2BPGi (COI), APRI, and FIB-4 were 0.680, 0.666 and 0.620, respectively.")
A, Areas under the receiver operating characteristic curves (AUCs) for assessing liver fibrosis. (A) Comparing F0 and ≥ 1, the AUC of M2BPGi (COI), APRI and FIB-4 were 0.580, 0.562, and 0.547, respectively; B, Areas under the receiver operating characteristic curves (AUCs) for assessing liver fibrosis. (B) Comparing F0-1 and F ≥ 2, the AUC of M2BPGi (COI), APRI, and FIB-4 were 0.680, 0.666 and 0.620, respectively.
| AUC | 95% CI | Cutoff Value | Sensitivity, % | Specificity, % | PPV, % | NPV, % | P-Value | |
|---|---|---|---|---|---|---|---|---|
| F ≥ 1 | 0.58 | 0.505 - 0.654 | 0.60 | 61.4 | 53.1 | 56.7 | 57.9 | 0.039 |
| F ≥ 2 | 0.68 | 0.534 - 0.825 | 0.68 | 78.6 | 58.5 | 65.4 | 73.2 | 0.024 |
The Cutoff Value of M2BPGi (COI) Test for Different Stages of Liver Fibrosis
5. Discussion
For both NAFLD patients and healthy controls, the majority of participants (93.8%) had normal or mild liver fibrosis, which was assessed using ARFI as the standard reference. NAFLD patients had higher BMI, waist circumference, glucose, HbA1c, and triglyceride than healthy controls. The M2BPGi levels among the groups of F0, F1, or F ≥ 2 were significantly different, and there was a direct correlation between M2BPGi and the severity of liver fibrosis (P = 0.027). Furthermore, the M2BPGi levels were correlated with ARFI, APRI, and FIB-4 scores. In addition, the serum M2BPGi level could predict mild (F1) or significant (F2) liver fibrosis using the AUC method, suggesting a surrogate marker to differentiate between normal, mild, or significant fibrosis.
In previous studies, M2BPGi could predict NASH and liver fibrosis in biopsy-proven NAFLD patients (4, 10, 15-17). Although liver biopsy is the gold standard to precisely diagnose NASH, fibrosis is not always uniformly distributed in the liver, and biopsy specimens only represented approximately 1/50000 of the liver (18). A systematic review and meta-analysis revealed that ARFI elastography could exert satisfactory diagnostic performance in staging non-viral hepatic fibrosis, especially in advanced fibrosis or cirrhosis, and was modestly accurate in detecting significant fibrosis for NAFLD patients (19, 20). Furthermore, since ARFI is incorporated into conventional ultrasonography, the complications of chronic liver disease, such as ascites or hepatocellular carcinoma, could be assessed simultaneously (21). However, the machine of ARFI is expensive and often is not available at the local medical department (4). On the other hand, the cost of ARFI is about 50 US$, and M2BPGi costs about 17 US$ in our country. Although transient elastography can assess the severity of liver fibrosis, it displays reduced applicability in obese and NAFLD patients. The magnetic resonance elastography is expensive and remains understudied in NAFLD patients. Therefore, the diagnostic performance of M2BPGi was evaluated in order to assess the liver fibrosis in NAFLD patients using ARFI as the standard reference. Our report demonstrated that M2BPGi is positively correlated with ARFI value. M2BPGi was significantly elevated stepwise with liver fibrosis progression in NAFLD patients, as has been reported previously (4, 10, 15-17). To the best of our knowledge, there was no data about the diagnostic ability of M2BPGi using ARFI as the standard reference to determine liver fibrosis stages.
APRI and FIB-4 were initially developed to diagnose significant or advanced liver fibrosis in chronic hepatitis C, subsequently refined for the NAFLD patients (22). The scores are easily calculated, affordable, and just using routine clinical and laboratory parameters. Although the ability of differentiation between adjacent fibrotic stages, especially among normal, mild, and significant liver fibrosis, was limited, they were allowed to screen NAFLD patients and make risk stratification for liver-related mortality (23, 24).
In a previous study on 134 biopsy-proven NASH patients, the FIB-4 score and serum M2BPGi levels could predict advanced liver fibrosis and cirrhosis rather than APRI. In addition, only the M2BPGi test could predict significant fibrosis (15). Another study on 165 biopsy-proven NAFLD patients confirmed the diagnostic accuracy of M2BPGi, APRI, and FIB-4 scores in assessing significant liver fibrosis (F ≥ 2) (16). Our study found the correlation between M2BPGi and APRI or between M2BPGi and FIB-4 scores. Furthermore, the M2BPGi could predict mild (F ≥ 1) or significant liver fibrosis (F ≥ 2) of NAFLD patients, suggesting a surrogate marker to differentiate among normal, mild, and significant fibrosis of NAFLD patients.
The mean serum M2BPGi levels in NAFLD cases were 0.62 - 0.71, 0.7 - 1.17, 1.2 - 1.57, and 1.6 - 2.96 for histological fibrosis stages of 1, 2, 3, and 4, respectively (4). Our cut-off value for mild (F ≥ 1) and significant fibrosis (F ≥ 2) is mildly lower than previous studies (4, 10, 15-17). Further studies with the meta-analysis design are needed to establish the final cut-off values for NAFLD patients in diagnosing significant, advanced fibrosis, or cirrhosis.
It is necessary to mention some limitations and biases of our study. Although serum M2BPGi levels were increasing with liver fibrosis progression, the cut-off values for different stages of liver fibrosis varied depending on the etiology of underlying liver disease. Since our study population included NAFLD patients and healthy controls with the exclusion of other known causes of chronic hepatitis, we benefited from the advantage of assessing its diagnostic accuracy for liver fibrosis in NAFLD patients. Second, previously applied non-invasive markers have limitations in differentiation between normal and mild liver fibrosis. Our study found that the M2BPGi levels could differentiate mild or significant liver fibrosis from no fibrosis. However, some limitations should also be addressed. First, the gold standard to assess the stages of liver fibrosis is liver biopsy, not ARFI. Second, the sample size for significant fibrosis (F ≥ 2) was relatively small in this study population. Third, the AUC of the M2BPGi test was 0.58 for F ≥ 1. The low score may be due to either relatively milder liver fibrosis in this population or originally minor difference between F0 and F ≥ 1 groups.
In summary, the serum M2BPGi levels correlate with ARFI, APRI, and FIB-4 scores, according to the findings of the present study that was carried out on both NAFLD patients and healthy controls. Furthermore, the levels of M2BPGi could predict mild (F ≥ 1) or significant liver fibrosis (F ≥ 2) in NAFLD patients, suggesting a surrogate marker to differentiate between normal, mild, and significant fibrosis in NAFLD patients. The cut-off value of M2BPGi was 0.58 for mild liver fibrosis and 0.68 for significant liver fibrosis. Nevertheless, further studies are needed to extend our knowledge about whether the M2BPGi test can predict the overall survival, the risk of liver-related complications, or hepatocellular carcinoma development.
