1. Background
Non-alcoholic steatohepatitis (NASH), which develops from steatosis, is characterized by lipid metabolic disorder and chronic inflammation, eventually leading to liver cirrhosis and hepatocellular carcinoma (HCC) if left untreated (1). As a progressive form of non-alcoholic fatty liver disease (NAFLD), NASH has been predicted to become the leading cause of end-stage liver disease requiring liver transplantation (2). The “two-hit” theory is widely used to explain the pathogenesis of NASH. The first hit is hepatic steatosis resulting from the accumulation of triglycerides, and the second hit is the oxidative stress response to liver damage, inflammation, and fibrosis (3, 4). According to global statistics, approximately 25% of the general population is suffering from NAFLD, and the estimated prevalence of NASH among NAFLD patients is approximately 60% (5, 6). Although patients with simple steatosis (SS) have an optimistic survival and prognosis, the overall morbidity and mortality rates of patients with NASH increase annually (7). To date, liver biopsy remains the gold standard for the diagnosis of NASH, but due to the high incidence of NASH worldwide, liver biopsy is not suitable for large-scale screening (8). Therefore, there is an urgent need to identify novel biomarkers to distinguish NASH from SS and healthy conditions and to better define the severity of liver injury and inflammation.
The development of NASH stems from an inflammatory process that is driven by multiple immune cells. Studies have reported that in the liver, a large number of innate and adaptive immune cells, including lymphocytes, macrophages, neutrophils, and dendritic cells, are involved in the development of chronic inflammation (9). Non-parenchymal hepatic cells, including liver sinusoidal endothelial cells and hepatic stellate cells, have been shown to participate in NASH progression (10). Damaged liver cells release signaling molecules, including injury-associated molecular patterns and pathogen-associated molecular patterns, thereby arousing an immune response (11). Moreover, these liver immune-associated cells can sense excess metabolites and bacterial products and transduce these signals to activate immune responses in NASH (12). Although the activation of the immune system and the recruitment of pro-inflammatory factors in NASH are widely recognized, the signaling and molecular regulatory mechanisms that facilitate this process remain unclear.
Therefore, this study aimed to identify the characteristic genes of NASH and explore the relationship between them and immune cells. To obtain optimized feature genes, we screened differentially expressed genes (DEGs) between NASH samples and healthy controls, followed by the function and pathway enrichment analysis of these DEGs. We then attempted to screen candidate genes from protein-protein interaction (PPI) network-based module analysis and performed least absolute shrinkage and selection operator (LASSO) regression to identify the gene signatures of NASH.
2. Objectives
In this study, we identified several predictive biomarkers for NASH diagnosis, as well as their potential regulatory mechanisms involved in immune response activation and NASH development.
3. Methods
3.1. Data Acquisition and Processing
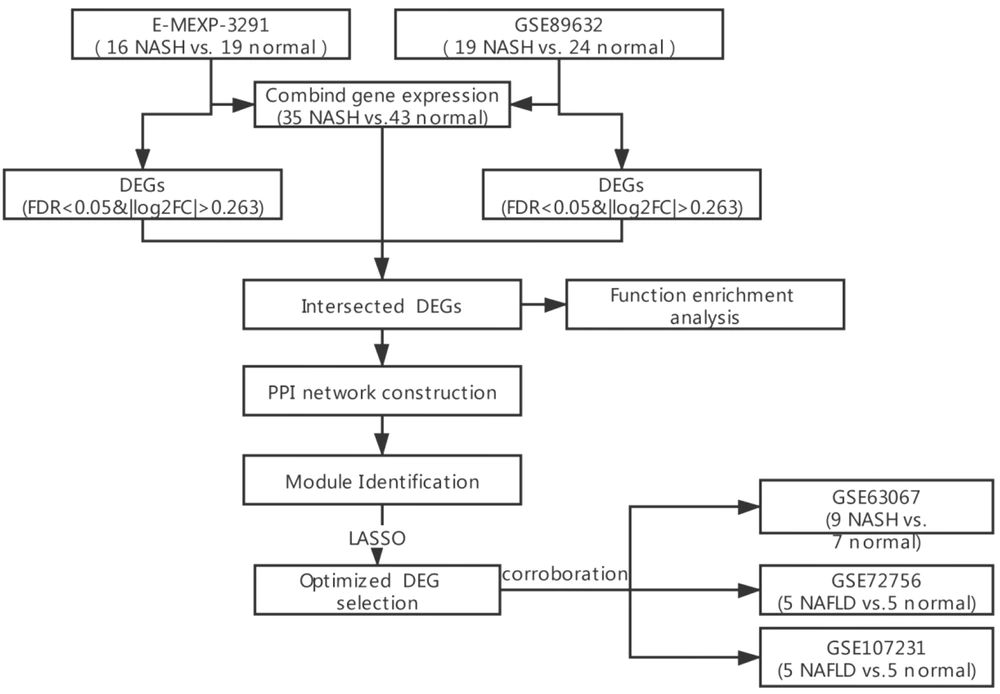
Four microarray datasets, including GSE89632 (containing 20 SS, 19 NASH, and 24 normal liver biopsy tissue samples detected from Illumina HumanHT-12 WG-DASL v4.0 R2 expression BeadChip), GSE63067 (containing nine NASH and seven normal liver biopsy tissue samples detected from Affymetrix Human Genome U133 Plus 2.0 Array), GSE107231 (containing five NAFLD and five normal liver biopsy tissue samples detected from Agilent-067406 Human CBC lncRNA + mRNA microarray v4.0), and GSE72756 (containing five NAFLD and five normal liver biopsy tissue samples detected from Agilent-045997 Arraystar human lncRNA microarray v3), were downloaded from Gene Expression Omnibus (GEO) (13). In addition, the E-MEXP-3291 containing 10 SS samples, 16 NASH samples, and 19 healthy controls, detected from Affymetrix GeneChip Human Gene 1.0 ST Array, was obtained from European Bioinformatics Institute (EBI) Array Express (14). The expression data of the samples from these five datasets were acquired accordingly, of which GSE89632 and E-MEXP-3291 were used for analysis while GSE63067, GSE107231, and GSE72756 were employed for validation. Sample employment and study procedures have been shown in Figure 1. The probe was transformed into a gene symbol according to the platform annotation information, and when multiple probes corresponded to one gene, the mean value was adopted.
3.2. Screening for DEGs in NASH
The limma package (version 3.34.7) in R 3.6.1 (15) was applied to select DEGs between NASH samples and healthy controls in the both GSE89632 and E-MEXP-3291 datasets. Batch effects on the expression data rooted into two detection platforms and were removed by the sva package (version 3.38.0) (16) and visualized by principal component analysis (PCA) diagrams. An expression heatmap was generated using the pheatmap package (version 1.0.12). Intersecting DEGs from the two databases were selected for further analysis.
3.3. Enrichment Analysis of DEGs
The online tool of DAVID (version 6.8) (17, 18) was used for the gene ontology-biological process (GO-BP) and Kyoto Encyclopedia of Genes and Genomes (KEGG) pathway enrichment of DEGs. Thresholds were set at P < 0.05 and gene count ≥ 2.
3.4. PPI Network Establishment and Module Analysis
In this section, STRING version 11.0 (19) was used to establish functional interactions between proteins with a threshold of combined score = 0.70 (high confidence), and then the established network was visualized through Cytoscape version 3.6.1 (20). Moreover, the CytoNCA plug-in version 2.1.6 (21) was used to calculate the degree centrality, betweenness centrality, and closeness centrality of nodes in the network. The hub proteins involved in the PPI network were obtained by ranking the topological properties of each node.
MCODE plug-in version 1.5.1 (22) was used to identify module genes in the PPI network based on the following settings: degree cut-off = 2, node score cut-off = 0.2, K-core = 2, and max depth = 100. Then the clusterProfiler package in R (version 3.8.1) (23) was used to conduct KEGG pathway enrichment analysis for the genes in each module and identify key module genes according to the significance of enrichment results at the threshold of P < 0.05.
3.5. Selection and Validation of Core Genes
To identify hub genes in the PPI network and key module genes as candidate genes, LASSO regression analysis was performed using Lars package in R 3.6.1 (version 1.2) for the screening of DEG signatures. Thereafter, the expression of DEG signatures was validated on the GSE63067, GSE107231, and GSE72756 datasets.
3.6. Identification of Immune Infiltration-related DEG Signatures
The CIBERSORT algorithm was used to evaluate the abundance of immune cell populations in all samples, and then differences in the proportion of individual immune cells were compared between NASH and healthy controls. The Cor function in R 3.6.1 was used to compute the Spearman correlation coefficient between DEG signatures and the abundance of immune cells. Finally, DEG signatures with an adjusted P of < 0.05 and |Spearman R| > 0.6 were used to generate a scatter plot.
3.7. Statistical Analysis
Gene expression comparison between NASH and control samples was performed using the limma package with a false discovery rate (FDR) of < 0.05 and |log2 fold change (FC)| > 0.263, as thresholds. Also, LASSO regression analysis was performed to screen DEG signatures. The Wilcoxon test was used to compare the difference in immune cell infiltration between NASH and normal samples, and the Spearman correlation coefficient was calculated to assess the relationship between DEG signatures and immune cell infiltration. Statistical significance was set at P < 0.05, and P values in module and correlation analyses were adjusted using the Benjamini & Hochberg (BH) method.
4. Results
4.1. Comparison of DEGs Between NASH and Healthy Control Samples
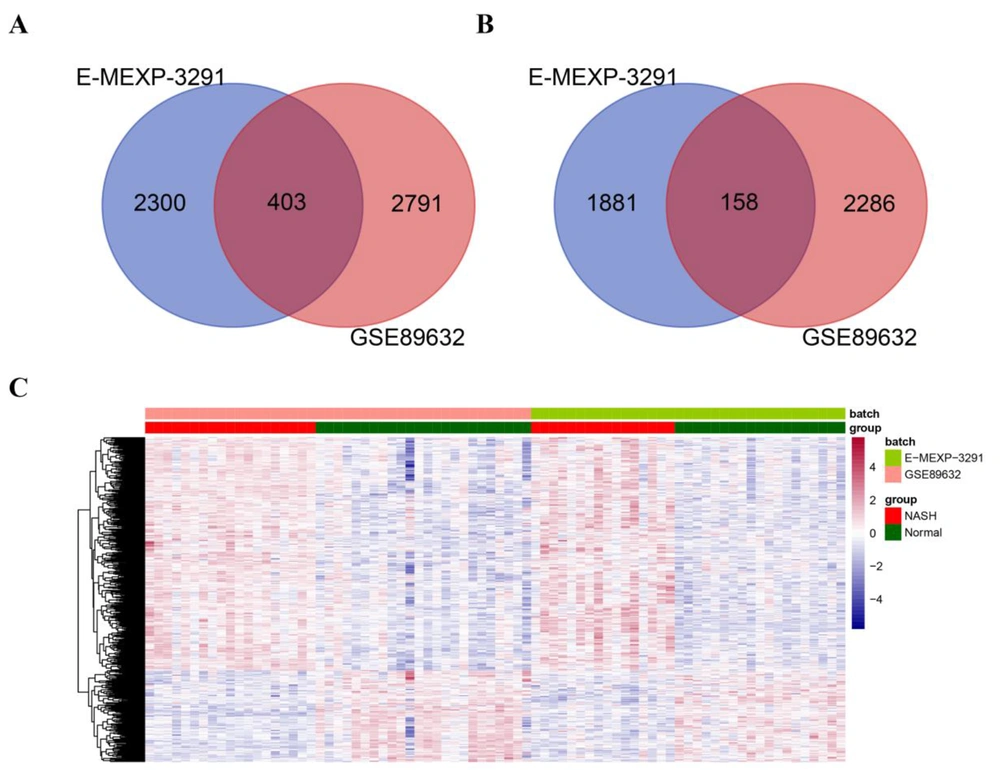
According to expression profile data and the threshold set, we obtained 3194 upregulated and 2444 downregulated genes at GSE89632 and 2703 upregulated and 2039 downregulated genes at E-MEXP-3291 comparing NASH and healthy control samples considering FDR < 0.05 and |log2 (FC)| > 0.263. By intersecting the DEGs obtained from the two datasets, 403 upregulated genes (Figure 2A) and 158 downregulated genes (Figure 2B) were further screened. We further removed the batch effect of samples from the GSE89632 and E-MEXP-3291 datasets using the sva package. Appendix 1 shows PCA diagrams before and after the removal of the batch effect in the two datasets. The results suggested that the sample distribution of the two datasets was not significantly different after the removal of the batch effect. Thereafter, expression data were extracted to generate a sample clustering heatmap, as shown in Figure 2C. The diagram illustrates that the expression levels of DEGs were significantly different between NASH and normal samples, and DEGs were identified based on their respective expression profiles.
Screening of differentially expressed genes (DEGs) between non-alcoholic steatohepatitis and normal samples in the E-MEXP-3291 and GSE89632 datasets. A-B. Venn diagrams showing commonly upregulated (A) and downregulated (B) genes from the GSE89632 and E-MEXP-3291 datasets. The DEGs were selected with FRD < 0.05 and |log2 fold change (FC)| > 0.263 as thresholds. C. The heatmap shows the differences in the expression of DEGs between NASH and normal samples from the GSE89632 and E-MEXP-3291 datasets.
4.2. Functional and Pathway Enrichment Analysis on DEGs
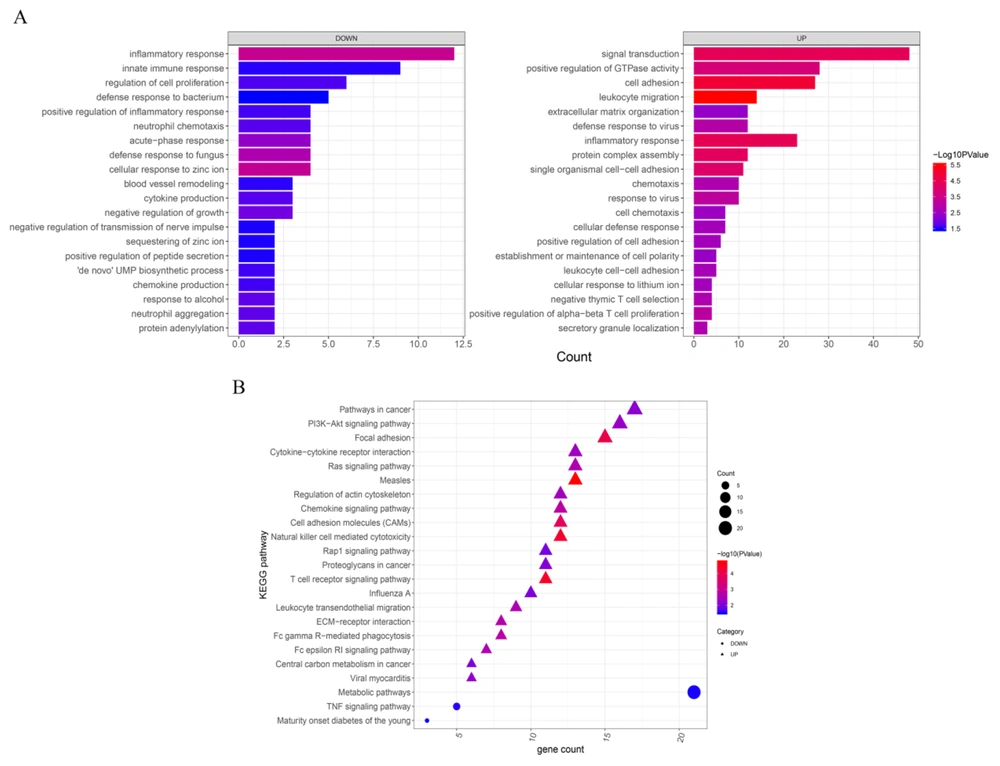
In this regard, GO-BP functional analysis and KEGG pathway enrichment analysis were performed based on P < 0.05 and gene count ≥ 2, leading to the emergence of 69 GO-BP and 36 KEGG pathways for upregulated DEGs and 22 GO-BP and three KEGG pathways for downregulated DEGs. According to the ranking of P values, the top 20 pathways of GO-BP and KEGG were selected (Figure 3A and 3B, respectively). Enrichment results showed that downregulated DEGs were more likely to participate in the biological processes involved in the inflammatory and innate immune responses whereas upregulated DEGs were more engaged with signal transduction, positive regulation of GTPase activity, and cell adhesion. Of the enriched KEGG pathways, upregulated DEGs were more engaged in the pathways involved in cancer, the PI3K-Akt signaling pathway, and focal adhesion while downregulated DEGs were most likely to participate in metabolic pathways.
Gene ontology-biological process (GO-BP) and Kyoto Encyclopedia of Genes and Genomes (KEGG) pathway enrichment of differentially expressed genes (DEGs) between normal and NASH samples. The top 20 GO-BP (A) and KEGG pathways (B) for both upregulated and downregulated DEGs ranked by P values. Significantly enriched terms were selected based on the criteria of P < 0.05 and gene count ≥ 2. The x-axis indicates the gene count while the y-axis indicates the terms of the GO-BP and KEGG pathways with a significant correlation. The triangles and circles in B represent upregulated and downregulated DEGs, respectively.
4.3. Analysis Using Constructed PPI Network
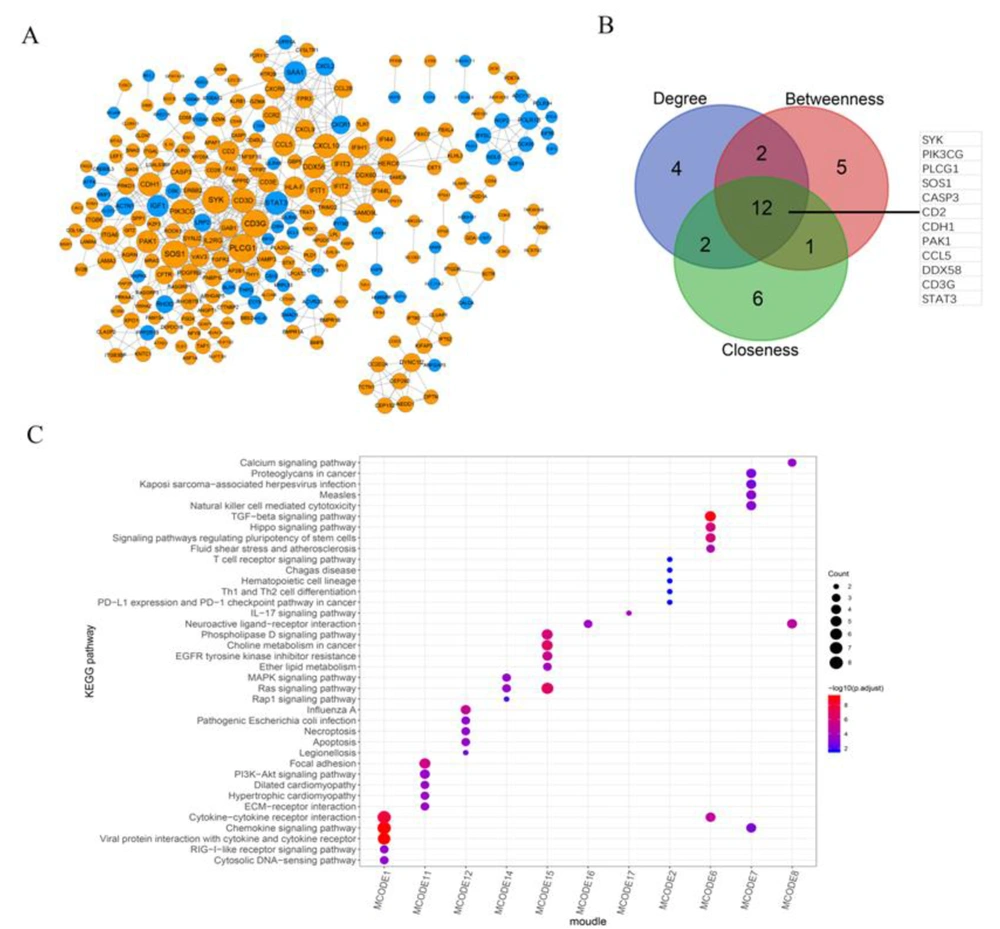
We further established a PPI network based on intersecting DEGs and obtained 555 pairs of interactions containing 246 genes (Figure 4A). Then 12 DEGs (SYK, PIK3CG, PLCG1, SOS1, CASP3, CD2, CDH1, PAK1, CCL5, DDX58, CD3G, and STAT3), which ranked as the top 20 based on the topological properties of degree, betweenness, and closeness, were identified as hub genes in the PPI network (Figure 4B).
Construction and module mining analysis of the protein-protein interaction (PPI) network. A, Establishment of a PPI network based on intersected differentially expressed genes (DEGs). This PPI network contains 246 genes (upregulated DEGs are shown in orange, and downregulated DEGs are shown in blue) and 555 pairs of interactions. B, The Venn diagram shows the top 20 genes ranked by gene count in terms of the topological properties of degree, betweenness, and closeness, and the intersected 12 DEGs were identified as hub genes in the PPI network. C, The heatmap shows the top five KEGG pathways significantly enriched in DEGs, ranked by P value in each submodule.
We also performed module mining analysis on the PPI network and identified 17 submodules and their corresponding genes (Appendix 2). Accordingly, KEGG pathway analysis revealed that only the genes in 11 submodules were significantly enriched in KEGG pathways, and these enriched pathways varied in each submodule. The results of the top five pathways with BH-adjusted P values in each submodule have been displayed in Figure 4C.
4.4. Screening and Validation of DEG Signatures
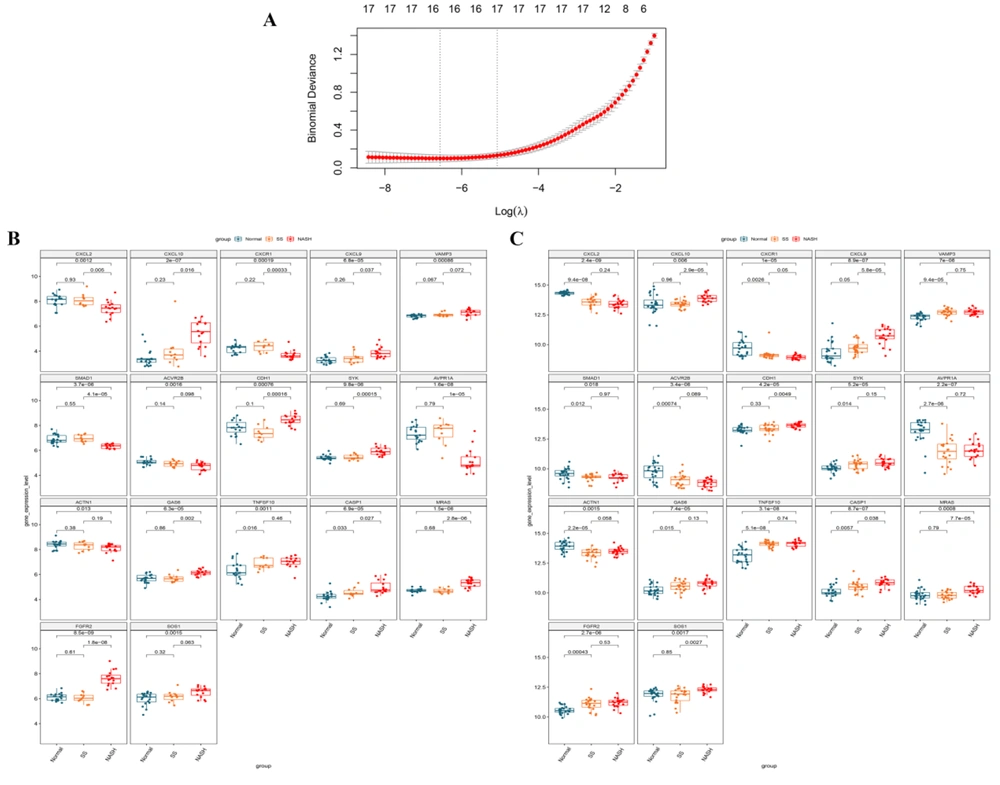
Twelve hub genes in the PPI network were included in the gene set from the 11 submodules identified. Therefore, the expression data of candidate genes from these submodules were extracted to recognize optimized DEG combinations. After LASSO regression analysis, 17 DEG signatures were identified (Figure 5A), and their expressions were validated in the normal, SS, and NASH samples from the E-MEXP-3291 (Figure 5B) and GSE89632 (Figure 5C) datasets. The results suggested that these gene signatures were differentially expressed between healthy and NASH samples in the two datasets, which was statistically significant. In addition, we found that in the E-MEXP-3291 dataset, except for VAMP3, ACVR2B, ACTN1, TNFSF10, and SOS1, the other 12 gene signatures were differentially expressed between SS and NASH samples while TNFSF10 and CASP1 were differentially expressed between the normal and SS groups. In the GSE89632 dataset, CXCL10, CXCL9, CDH1, CASP1, MRAS, and SOS1 were differentially expressed between SS and NASH samples (P < 0.05) while 12 of the 17-DEG signatures identified were differentially expressed between the normal and SS groups (P < 0.05). The expression of the 17-gene-signature varied progressively from normal to SS and then to NASH in these two datasets. Subsequently, the expression data of the 17-DEG-signature were extracted from the GSE63067, GSE107231, and GSE72756 datasets for validation (Appendix 3). The results suggested that the expression of CASP1 was significantly different between NASH and control samples in the GSE63067 dataset while MRAS was significantly upregulated in NASH compared with control in the GSE107231 dataset. Finally, in the GSE72756 dataset, the expression levels of ACVR2B, CXCL9, and CXCL10 were significantly different between NASH and healthy control samples.
Screening of differentially expressed gene (DEG) signatures using least absolute shrinkage and selection operator (LASSO) regression analysis and the validation of their expression in normal, simple steatosis (SS), and non-alcoholic steatohepatitis (NASH) samples from the E-MEXP-3291 and GSE89632 datasets. A. LASSO regression analysis was used to identify 17 DEG signatures as the optimized gene set. B. The expression differences of 17 DEG signatures between normal, SS, and NASH samples from the E-MEXP-3291 dataset. C. The expression differences of 17 DEG signatures between the normal, SS, and NASH groups in the GSE89632 dataset.
4.5. Immune Infiltration Analysis of DEG Signatures
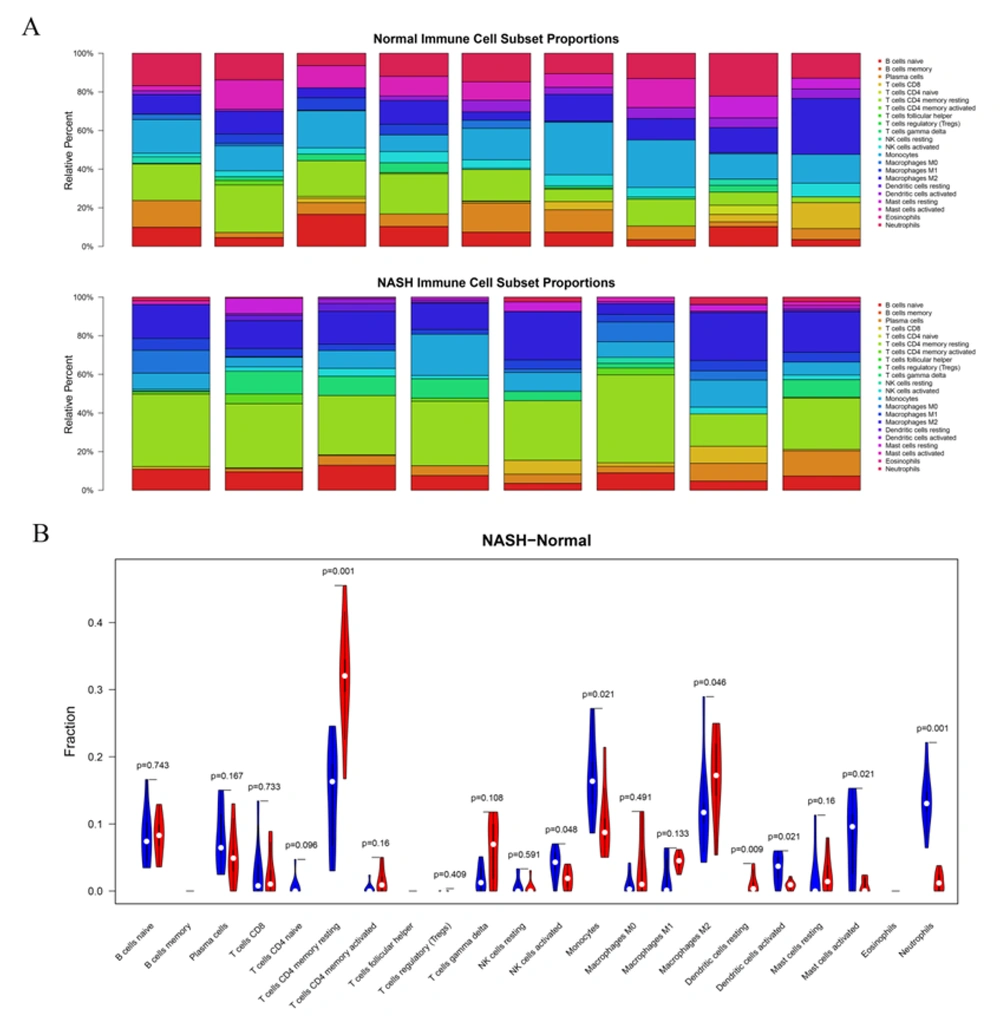
We further evaluated the abundance of 22 types of tissue-infiltrating immune cells in the combined dataset (Figure 6A). We finally filtered eight NASH samples and nine healthy controls with a standard of P < 0.05 for the following analysis. Furthermore, the Wilcoxon test was performed to compare the abundance of each immune cell type between the two groups. Overall, seven types of immune cells showed significant differences between the two groups (Figure 6B), showing higher numbers of resting memory CD4 T cells, M2 macrophages, and resting dendritic cells while lower numbers of activated NK cells, monocytes, activated dendritic cells, and neutrophils in NASH than in normal tissues. Next, we analyzed the correlation between the frequency of these seven immune cell types and the 17-DEG-signature and identified 28 pairs of relationships between these cells and genes at adjusted P < 0.05 and |Spearman R| > 0.6 (Table 1). The results suggested that a total of 12 DEG signatures correlated with six types of immune cells, including activated dendritic cells, resting dendritic cells, M2 macrophages, monocytes, neutrophils, and resting memory CD4 T cells. Considering relationships between DEG signatures and immune cells, activated dendritic cells positively correlated with AVPR1A expression; M2 macrophages positively correlated with VAMP3 expression; neutrophils positively correlated with SMAD1, AVPR1A, CXCL2, and CXCR1 expression, and finally, resting memory CD4 T cells were positively associated with CXCL10, SYK, CDH1, and FGFR2 expression. All other relationships were negative correlations.
Immune cell infiltration analysis in normal and non-alcoholic steatohepatitis (NASH) samples in the combined dataset. A. Histograms show the infiltration abundance of 22 types of immune cells in eight NASH samples and nine normal controls from the combined dataset (E-MEXP-3291 and GSE89632). B. The violin diagram shows the differences in the abundance of 22 types of immune cells between the NASH and control groups. Blue and red bars indicate normal and NASH samples, respectively.
| Immune Cell | Gene | R a | P-Value | Q-Value b |
|---|---|---|---|---|
| Activated dendritic cells | SYK | -0.697731584 | 0.001844931 | 0.01833562 |
| Activated dendritic cells | CXCL10 | -0.684242924 | 0.002449187 | 0.01943022 |
| Activated dendritic cells | VAMP3 | -0.659718088 | 0.003958514 | 0.024026602 |
| Activated dendritic cells | MRAS | -0.619252109 | 0.00802977 | 0.039814276 |
| Activated dendritic cells | AVPR1A | 0.70141031 | 0.00170334 | 0.01833562 |
| Resting dendritic cells | CXCR1 | -0.760303501 | 0.000396191 | 0.009438255 |
| Resting dendritic cells | CXCL2 | -0.666025867 | 0.003512852 | 0.023302488 |
| M2 macrophages | ACVR2B | -0.617647059 | 0.009698737 | 0.046165989 |
| M2 macrophages | CXCL2 | -0.607843137 | 0.011192078 | 0.046651756 |
| M2 macrophages | VAMP3 | 0.644607843 | 0.006395802 | 0.034595476 |
| Monocytes | FGFR2 | -0.637254902 | 0.007189792 | 0.037199359 |
| Monocytes | SOS1 | -0.607843137 | 0.011192078 | 0.046651756 |
| Neutrophils | FGFR2 | -0.760269916 | 0.000396565 | 0.009438255 |
| Neutrophils | CDH1 | -0.727161387 | 0.000941323 | 0.016002484 |
| Neutrophils | SYK | -0.703862793 | 0.001613999 | 0.01833562 |
| Neutrophils | VAMP3 | -0.669528023 | 0.003283597 | 0.023302488 |
| Neutrophils | CXCL10 | -0.665849297 | 0.003524746 | 0.023302488 |
| Neutrophils | MRAS | -0.602084724 | 0.010545631 | 0.046651756 |
| Neutrophils | SMAD1 | 0.690374133 | 0.002157132 | 0.01833562 |
| Neutrophils | AVPR1A | 0.692826617 | 0.002048599 | 0.01833562 |
| Neutrophils | CXCL2 | 0.7627224 | 0.000369997 | 0.009438255 |
| Neutrophils | CXCR1 | 0.902513965 | 7.20E-07 | 8.57E-05 |
| Resting memory CD4 T cells | AVPR1A | -0.710784314 | 0.001926552 | 0.01833562 |
| Resting memory CD4 T cells | CXCR1 | -0.669117647 | 0.004239989 | 0.024026602 |
| Resting memory CD4 T cells | CXCL10 | 0.669117647 | 0.004239989 | 0.024026602 |
| Resting memory CD4 T cells | SYK | 0.713235294 | 0.001831279 | 0.01833562 |
| Resting memory CD4 T cells | CDH1 | 0.75245098 | 0.00074371 | 0.014750255 |
| Resting memory CD4 T cells | FGFR2 | 0.801470588 | 0.000158696 | 0.009438255 |
Abbreviation: DEG, differentially expressed gene.
a R stands for Spearman correlation coefficient.
b Q-value represents P-value adjusted by the Benjamini & Hochberg method, and Q < 0.05 indicates statistical significance.
5. Discussion
The onset of NASH is usually accompanied by lipid accumulation, liver cell damage, immune system dysfunction, and fibrosis, which may eventually lead to HCC (24). Therefore, the identification of biomarkers for the early diagnosis of NASH is of great significance in controlling the inflammatory response and the prevention of disease deterioration in patients with NASH. To explore the feature genes of NASH, we first identified 403 upregulated and 158 downregulated DEGs based on the analysis of 35 NASH samples and 43 healthy controls. Furthermore, we screened candidate genes by the PPI network-based module and LASSO regression analyses, resulting in the identification of 17 DEG signatures, including CXCL2, CXCL10, CXCR1, CXCL9, VAMP3, SMAD1, ACVR2B, CDH1, SYK, AVPR1A, ACTN1, GAS6, TNFSF10, CASP1, MRAS, FGFR2, and SOS1. Finally, by evaluating the relationship between the 17-DEG-signature and immune cell abundance in NASH and control samples, 12 DEG signatures were found to significantly correlate with six types of immune cells, including M2 macrophages and neutrophils. These results provide novel insights into the immune-regulatory mechanisms of NASH.
By performing enrichment analysis, we found that 561 DEGs in NASH were mainly enriched in the inflammatory response, innate immune response, signal transduction, cancer-related pathways, PI3K-Akt signaling pathway, and focal adhesion. Hepatic steatosis could trigger the release of stress signals from hepatocytes, thereby activating inflammatory pathways. On the other hand, the pattern recognition receptors expressed on the surface of cells can sense cellular damage and pathogen invasion and activate the innate immune response in NASH (25). Secretome gene analysis revealed a highly linked network of intrahepatic signals in NASH, and the signal transduction triggered by TGF-β-Smad3 was also shown to be involved in diet-induced NASH in mice (26, 27). Liu et al. pointed out that the inhibition of PI3K/AKT/mTOR pathways could enhance the autophagic flux of macrophages and thus inhibit the inflammatory response in mice with NASH (28). The activation of IRS2/PI3K/Akt signal transduction could also increase hepatic glycogen storage and improve insulin resistance while the dysregulation of the insulin-related PI3K/AKT-p70S6K pathway was involved in fibrosis development in NASH (29, 30). Additionally, Dattaroy et al. observed changes in the expression of focal adhesion proteins upon SsnB administration in animal models of liver fibrosis (31). These findings explain the possible involvement of enriched pathways and biological processes in disease regulation, thus further demonstrating that the obtained DEGs have certain pathogenic characteristics and are involved in NASH-related inflammatory and innate immune responses.
In this study, we highlighted the significance of the 17-DEG-signature in the development and progression of NASH and verified their expression by internal and external validation. By comparing the differences in the expression of these DEGs between normal, SS, and NASH samples, we found that CASP1 was significantly upregulated in the SS and NASH groups. Dixon et al. showed that caspase-1 (CASP1)-deficient mice might be less prone to high fat-induced SS and inflammation associated with NASH (32). This finding explains our results and further suggests that CASP1 is a risk factor for SS development and then its progression to NASH. Additionally, we identified several members of the CXC chemokine family as potential biomarkers for NASH, including CXCL2, CXCL9, CXCL10, and CXCR1. The role of the CXC chemokine family in NASH has been widely studied, and the hepatic infiltration of neutrophils and upregulation of CXCL1 are known to be involved in NASH (33). Another member of this family, CXCR3, plays an important role in the development of NASH by inducing cytokine production and macrophage infiltration (34). In addition, Semba et al. found that hepatocytes and sinusoidal endothelium, which express CXCL9, were confined to areas of inflammatory cell infiltration in mice with NASH (35). Our study further found that the expression of CXCL9 was significantly elevated during SS progression to NASH, suggesting that the overexpression of CXCL9 may correlate with the activation of inflammatory responses in this condition. Regarding CXCL10, there was an increasing trend in the expression of this gene from normal to SS to NASH. A related study confirmed our results and reported that CXCL10 was upregulated in NASH, and that the level of circulating CXCL10 was associated with lobular inflammation, suggesting a key role for CXCL10 as an inflammatory mediator of NASH (36). These data illustrated that the DEG signatures identified here could be important therapeutic targets for NASH, but their integrative effects on the disease pathogenesis remain to be explored.
We found that NASH and normal samples had significant differences in the abundance of immune cells. Among these cells, neutrophils showed the greatest difference between the two groups, and NASH samples showed enhanced infiltration of neutrophils. van der Windt et al. found early neutrophilic infiltration, macrophage influx, and production of inflammatory cytokines in mice with high fat diet-induced NASH (37). Wu et al. also proposed that enhanced neutrophil infiltration was a major histological feature of NASH (38). Furthermore, the overexpression of CXCL1 in the liver may drive NASH progression through facilitating the activation of stress kinases and neutrophil infiltration (39). In addition to neutrophil-related DEGs, we also identified 12 DEG signatures related to dendritic cells, M2 macrophages, monocytes, and memory CD4 T cells in NASH. Many of these relationships between DEG signatures and immune cells were initially found to be involved in the development of NASH. Related studies have reported that the loss of p38α expression in macrophages can ameliorate steatohepatitis in mice through reducing the secretion of proinflammatory cytokines, including TNF-α, CXCL10, and IL-6 (40). Moreover, the immune infiltration of macrophages plays a crucial role in the CXCL10-mediated inflammatory response in mice with NASH (41). In this study, we found an increased expression of CXCL10, as well as decreased infiltration of M2 macrophages in NASH samples. Combined with the above findings, we hypothesized that CXCL10 may activate the inflammatory response by regulating macrophage polarization. However, the current understanding of cell-gene interactions that may stimulate the NASH-related inflammatory response is limited, and our study provided a systematic network of interactive relations as the theoretical basis for future research.
In the current study; however, the expression of these 17 gene signatures was not validated in the tissues of patients with NASH due to the lack of clinical biopsy samples. Furthermore, the lack of the experimental verification of the relationships between DEG signatures and immune cell populations was another limitation of this study. Additionally, the sample size in this study was not large enough to fully explain the key roles of these gene signatures in the development of NASH. Therefore, in future studies, we will expand the sample size to validate the significance of these 17 DEG signatures in NASH and further investigate their regulatory mechanisms in triggering immune responses in NASH.
5.1. Conclusions
We identified 561 DEGs in NASH tissue samples and explored their biological functions and related pathways involved in the development of NASH. The 17-DEG-signature was further identified from candidate genes in the PPI network and related submodules. Finally, 12 DEG signatures were found to be associated with activated dendritic cells, resting dendritic cells, M2 macrophages, monocytes, neutrophils, and resting memory CD4 T cells and probably govern the increase of these immune cells in NASH samples compared to healthy controls. Our results identified valuable biomarkers in NASH, which can role as potential therapeutic targets regulating the mechanisms underlying NASH-related inflammatory responses.

