


1. Background
Hepatoblastoma, which originates from hepatic primordial embryonic cells (1-3), is the most common primary epithelial malignant tumor in children. The incidence rate of hepatoblastoma has been increasing in the past 30 years (4), and the treatment of hepatoblastoma includes chemotherapy, surgical resection, and liver transplantation (5-7). At present, surgical resection is still the first-line treatment for the initial diagnosis of hepatoblastoma. With the development of these treatments, the curative effect of hepatoblastoma has made great progress, and the survival outcome has also been greatly improved (8, 9). In the past ten years, immunotherapy has made a great breakthrough in cancer treatment, showing good therapeutic effect in various malignant tumors, especially in melanoma, lung cancer, urothelial carcinoma, head and neck squamous cell carcinoma, renal cell carcinoma, and Hodgkin's lymphoma (10, 11). However, there is still a great need to investigate hepatoblastoma, and a clear understanding of the tumor immune microenvironment will contribute to the application of this treatment in hepatoblastoma.
Tumor microenvironment (TME) is mainly composed of stromal cells and immune cells. An increasing number of studies have shown that TME plays a crucial role in the progression and treatment of many cancers (12-14). The immune cells include cytotoxic T cells, helper T cells, dendritic cells (DCS), tumor-associated macrophages, and mesenchymal stem cells, and the composition of these cells determines the prognosis of a variety of tumors. Several studies based on the gene expression profile data of the immune-related score have predicted the prognosis of the tumor and have been applied in a variety of tumors (15-18). Therefore, TME and immune-related genes may play an essential role in tumor therapy. Recently, algorithms based on gene expression profiles have made great progress, which can evaluate the composition of various cellular components in TME (19-21).
In this study, we first determined the immune score of hepatoblastoma by the ESTIMATE algorithm (21) and identified immune-related genes by WGCNA (22). We performed consensus cluster analysis on hepatoblastoma based on the expression characteristics of these immune genes and analyzed the immunocyte infiltration by the ssGSEA algorithm (23). Finally, we constructed a prognostic risk scoring system based on these immune score-related genes, which could be used to evaluate the prognosis of patients with hepatoblastoma.
2. Methods
2.1. Hepatoblastoma Data Sets and Preprocessing
We searched the GEO and ArrayExpress databases to find the hepatoblastoma data set with survival information published in the public database. Finally, a total of two data sets, ie, GSE75271 and E-MEXP-1851, were retrieved (24, 25). The analysis platform used for both groups was the expression chip of Affymetrix. The former was the hgu133plus2 chip, containing five normal tissue chip expression profiles and 50 tumor tissue chip expression profiles, and the latter was the hgu133a chip, containing four normal tissue chip expression profiles and 24 tumor tissue chip expression profiles. After downloading the original chip data, the RMA algorithm in the R package AFFY was used for background correction, data standardization, and other processing to obtain the expression matrix. We converted the probe ID into a gene symbol and then combined the data according to the gene symbol shared by the two expression matrices to obtain an expression matrix containing 83 samples and 12402 genes. Further, the combat function of the sva package was used to correct batch effect and remove normal control samples, and a total of 68 samples with survival information were used for subsequent analysis.
2.2. Inference of Sample Immune Score
The ESTIMATE algorithm is a tool for predicting tumor purity. It uses gene expression data to predict the infiltration degree of stromal and immune cells in tumor tissue. It obtains three kinds of scores, namely stromal score, immune score, and estimate score, representing the proportion of stromal in tumor tissue, immune cell infiltration, and tumor purity, respectively. The calculated immune score was used to search for an optimal cut-off by the survminer package, and the Kaplan-Meier method was used to evaluate the prognostic value of the immune score in patients with hepatoblastoma.
2.3. Identification of Co-expression Network Modules and Immune-related Modules
The WGCNA software package was used to build co-expression networks. The algorithm first calculated Pearson's correlation coefficient for each gene and used its absolute values to construct the gene expression similarity matrix. The optimal β-value was selected to construct the proximity matrix so that our gene distribution fitted the connection-based scale-free network. The adjacent matrix and the topological matrix were obtained based on the β-value, and the distance between the genes was represented by the dissimilarity between the genes calculated by the topological overlap matrix (TOM). Then, the gene cluster tree was divided into different modules (the minimum number of genes in each module was 30). A power of β = 7 and a scale-free R2 = 0.91 were set as soft-threshold parameters to ensure a signed scale-free co-expression gene network. Eigengene connectivity was the correlation between a gene’s expression profile and the module eigengene. We kept genes whose connectivity to their module gene was greater than 0.8 to increase the stability of the module, and a total of 2489 genes were filtered and then analyzed by WGCNA. MEDissThres was set to 0.7 to merge similar modules.
The hierarchical clustering module closely related to the immune score was selected as the module for subsequent analysis, and gene significance (GS), module significance (MS), and module eigengene (ME) were calculated. GS was defined as the correlation between gene expression and clinical information, calculated by the log10 conversion of p-value in linear regression. MS was the average importance of all genes in the module. ME was the first principal component obtained through the principal component analysis of the gene expression matrix of each module, which represented the value of the gene expression profile in the module. Univariate COX analysis was performed on all genes in the module to further evaluate the prognostic value of each gene in the immune score-related module.
2.4. Identification of Molecular Subtypes
The unsupervised clustering algorithm was used to identify the expression patterns of black module gene expression, and finally, the number and stability of the categories were determined. This step was completed by the "CancerSubtyeps" package (26). Then, the ConsensusClusterPlus algorithm (27) was applied, and 1000 operations were repeated to ensure the stability of the results. The Kaplan-Meier method was used to evaluate the prognosis of the two subtypes.
2.5. Analysis of Differentially Expressed Genes
Differentially expressed genes (DEGs) were analyzed using the "Limma" package (28). The software package used the empirical Bayes method and improved t-test to analyze gene expression changes of the molecular subtypes. The Benjamini-Hochberg method was used to correct the corrected P-values for multiple tests. Genes with a corrected P-value < 0.05 and |log FoldChange| > 1 were identified as differential genes between the molecular subtypes.
2.6. Immune Cell Infiltration in Tumor Microenvironment
The ssGSEA was introduced to calculate the relative infiltration of immune cells in TME. Markers of immune cells were obtained from recently published literature (29). The relative abundance of each type of immune cell was expressed by the enrichment fraction in ssGSEA analysis. Then, the enrichment fraction was standardized, with 0 being the lowest abundance and 1 the highest abundance.
2.7. Functional Annotation and PPI Network Construction
For inferring the potential biological functions of genes in the immune-related modules, the clusterProfiler package was used for gene ontology (GO) enrichment analysis and the Kyoto encyclopedia of genes and genomes enrichment analysis. The threshold was set to P < 0.05 after adjustment. At the same time, the identified genes in the immune-related modules were used to construct PPI gene network interaction analysis by Metascape (30). The Metascape database searches for known and predicted protein interactions and studies interaction networks between proteins to help identify core regulatory genes with the highest MCODE score performed by screening with MCODE (31).
2.8. Gene Set Enrichment Analysis
Gene set enrichment analysis (GSEA) (32) was used to identify up-regulated or down-regulated gene pathways between different molecular subtypes. All the genes were ranked from large to small according to log-fc (log fold change) after difference analysis as the input gene set, and weighted enrichment statistics were used to calculate the enrichment fraction of each gene set. One thousand phenotype permutations were used to evaluate significance. The reference gene set was the Hallmark gene set (H.A.V7.0 data set downloaded from MsigDB database), and the gene sets were defined as significant at the 5% level with a false discovery rate under 25%.
2.9. Prognostic Gene Signature-based Risk Score
The whole cohort was divided into training set and verification set according to 7:3. Then, the L1 regularization (lasso) of the glmnet package of R language was used to fit the Cox-PH model of immune score-related genes to determine the gene signature for prognosis. L1 regularization (lasso) is a useful method to determine the interpretable prediction rules in high-dimensional data (33). The optimal lambda value was selected through 1000 cross-validations, and a set of prognostic genes were identified. According to the expression levels of these prognostic genes and their regression coefficients from the COX-PH model, an equation for calculating risk score was generated as follows:
Risk score = βgene 1 × exprgene 1 + βgene 2 × exprgene 2 +····+ βgene n × exprgene n
The risk score was calculated and assigned to each patient in the training group. The survminer R package was used to determine the best cut-off value, and all patients in the training set were divided into a high-risk group and a low-risk group. The overall survival (OS) time of the two risk groups was compared by Kaplan-Meier survival analysis and the log-rank test. The robustness of the risk scoring system was verified in the validation set and the entire cohort. Kaplan-Meier survival analysis and the log-rank test were used to analyze OS time between the risk groups.
2.10. Statistical Analysis
The Shapiro Wilk test was used to assess the normality of the variables. Statistical significance differences among the normally distributed variables were estimated using the unpaired Student t-test, and the non-normally distributed variables were analyzed using the Mann-Whitney U test. The Kruskal-Wallis and one-way ANOVA tests were used as nonparametric and parametric methods for three or more data sets, respectively. The correlation was calculated by Pearson’s correlation coefficient. The Kaplan-Meier method was used to calculate the survival rate, and the log-rank test was used to determine the significance of differences between the survival curves. Regarding the heterogeneity among different types of cancer, the optimal cut-off value of each continuous prognostic marker was recalculated using the survminer R package for different tumor types. Univariate and multivariate analyses were performed using the Cox proportional risk model. The survival prediction accuracy of the prediction model was evaluated according to time-dependent receiver operating characteristic curve (ROC) analysis. All statistical analyses were performed using the R package (version 3.6.3), with P-values of two tails, and the statistical significance was set as å = 0.05.
3. Results
3.1. High Immune Score in Hepatoblastoma Benefiting Survival of Patients
We first combined the data and removed the effect of batch processing, as shown in Appendix 1 in Supplementary File. We first analyzed four kinds of scores for hepatoblastoma using the ESTIMATES package to clarify the relationship between the immune score and the survival of patients with hepatoblastoma. The basic information and immune score values of the patients are shown in Appendices 2 and 3 in Supplementary File. We realized that patients with high immune scores had a better prognosis than those with a low immune score. These results suggested that high immune scores were associated with longer survival in hepatoblastoma (Figure 1A).
 Kaplan-Meier curves showed that in the GSE75271, E-MAXP-1851 cohort, patients with higher immune scores had longer OS than patients with lower immune scores. (B) WGCNA identified 13 modules by unsupervised clustering. (C) The black module had the highest correlation with the immune score (r = 0.99, P = 2e-54), and the black module gene was called the immune score-related gene. (D) The gene significance and module membership of the genes in the black module exhibited a high correlation. (F) The forest plot with a hazard ratio for the genes of the univariable model in the black module. The hazard ratio below one indicated that a gene was negatively associated with the event probability and thus positively associated with survival time. The box size was based on precision, and the x-axis had a logarithmic scale (a bigger box size represented a more precise confidence interval (95% CI)).")
Prognostic value of immune score and identification of immune-related genes. (A) Kaplan-Meier curves showed that in the GSE75271, E-MAXP-1851 cohort, patients with higher immune scores had longer OS than patients with lower immune scores. (B) WGCNA identified 13 modules by unsupervised clustering. (C) The black module had the highest correlation with the immune score (r = 0.99, P = 2e-54), and the black module gene was called the immune score-related gene. (D) The gene significance and module membership of the genes in the black module exhibited a high correlation. (F) The forest plot with a hazard ratio for the genes of the univariable model in the black module. The hazard ratio below one indicated that a gene was negatively associated with the event probability and thus positively associated with survival time. The box size was based on precision, and the x-axis had a logarithmic scale (a bigger box size represented a more precise confidence interval (95% CI)).
3.2. Identification of a Gene Signature Associated with Immune Score
The immune score-related genes were identified and obtained by WGCNA analysis. The genes were clustered into 13 modules (Figure 1B). Pearson’s correlation coefficient (Figure 1C) was used to express the correlation between modules and immune scores. The black module showed the highest correlation with the immune score (cor: 0.99, P < 0.001).
The diagram of module membership and gene importance illustrated the significant correlation for each gene in the black module (cor: 0.99, Figure 1D). Then, univariate Cox regression analysis was used to analyze each gene in the black module, and 59 genes significantly associated with survival in patients with hepatoblastoma were identified (Figure 1F). The heat map showed the relative expression of 146 genes in the black module (Figure 1E). We defined these 146 genes as immune score-related genes, and their expressions are shown in Appendix 4 in Supplementary File.
3.3. GO Analysis and Protein-Protein Interaction Analysis for Immune Score Related Genes
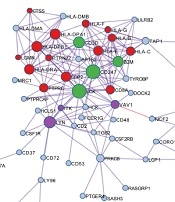
GO analysis revealed that T cell activation, antigen processing and presentation, T cell differentiation, and other immune-associated pathways were associated with the immune score-related genes (Figure 2A). Protein-protein interaction (PPI) enrichment was done among the list of immune score-related genes. The PPI network represented interactions between proteins. The PPI diagram of the input genes (Figure 2B) showed that CD247, LCK, HLA-DPA1, and HLA-DPB1 were the core of the network, and these genes were mainly involved in the immune response cell surface receptor signaling pathway and cell-cell adhesion signaling pathway regulation. The molecular complex detection (MCODE) method was applied to identify closely related proteins from the PPI network. The MCODE algorithm subclustered the PPI network into five subclusters, and five MCODE components were made (Figure 2C).
 GO analysis was performed based on the 146 immune score-related genes. (B) The PPI network of immune score-related genes. (C) The MCODE algorithm was applied to this network to identify neighborhoods where proteins were densely connected. Each of the five colors represents five different MCODES.")
GO annotation and protein-protein interaction of immune score-related genes. (A) GO analysis was performed based on the 146 immune score-related genes. (B) The PPI network of immune score-related genes. (C) The MCODE algorithm was applied to this network to identify neighborhoods where proteins were densely connected. Each of the five colors represents five different MCODES.
3.4. Identification of Molecular Subtypes Based on Immune Score Related Genes in Hepatoblastoma
Two different expression patterns of these genes could be observed in the heat map of the expression profile of the immune score-related genes in hepatoblastoma. Therefore, we wondered whether these immune score-related genes could be used to distinguish the molecular subtypes of hepatoblastoma. We applied the consistent clustering method to unsupervised clustering based on the immune score-related genes in hepatoblastoma and identified two molecular subtypes, subtype 1 and subtype 2. The two molecular subtypes had different prognostic characteristics (P = 0.0036) (Figure 3A), and the average silhouette width was used to evaluate the clustering effect of the samples (Appendix 1 in Supplementary File). These results suggested that these immune score-related genes could classify hepatoblastoma into two molecular subtypes (subtype 1 and subtype 2) with different prognostic and molecular characteristics, and patients with molecular subtype 1 had better survival than those with molecular subtype 2.
 Kaplan-Meier curves were used to evaluate survival differences between the two molecular subtypes. (B) Differently expression genes between the two molecular subtypes. (C) GO analysis. Red to blue indicated the number of p adjusted from large to small, and the length of the bar graph indicated the number of genes enriched. (D) Up-regulated pathways in GSEA analysis. (E) Down-regulated pathways in GSEA analysis. (F) The difference in the distribution of immune cells between subtype 1 and subtype 2.")
Identification of molecular subtypes based on immune score-related genes. (A) Kaplan-Meier curves were used to evaluate survival differences between the two molecular subtypes. (B) Differently expression genes between the two molecular subtypes. (C) GO analysis. Red to blue indicated the number of p adjusted from large to small, and the length of the bar graph indicated the number of genes enriched. (D) Up-regulated pathways in GSEA analysis. (E) Down-regulated pathways in GSEA analysis. (F) The difference in the distribution of immune cells between subtype 1 and subtype 2.
Differential genes of the two molecular subtypes were identified by differential gene analysis, and the heat map showed the expression of differential genes in the two molecular subtypes (Figure 3B). Then, DEGs were subjected to GO analysis (Figure 3C). The results revealed enrichments in the small molecule catabolic process, the carboxylic acid biosynthetic process, the organic acid biosynthetic process, and the organic acid catabolic process. GSEA was performed on molecular subtype 1 and subtype 2 hepatoblastoma. Up-regulated pathways included pathways related to cell cycle, DNA replication, and P53 signaling pathway in subtype 2 (Figure 3D). Down-regulated pathways included pathways related to drug metabolism cytochrome p450, fatty acid metabolism, and peroxisome in subtype 2 (Figure 3E). The immune cell population distribution in subtype 1 and subtype 2 further illustrated different tumor immune microenvironments in the two molecular subtypes of hepatoblastoma (Figure 3F). Among all immune cell populations, the macrophage and the activated CD4 T cell showed the most significant difference between subtype 1 and subtype 2, but most immune cells did not show much difference (Figure 3F).
3.5. Development and Validation of a Risk Scoring System Based on Immune Score Related Genes
Based on the expression of these immune score-related genes in the training set and the Cox-PH model of LASSO, five gene signatures, including CXCL9, PSMB8, MYO1F, GZMK, and FAM49A, significantly related to the survival rate were identified. The risk score for each patient was calculated using the following formula:
Risk score = -0.2187 × expression of CXCL9 + 0.1361 × expression of GZMK + -0.7372 × expression of PSMB8 + 0.8170 × expression of FAM49A + -0.1239 × expression of MYO1F.
The risk score and survival of all patients in the whole cohort of hepatoblastoma and the expression of five genes are shown in Figure 4D. All patients in the training set were divided into a high-risk group and a low-risk group according to the optimal cut-off value. Compared to the low-risk group, the high-risk group had a significantly shorter OS time (Figure 4A, log-rank, P < 0.0001). In the internal validation set, we tested the prognostic performance of the risk scoring system based on the above five gene signature. Patients in the internal validation set were divided into a high-risk group and a low-risk group according to the above cut-off value. Similarly, OS time was significantly longer in the low-risk group than in the high-risk group (Figure 4B, log-rank, P = 0.003). Finally, we validated the risk scoring system in the whole hepatoblastoma cohort. Similarly, the OS time of the high-risk group was shorter than that of the low-risk group (Figure 4C, log-rank, P < 0.0001). At the same time, we evaluated the risk scoring system to judge the prognosis of OS in the whole cohort. The results showed that the receiver operating characteristic (ROC) curve illustrated a high accuracy rate with the area under the curve of 1-year OS, 3-year OS, and 5-year OS reaching 0.84, 0.83, and 0.81, respectively (Figure 4E). Furthermore, the risk score was negatively correlated with the immune score (r = -0.4, P < 0.001), (Figure 4F). We conducted correlation analysis with quantified immune cells to further conclude the role of the risk score. The results showed that the immune score was negatively correlated with the activated CD8 T cell and the type 1 T helper cell, and positively correlated with neutrophil, suggesting that the risk score was correlated with the components of immune cells in the immune microenvironment (Figure 4G).
 Kaplan-Meier curves were used to evaluate the impact of the immune risk score on OS in the training set, the internal validation set, and the entire cohort. The red curves represented the high-risk score, and the blue curves represented the low-risk score. (D) The five-gene signature-based immune risk score in the prognosis of overall survival in the whole data. The black dot plots represented the distribution of immune risk scores, the blue and red dot plots represented the survival status of patients with hepatoblastoma, and the heat maps represented the expression of five genes (E). An ROC was used to evaluate the predictive ability of the immune risk scoring system in patients with hepatoblastoma in 1, 3, and 5 years. AUC, the area under the ROC curve. (F) The correlation between the risk score and the immune score. (E) The correlation between the immune risk score and the ssGSEA score of immune cells. The X-axis was the -log<sub>10</sub>P-value of the correlation coefficient. The lower right quadrant represented P < 0.05 and positive correlation, while the upper right quadrant represented P < 0.05 and negative correlation. The red dots represented immune cells with anti-tumor effects, the blue dots represented immune cells with protective effects on tumor cells, and the green dots represented cells with unclear effects on tumor cells.")
Immune risk scoring system predicted OS in patients with hepatoblastoma. (A-C) Kaplan-Meier curves were used to evaluate the impact of the immune risk score on OS in the training set, the internal validation set, and the entire cohort. The red curves represented the high-risk score, and the blue curves represented the low-risk score. (D) The five-gene signature-based immune risk score in the prognosis of overall survival in the whole data. The black dot plots represented the distribution of immune risk scores, the blue and red dot plots represented the survival status of patients with hepatoblastoma, and the heat maps represented the expression of five genes (E). An ROC was used to evaluate the predictive ability of the immune risk scoring system in patients with hepatoblastoma in 1, 3, and 5 years. AUC, the area under the ROC curve. (F) The correlation between the risk score and the immune score. (E) The correlation between the immune risk score and the ssGSEA score of immune cells. The X-axis was the -log10P-value of the correlation coefficient. The lower right quadrant represented P < 0.05 and positive correlation, while the upper right quadrant represented P < 0.05 and negative correlation. The red dots represented immune cells with anti-tumor effects, the blue dots represented immune cells with protective effects on tumor cells, and the green dots represented cells with unclear effects on tumor cells.
4. Discussion
In the past ten years, tumor-related microenvironment and immunotherapy have made great progress. Hepatoblastoma, as the most common liver malignant tumor in children and newborns, has not been reported on a large scale in this field, which is related to the low incidence of hepatoblastoma and its relatively few cases. Based on the data mining of previously published microarray data, we conducted a series of data analyses on the microenvironment and immune-related genes of hepatoblastoma. The composition of TME and molecular subtypes was preliminarily clarified based on the immune score-related genes of hepatoblastoma. Two molecular subtypes with different prognoses were identified, and the composition of different immune cells in the TME of the two molecular subtypes was discussed. Finally, a prognostic risk score was fitted. According to the prognostic risk score, patients with hepatoblastoma were divided into a high-risk group and a low-risk group. As a result, the prognosis score was negatively correlated with the immune score, the activated CD8 T cell, and the type 1 T helper cell but positively correlated with neutrophil.
Our results showed that the immune score calculated by the ESTIMATE algorithm had a prognostic value in hepatoblastoma. Patients with high immune scores had relatively good prognoses. Previous studies also confirmed that the immune score obtained by the ESTIMATE algorithm had a prognostic value in a variety of malignant tumors, such as colorectal cancer (34, 35), lung adenocarcinoma (36), breast cancer (37), prostate cancer, and liver cancer (38, 39), which is consistent with our analysis results. Our results further confirmed that the immune score had a good prognostic value in a variety of tumors. However, the calculation of the immune score involves a large number of genes, which usually requires the microarray analysis or second-generation sequencing of tumor tissue samples, which limits the clinical application of this index.
Therefore, WCGNA analysis was used to identify the most relevant modules of the immune score. The functional enrichment analysis of genes in the black module indicated that most of these genes were involved in immune-related cellular pathways. Protein interaction analysis showed obvious interaction among these genes. The MCODE results further indicated that some genes were involved in the process of antigen presentation, such as HLA-A, HLA-B, and HLA-C. Some genes were mainly concentrated in the chemotactic process of cells, and studies have shown that these cytokines are involved in the recruitment of immune cells from TME. Univariate Cox regression analysis showed that most of these genes had prognostic values, indicating that the immune score-related genes identified by WGCNA played an essential role in hepatocytes.
We obtained two molecular subtypes of hepatoblastoma with different prognoses by congruent cluster analysis to further investigate the role of these immune score-related genes. The different prognoses of the two subtypes further suggested that the different expression patterns of these immune score-related genes impacted the survival of patients with hepatoblastoma. The results of immune infiltration analysis showed that the different expression patterns of the immune score-related genes were associated with different expressions in infiltrating immune cells. These results supported the importance of the gene sets identified in hepatoblastoma. Two hepatoblastoma molecular subtypes with different prognoses showed no significant differences in the analysis of immune cell infiltration, which mainly focused on the activated CD4 T cell, the activated dendritic cell, the CD56 bright natural killer cell, the macrophage, and the regulatory T cell. Our results also confirmed, to a certain extent, that different patterns of immune cell infiltration impacted the prognosis of patients with hepatoblastoma.
The variables were screened by LASSO, and CXCL9, PSMB8, MYO1F, GZMK, and FAM49A were selected to construct a risk scoring system based on immune scoring genes. Patients with hepatoblastoma could be divided into two groups with different prognoses and risk scores according to the calculated best cut-off value of the risk score. The stability of the scoring system was also confirmed in the internal validation set. Finally, the prognostic value of the risk scoring system was verified across the entire cohort, and the robustness was further verified. Among the screened genes, PSMB8 was confirmed to promote the occurrence and metastasis of gastric cancer and was a potential biomarker for predicting the poor prognosis (40). PSMB8 is closely related to the migration, proliferation, and apoptosis of glioma cells and can be used as a new prognostic indicator of glioma (41). CXCL9 is produced by macrophages, endothelial cells, hepatocytes, and tumors. As a CXCR3 ligand, CXCL9 mainly acts as a chemokine that activates immune cells, including T cells and natural killer (NK) cells (42). CXCL9 is expressed in a variety of tumors, and its biological functions are diverse. Recently, studies by Fukuda et al. have shown that CXCL9 can be used as a prognostic indicator of intrahepatic cholangiocarcinoma (43). The upregulation of CXCL9 might provide a therapeutic strategy for intrahepatic cholangiocarcinoma expressing CXCL9 by enhancing anti-tumor immune monitoring. GZMK gene products are members of a group of related serine proteases in cytotoxic lymphocyte cytoplasmic granules. They are involved in the biological processes of cytolytic T lymphocytes and natural killer (NK) cells to recognize, bind and lyse specific target cells. At present, little is known about the role of FAM49A. It has been reported that CYRI-A, the post-translational product of FAM49A, is a dynamic regulator of large-scale pinocytosis, and it adjusts integrin together with CYPTI-B (the post-translational product of FAM49B, a family gene of FAM49A) (44). It has been reported that the mutation of MYO1F can increase the tumorigenicity of cells in vitro, which is characterized by accelerated growth and enhanced invasion. In thyroid cancer, the mutation of MYOF can lead to tumor proliferation (45). Our risk scoring system based on these genes can well predict the prognosis of patients with hepatoblastoma and verify that these cells might play an essential role in hepatoblastoma. However, further rigorous biological experiments are needed.
This study analyzed the prognostic value of the immune score in hepatoblastoma and identified genes related to the immune score according to the previously published hepatoblastoma chip data. According to the different expression patterns of these genes, two different molecular subtypes were identified and showed different patterns of immune cell infiltration. Finally, we constructed a risk scoring system based on five genes, which could be used to predict the prognosis of patients with hepatoblastoma. However, because hepatoblastoma was a rare disease, we could not further validate the findings in a larger case cohort. Our study was based on the data of previous studies. Thus, it was necessary to collect more specimens from patients with hepatoblastoma and complete clinical data for verification.
