


1. Background
Gamma-glutamyl transferase (GGT), situated on the external surface of the plasma membrane, is a glycosylated protein produced by the epithelial cells of the intrahepatic bile ducts. GGT can be used as a marker for alcohol consumption status and hepatobiliary diseases such as nonalcoholic fatty liver disease (NAFLD). GGT is indirectly correlated with chronic inflammation and increased oxidative stress, which are closely connected to metabolic disorders (1, 2). Moreover, the high ranges of GGT are correlated with cardiovascular diseases, atherosclerosis, type 2 diabetes, chronic kidney disease (CKD), and metabolic syndrome (MetS) (1, 3). MetS encompass several metabolic risk factors, including central obesity, high blood pressure, increased blood glucose hypertriglyceridemia, and low high-density lipoprotein (HDL) cholesterol. This syndrome is a major global public health problem since it increases the risk of malignancies, heart diseases, diabetes type II, and others (4).
There is a close relationship between serum GGT with insulin resistance and MetS components (5). Patients with MetS and high GGT are reported to be at a higher risk of cardiovascular disorders than individuals without MetS or patients with MetS and low GGT (6). Moreover, recent studies have documented a relationship between GGT and mortality (7-9). Some evidence demonstrates that the normal ranges of GGT are connected with increased cardiovascular diseases and all-cause mortality. This correlation was valid in both genders of normal and obese subjects, with or without cardiovascular diseases, after adjusting for intervening factors (7, 8). These findings imply that subjects with normal or elevated BMI may be metabolically healthy or unhealthy; hence, further studies are required to determine which biochemical parameters are connected with lower atherogenic and healthier metabolic health status in normal or obese individuals.
Although various studies have assessed the correlation between GGT and cardiometabolic risk factors in obesity, no research has differentiated among metabolically-healthy obese (MHO), metabolically-unhealthy obese (MUHO), metabolically-healthy lean (MHL), and metabolically-unhealthy lean (MUHL) individuals. Accordingly, GGT, as a simple, cost-effective test, is vital for the multi-marker approach in cardiovascular risk evaluation and can also be used to differentiate the metabolic subtypes (ie, cardiometabolic phenotype) (10-12).
2. Objectives
This is, while the correlation between GGT and cardiometabolic phenotype has not been investigated. Thus, this study examined the correlation between GGT and cardiometabolic phenotypes in healthcare workers in the Azar Cohort Study.
3. Methods
This cross-sectional study was conducted in 2020 by the Research Center for Liver, and Gastrointestinal Diseases of the Tabriz University of Medical Sciences using data obtained from healthcare workers enrolled in the Azar Cohort Study, a part of the Prospective Epidemiological Research Studies in Iran (PERSIAN) (13). The Azar Cohort Study was launched in 2014 to determine the risk factors of non-communicable diseases (NCDs) in East Azerbaijan province (14). We used data from 1,458 subjects of the cohort in the present study after obtaining written informed consent from all participants. The Ethics Committee of the Tabriz University of Medical Sciences, Tabriz, Iran (IR.TBZMED.REC.1400.627) approved this study.
We recruited participants from the Tabriz University of Medical Sciences, who were full-time and long-term contract employees aged 18 - 75 years and had no plan to retire in the next five years. A health professional was in charge of excluding the participants if they were pregnant or lactating or were diagnosed with disabling psychiatric disorders or physical illnesses. We also screened potential participants for not having a plan for retirement within the next five years.
3.1. Participants’ Demographic Characteristics
The questionnaires focused on the participants’ demographic characteristics, including gender, age, marital status, and level of education. Moreover, the individual’s personal habits such as drug consumption, smoking, hookah use, and alcohol consumption were recorded.
3.2. Anthropometric and Blood Pressure Measurements
The measured anthropometric data included weight, height, and body mass index (BMI; ratio of weight in kilograms to height in meters squared). The anthropometric measurements are described in detail elsewhere (13). Systolic blood pressure (SBP) and diastolic blood pressure (DBP) were measured using a mercury sphygmomanometer (Riester Exacta 1350 Sphygmomanometer, Germany) in the sitting position after 10 minutes of rest. The averages of two measurements on each arm (at a two-minute interval) were used for the statistical analyses.
3.3. Biochemical Factors
Blood samples were extracted after the overnight fasting of at least 12 hours. Enzymatic methods were used to characterize fasting blood sugar (FBS), GGT (15), high-density lipoprotein (HDL) triglyceride (TG), and cholesterol levels.
3.4. Definition of Metabolic Syndrome
The National Cholesterol Education Program Adult Treatment Panel III (ATP III) was considered to define metabolic syndrome (MetS) (16). Three or more of the following conditions confirmed the diagnosis of MetS: TG ≥ 150 mg/dL (or drug treatment for increased TG); waist circumference (WC) ≥ 102 cm in men and ≥ 88 cm in women; HDL-C values of < 40 mg/dL in men and < 50 mg/dL in women; increased systolic (≥ 130 mmHg) or diastolic blood pressure (≥ 85 mmHg) or the use of antihypertensive medications; and elevated fasting glucose (≥ 100 mg/dL) or the use of glucose-lowering medications.
Four groups of cardiometabolic phenotypes were determined based on the BMI cutoff point (25 kg/m2) and the presence of MetS. Then the participants were classified into four groups of MHL (BMI < 25 kg/m2 and no MetS), MUHL (BMI < 25 kg/m2 and MetS present), MHO (BMI ≥ 25 KG/m2 and no MetS), and MUHO (BMI ≥ 25 KG/m2 and MetS present).
3.5. Statistical Analysis
In this study, SPSS software version 11.5 (Chicago, IL, USA) was used for the data analysis. Continuous variables are demonstrated as mean ± standard deviation, and categorical variables are represented by frequencies (percentages). The four groups were compared using the chi-square, Kruskal-Wallis, and one-way ANOVA tests. The participants were also divided into the following serum GGT tertiles: Tertile 1: ≤ 14 U/L; Tertile 2: 15 - 23 U/L; and Tertile 3: ≥ 24 U/L. The multinomial logistic regression analysis was used to estimate the relationship between the cardiometabolic phenotype and the serum GGT tertile. Moreover, crude and adjusted odds ratios (ORs) and their corresponding 95% confidence intervals (CIs) were assessed. The effects of the intervening factors (ie, gender, age, marital status, level of education, and current smoking status) were also adjusted, and the MHL group was considered the reference group. The diagnostic value of the GGT area under the curve was calculated by the receiver-operating characteristics (ROC) curves (area under curve [AUC] and 95% CI, sensitivity, and specificity). According to the BMI classification, seven underweight participants were excluded. Finally, 1,451 subjects were included in the statistical analysis. In this study, P < 0.05 was set as the level of significance.
4. Results
4.1. Participants’ Characteristics
Table 1 presents the participants’ baseline characteristics according to their GGT tertiles. Among the three tertiles, the third tertile had the highest proportion of male and married participants. Moreover, there were significant differences in the prevalence of cardiometabolic phenotypes among the GGT tertiles (P ≤ 0.001). The highest prevalence of MHO was observed in the third tertile of GGT (Table 1). Furthermore, the mean values of FBS, TG, WC, cholesterol, HDL, SBP, DBP, and BMI showed incremental trends from the first GGT tertile to the third GGT tertile (P ≤ 0.001) (Table 1). As presented in Table 2, the third tertile had the smallest number of females (P < 0.001) as a GGT dose-dependent variable in the MHO, MUHO, and MHL classes of cardiometabolic phenotypes. Interestingly, the mean values of WC, TG, FBS, cholesterol, DBP, and SBP were higher in the MHL, MHO, and MUHO groups, representing a dose-response manner matching the GGT tertile (P < 0.05) (Table 2).
| GGT (U/L) | P-Value | |||
|---|---|---|---|---|
| Tertile 1 ≤ 14 (n = 471) | Tertile 2 = 15 - 23 (n = 485) | Tertile 3 ≥ 24 (n = 495) | ||
| Gender | € < 0.001 | |||
| Male | 99 (21) | 255 (52.6) | 371 (74.9) | |
| Female | 372 (79) | 230 (47.4) | 124 (25.1) | |
| Level of education | €€ < 0.001 | |||
| Illiterate | 5 (1.1) | 14 (2.9) | 10 (2) | |
| Primary school | 14 (3) | 31 (6.4) | 40 (8.1) | |
| High school | 68 (14.4) | 77 (15.9) | 112 (22.6) | |
| University | 384 (81.5) | 363 (74.8) | 333 (67.3) | |
| Marital status | € < 0.001 | |||
| Married | 394 (83.7) | 420 (86.6) | 463 (93.5) | |
| Single | 77 (16.3) | 65 (13.4) | 32 (6.5) | |
| Cardiometabolic phenotype | €€€ < 0.001 | |||
| *MHL | 146 (31) | 115 (23.7) | 57 (11.5) | |
| **MUHL | 3 (0.6) | 7 (1.4) | 2 (0.4) | |
| ¶MHO | 290 (61.6) | 294 (60.6) | 322 (65.1) | |
| ¶¶MUHO | 32 (6.8) | 69 (14.2) | 114 (23) | |
| Smoking status | € < 0.001 | |||
| Yes | 13 (2.7) | 43 (9) | 59 (11.9) | |
| No | 456 (96.9) | 437 (90.1) | 434 (88) | |
| Alcohol consumption | € 0.89 | |||
| Yes | 1 (0.2) | 5 (1) | 3 (0.6) | |
| No | 470 (99.6) | 480 (99) | 492 (99) | |
| Drug use | ||||
| Yes | - | - | - | |
| No | - | - | - | |
| Age (y ) | 41.51 ± 6.16 | 42.83 ± 7.09 | 43.21 ± 6.74 A | ¥ < 0.001 |
| Waist circumference (cm) | 92.08 ± 8.37 | 95.17 ± 8.9 | 98.75 ± 8.7 B | ¥ < 0.001 |
| Triglyceride (mg/dL) | 96.12 ± 38.40 | 118.83 ± 50.85 | 147.90 ± 77.32 B | ¥ < 0.001 |
| Fasting blood sugar (mg/dL) | 81.67 ± 15.93 | 86.34 ± 19.39 | 90.89 ± 23.39 B | ¥ < 0.001 |
| High density lipoprotein (mg/dL) | 48.35 ± 11.01 | 45.45 ± 10.35 | 43.96 ± 9.85 B | ¥ < 0.001 |
| Cholesterol (mg/dL) | 157.53 ± 33.98 | 166.95 ± 35.79 | 177.76 ± 37.91 B | ¥ < 0.001 |
| Systolic blood pressure (mm Hg) | 105.13 ± 12.73 | 110.59 ± 13.69 | 116.44 ± 14.72 B | ¥ < 0.001 |
| Diastolic blood pressure (mm Hg) | 73.06 ± 8.27 | 76.01 ± 8.77 | 79.27 ± 9.55 B | ¥ < 0.001 |
| Body mass index (kg/m2) | 26.73 ± 3.64 | 27.50 ± 3.91 | 29.06 ± 4.01 B | ¥ < 0.001 |
| GGT (UL/L) | P-Value | |||
|---|---|---|---|---|
| Tertile 1 ≤ 14 (n = 471) | Tertile 2 =15 - 23 (n = 485) | Tertile 3 ≥ 24 (n = 495) | ||
| * MHL | ||||
| Gender | € < 0.001 | |||
| Male | 35 (24) | 83 (72.2) | 46 (80.7) | |
| Female | 111 (76) | 32 (27.8) | 11 (19.3) | |
| Age (y) | 40.99 ± 6.70 | 41.60 ± 6.78 | 41.28 ± 7.21 | ¥ 0.77 |
| Waist circumference (cm) | 85.09 ± 5.70 | 87.25 ± 5.82 | 86.84 ± 5.30 AB | ¥ 0.02 |
| Triglyceride (mg/dL) | 86.09 ± 32.16 | 107.10 ± 47.13 | 106.08 ± 38.56 AB | ¥ 0.007 |
| Fasting blood sugar (mg/dL) | 80.78 ± 9.52 | 84.06 ± 12.53 | 85.42 ± 18.26 AB | ¥ < 0.001 |
| High density lipoprotein (mg/dL) | 49.58 ± 10.99 | 47.15 ± 10.75 | 45.65 ± 8.99 C | ¥ 0.03 |
| Cholesterol (mg/dL) | 152.14 ± 33.87 | 163.30 ± 32.47 | 165.50 ± 34.91 D | ¥ 0.006 |
| Systolic blood pressure (mm Hg) | 101.23 ± 11.20 | 108.11 ± 13.06 | 109.98 ± 13.41 D | ¥ < 0.001 |
| Diastolic blood pressure (mm Hg) | 70.26 ± 7.19 | 74.01 ± 7.16 | 74.74 ± 7.85 D | ¥ < 0.001 |
| ** MUHL | ||||
| Gender | €0.33 | |||
| Male | 1 (33.3) | 4 (57.1) | 0 (0) | |
| Female | 2 (66.7) | 3 (42.9) | 2 (100) | |
| Age (y) | 50.33 ± 7.37 | 42 ± 5.47 | 44 ± 2.82 | ¥ 0.16 |
| Waist circumference (cm) | 90.06 ± 2.0 | 90.91 ± 6.44 | 92.5 ± 0.70 | ¥ 0.11 |
| Triglyceride (mg/dL) | 182 ± 86.48 | 194.14 ± 34 | 112 ± 67.88 | ¥ 0.95 |
| Fasting blood sugar (mg/dL) | 75 ± 2.64 | 83.42 ± 12.84 | 124 ± 65.05 | ¥ 0.46 |
| High density lipoprotein (mg/dL) | 41 ± 6 | 39.29 ± 5.64 | 46 ± 0.0 | ¥ 0.34 |
| Cholesterol (mg/dL) | 161 ± 14.17 | 167.42 ± 37.19 | 160.5 ± 55.86 | ¥ 0.88 |
| Systolic blood pressure (mm Hg) | 114.33 ± 6.02 | 119.95 ± 18.03 | 97.5 ± 3.53 | ¥ 0.23 |
| Diastolic blood pressure (mm Hg) | 85.33 ± 0.57 | 78.85 ± 15.38 | 67.50 ± 3.53 | ¥ 0.34 |
| ¶ MHO | ||||
| Gender | € < 0.001 | |||
| Male | 58 (20) | 142 (48.3) | 241 (74.8) | |
| Female | 232 (80) | 152 (51.7) | 81 (25.2) | |
| Age (y) | 41.73 ± 5.85 | 42.84 ± 7.23 | 42.99 ± 6.62 AB | ¥ 0.04 |
| Waist circumference (cm) | 94.81 ± 7.47 | 97.05 ± 8.21 | 98.62 ± 7.11 D | ¥ 0.002 |
| Triglyceride (mg/dL) | 95.15 ± 31.72 | 110.69 ± 41.62 | 134.66 ± 64.37 D | ¥ < 0.001 |
| Fasting blood sugar (mg/dL) | 81.89 ± 18.70 | 83.82 ± 11.52 | 86.02 ± 11.13 A | ¥ < 0.001 |
| High density lipoprotein (mg/dL) | 48.65 ± 11.11 | 46.02 ± 10.34 | 45.15 ± 9.96 AB | ¥ < 0.001 |
| Cholesterol (mg/dL) | 159.63 ± 33.45 | 166.58 ± 36.60 | 178.74 ± 37.47 D | ¥ < 0.001 |
| Systolic blood pressure (mm Hg) | 106.18 ± 12.71 | 109.65 ± 12.97 | 114.90 ± 14.21 D | ¥ < 0.001 |
| Diastolic blood pressure (mm Hg) | 73.78 ± 8.25 | 75.67 ± 8.78 | 78.43 ± 9.45 D | ¥ < 0.001 |
| ¶¶ MUHO | ||||
| Gender | € < 0.001 | |||
| Male | 5 (15.6) | 26 (37.7) | 84 (73.7) | |
| Female | 27 (84.4) | 43 (62.3) | 30 (26.3) | |
| Age (y) | 41.06 ± 5.82 | 44.90 ± 6.80 | 44.81 ± 6.61 AB | ¥ 0.01 |
| Waist circumference (cm) | 99.57 ± 5.61 | 100.81 ± 7.57 | 105.18 ± 8.12 A | ¥ 0.009 |
| Triglyceride (mg/dL) | 142.56 ± 57.20 | 165.40 ± 61.74 | 206.84 ± 93.17 A | ¥ 0.05 |
| Fasting blood sugar (mg/dL) | 84.31 ± 12.14 | 101.15 ± 39.57 | 106.79 ± 38.46 AB | ¥ < 0.001 |
| High density lipoprotein (mg/dL) | 40.78 ± 7.00 | 40.78 ± 8.59 | 39.71 ± 8.85 | ¥ 0.65 |
| Cholesterol (mg/dL) | 162.75 ± 38.58 | 174.55 ± 37.09 | 181.41 ± 39.59 A | ¥ < 0.001 |
| Systolic blood pressure (mm Hg) | 112.84 ± 14.20 | 117.71 ± 14.79 | 124.33 ± 13.68 A | ¥ < 0.001 |
| Diastolic blood pressure (mm Hg) | 78.37 ± 8.70 | 80.43 ± 8.97 | 84.08 ± 8.75 A | ¥ 0.001 |
Demographic, Anthropometric, and Biochemical Factors Regarding Gamma-glutamyl Transferase Tertile Stratified by Cardiometabolic Phenotype
4.2. Relationship Between Serum GGT and Cardiometabolic Phenotype
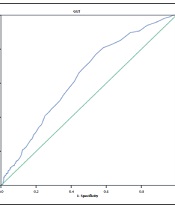
The findings of the unadjusted model indicated that compared to the lowest GGT tertile, the risks of MHO and MUHO in the highest GGT tertile increased by 2.84 (95% CI 2.01 - 4.01) and 9.12 (95% CI 5.54 - 15), respectively (Table 3). After adjustment for different intervening factors (ie, age, gender, level of education, marital status, smoking, and alcohol consumption), a strong positive correlation was observed between GGT with MHO and MUHO (Table 3). The relationship was more obvious in the third GGT tertile, especially for the MUHO individuals. In Model 3, the observed OR for MUHO was 3.53 (95% CI 2.11 - 5.90) in the second GGT tertile, while it was 14.29 (8.15 - 25.08) in the third GGT tertile (Table 3). The ROC analysis was performed to differentiate between MHO and MUHO. The cutoff value of 18.5 U/L for GGT allowed us to distinguish MHO from MUHO with a sensitivity of 72.6% and a specificity of 50.7%. GGT had accepdiagnostic diagnostic accuracy (AUC 0.634 [95%CI: 0.59 - 0.67]) (Figure 1).

Receiver-operating characteristics curve of gamma-glutamyl transferase for metabolically healthy obese and metabolically unhealthy obese Area under the curve 0.634. GGT, gamma-glutamyl transferase.
| GGT (UL/L), OR (95% CI) | |||
|---|---|---|---|
| Tertile1 ≤ 14 (n = 471) | Tertile 2 15-23 (n = 485) | Tertile 3 = ≥ 24 (n = 495) | |
| MUHL | Reference | 2.96 (0.74 - 11.70) | 1.70 (0.27 - 10.48) |
| MHO | Reference | 1.28 (0.96 - 1.72) | 2. 84 (2.01 - 4.01) |
| MUHO | Reference | 2.73 (1.68 - 4.44) | 9.12 (5.54 - 15.00) |
| MUHL | |||
| Model 1 | Reference | 3.63 (0.87 - 15.18) | 2.55 (0.36 - 17.82) |
| Model 2 | Reference | 3.61 (0.86 - 15.14) | 2.45 (0.35 - 17.20) |
| Model 3 | Reference | 2.87 (0.65 - 12.54) | 2.27 (0.32 - 16.06) |
| MHO | |||
| Model 1 | Reference | 1.55 (1.13 - 2.12) | 3.92 (2.66 - 5.79) |
| Model 2 | Reference | 1.56 (1.14 - 2.15) | 3.90 (2.63 - 5.78) |
| Model 3 | Reference | 1.54 (1.12 - 2.12) | 3.93 (2.65 - 5.83) |
| MUHO | |||
| Model 1 | Reference | 3.40 (2.04 - 5.66) | 13.85 (7.95 - 24.15) |
| Model 2 | Reference | 3.43 (2.06 - 5.71) | 13.78 (7.90 - 24.08) |
| Model 3 | Reference | 3.53 (2.11 - 5.90) | 14.29 (8.15 - 25.08) |
Odds Ratios and 95% Confidence Intervals for Cardiometabolic Phenotype According to Serum Gamma-glutamyl Transferase Tertiles a
The observed ROC curves for MHL and MUHL and relevant findings are not reported since they were not statistically significant.
5. Discussion
The main findings regarding the three cardiometabolic phenotype classes (ie, MHL, MHO, and MUHO) are as follows: The frequency of females decreased as a dose-dependent variable of the GGT tertile, indicating that the lowest frequency was observed in the third GGT tertile. In the MHL, MHO, and MUHO groups, there were significant changes in the mean WC, TG, cholesterol, FBS, DBP, SBP, and HDL levels with increasing GGT concentrations. The risk of MHO and MUHO increased according to the GGT tertile; the highest ORs were in the third GGT tertile. Such a significant correlation was more highlighted after adjusting for the intervening factors.
The present findings confirm those of a previous study, indicating a positive correlation between serum GGT and MetS after adjusting for demographics, BMI, alcohol consumption, and smoking status (17-22). Xu et al. noted that the risk of MetS increased in the highest GGT quartiles after adjusting for intervening factors (19). In another cross-sectional study, Lee et al. adjusted for age and drinking status and obtained comparable results in the highest GGT quartile (20). Although the results of these studies show that an elevated GGT level indicates an increased risk of MetS, other studies have documented the increased risk of MetS, even with a normal range of GGT (23, 24).
In most cases, the findings on the relationship between MetS and GGT levels were adjusted for BMI. Recent studies have reported a subset of overweight and obese individuals with normal metabolic profiles (25). According to some reports, metabolically-normal individuals with large body sizes and metabolically-normal individuals with normal weight may experience a similar risk of chronic diseases (26). In contrast, compared to MHNW (metabolically healthy normal weight), individuals about 24% of normal-weight American adults (BMI < 25.0 kg/m2) are considered metabolically abnormal (27), thereby placing them at a higher risk for chronic diseases generally associated with elevated BMI. Understanding the effects of body size on MetS risk can have implications for public health and clinical practice. To the best of the authors’ knowledge, no study, but one, has addressed the relationship between cardiometabolic phenotype and GGT levels. The concerned study was conducted with a small sample size (n = 140) and examined the correlation between GGT levels and MHO in at-risk obese individuals who were young nondiabetic obese women (28). Although some MHNW and obese participants have an increased risk of an unhealthy phenotype, others may have remarkably stable and desirable metabolic profiles, which can be a matter of concern (29).
According to what was mentioned, it is crucial to determine reliable biomarkers to distinguish healthy subjects at risk of transition to an unhealthy metabolic condition. GGT is an accessible blood marker, which can easily be measured and interpreted. In this regard, the present study examined the relationship between cardiometabolic phenotypes and GGT levels. Our findings showed the highest prevalence of MHO and MUHO in the third GGT tertile (highest level); however, some MHL individuals were also in the third GGT tertile, suggesting that these metabolically-healthy subjects may be at the risk of transitioning to a metabolically unhealthy condition. These findings are similar to those reported by Mankowska-Cyl et al., who declared that the elevated GGT was more prevalent in at-risk obese women than the MHO women (28). Another investigation delineated a relationship between the MUHO phenotype and both GGT and alanine transaminase (ALT), with GGT being suggested as a better predictor of MUHO risk (30). Furthermore, MetS components (WC, DBP, SBP, TG, FBS, and HDL) increased in the MHO, MUHO, and MHL groups in a dose dependent manner with an increase in the GGT tertiles. These findings imply that higher GGT levels may represent metabolic modifications and act as a clinical guide to differentiate cardiometabolic phenotype classes.
We believe that the strong relationship between GGT and MUHO can be attributed to the role of hepatic adipose in the MUHO pathogenesis. In this regard, individuals with the MUHO phenotype had the highest WC values. Hepatic adipose deposition results in adverse metabolic consequences such as insulin resistance and inflammation, with gradual subsequent fatty infiltration of other organs (31). Elevated liver enzyme levels may indicate this hepatic adipose deposition, and MUHO individuals may have higher insulin resistance. These factors somewhat explain the biological mechanisms of the MUHO phenotype.
In this study, the ROC curves were used to assess the ability of GGT to distinguish different cardiometabolic phenotype classes. Accordingly, a cutoff value of 18.5 U/L may indicate the transition of an MHO individual to the MUHO class. The detailed mechanism of this relationship is not well-clarified. However, in addition to the mechanisms mentioned earlier, an alternative explanation could be the oxidative stress induction property of serum GGT , being a known marker of oxidative stress (32, 33). Elevated serum GGT activity leads to the shift of extra glutathione into cells and glutathione metabolism, resulting in oxidative stress (19).
On the other hand, GGT contributes to drug detoxification, facilitates protein synthesis and transmembrane transportation, and inhibits oxidative stress by making cysteine available for intracellular glutathione regeneration (34). Cellular GGT can be augmented by iron during oxidative stress. In this regard, shifting the role of cellular GGT from an antioxidant to a pro-oxidant in the presence of a transition metal such as iron has been reported in experimental studies (35). The vital role of oxidative stress in the pathogenesis of MetS has been well-documented (20, 21). Moreover, GGT plays a pro-inflammatory role in mediating the interconversion of leukotriene (LT)-C4 into LT-D4, where LT-C4 is a glutathione-containing inflammatory mediator (36). Accordingly, a correlation between serum GGT and the increased risk of MetS in MUHL and MHO individuals can be found after studying the predefined and novel cardiovascular risk factors.
The main limitation of this study was that the causal inferences between serum GGT and cardiometabolic phenotypes could not be detected because of the study's cross-sectional nature. The small sample size of the MUHL participants was another limitation. On the other hand, the main strength of the present study was its unprecedented venture in examining the relationship between GGT and cardiometabolic phenotypes in healthcare workers. The advantage of serum GGT is in the availability of this marker in routine clinical practices and its standardized measurement methods. It can be helpful for the prompt and accurate identification of the MHO subjects who are at risk of transition to the MUHO phenotype, thereby facilitating better preventive strategies. The other strength of this study was of the acquisition of data from a highly large cohort population.
5.1. Conclusions
According to the findings, it can be concluded that the prevalence of the MHO and MUHO cardiometabolic phenotypes might rise with increasing the GGT levels. Moreover, a cutoff value was set for GGT to assess the MHO subjects at the risk of transition to the MUHO phenotype; hence, GGT may act as a biomarker to reflect MetS risk. Accordingly, GGT level can be used to detect at-risk MHO individuals and administer proper interventions.
