1. Background
The natural aquatic environment is a reservoir of enteric viruses. Viruses find their way into water resources through various human activities such as unimproved septic systems, sewer leakage, agriculture runoff, urban runoff, and wastewater discharge (1, 2). In many areas of the world, untreated wastewater is used to irrigate vegetables and crops (3, 4). However, Human Enteric Viruses (HEV) are commonly transferred to the biosphere through the fecal-oral route by direct human contact or via fomites (4, 5). Human enteric viruses have special characteristics causing illnesses even at a very low viral dose of < 20 particles (6, 7). Food and waterborne HEV, particularly human Hepatitis A Virus (HAV), contribute to a major global health burden among non-bacterial gastroenteritis and acute infectious hepatitis that may sometimes be fatal (8). These viruses replicate in the infected person’s gastrointestinal tract, excreted at high concentrations via the stool, and are transmitted directly or indirectly to other potential hosts (8, 9). The majority of HAV cases are reported in regions of the world with unsafe water, poor hygiene, overcrowding, and poor sanitary conditions (10-12). It is estimated that 90% of children in the developing world get infected with HAV before the age of 10 years (13). Also, around 114 million cases of HAV are reported each year, either symptomatic or asymptomatic (12, 13). According to a study in Pakistan, poor water quality resulted in 40% of deaths and 30% of diseases due to HAV and other waterborne diseases (14). Such disease outbreaks can be crucial and have substantial social, economic, and health consequences for the public. It may take months for people to recover from illnesses and return to routine life or school and resume to work. In Pakistan, poor water, sanitation, and hygiene (WASH) services are a major barrier to tackling HEV diseases, mainly HAV disease (14-16).
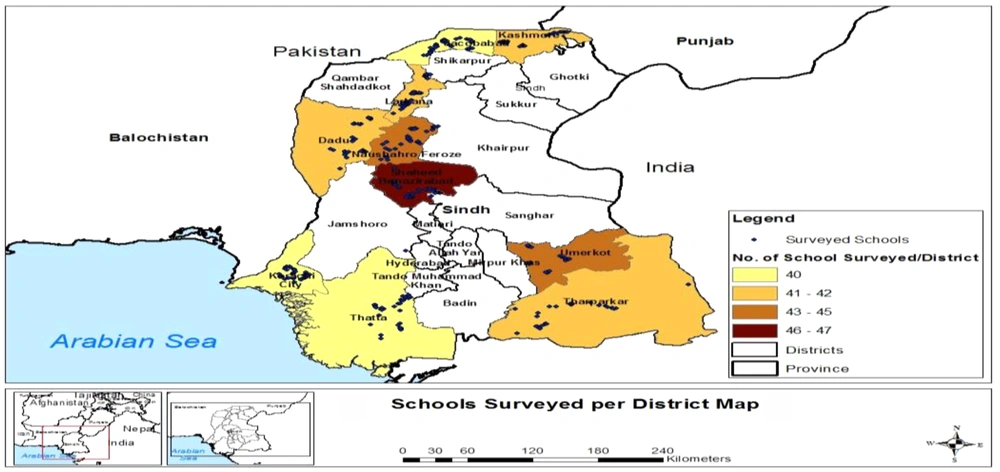
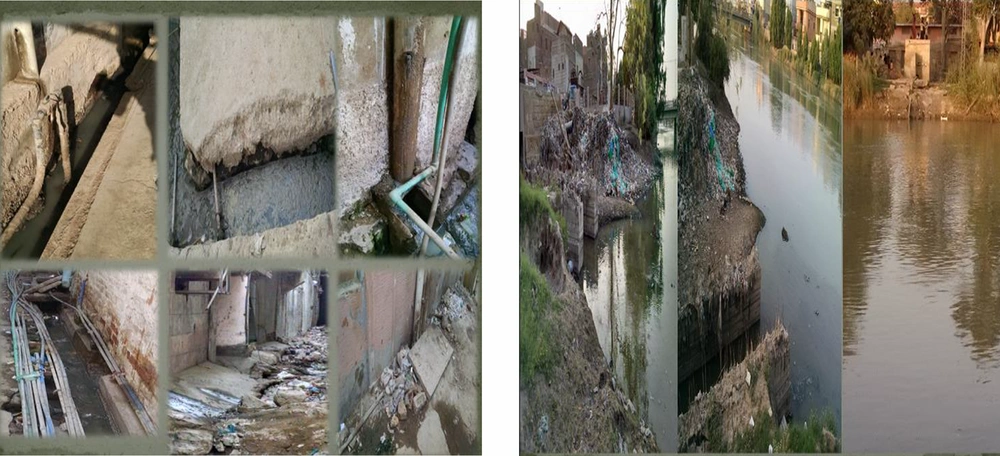
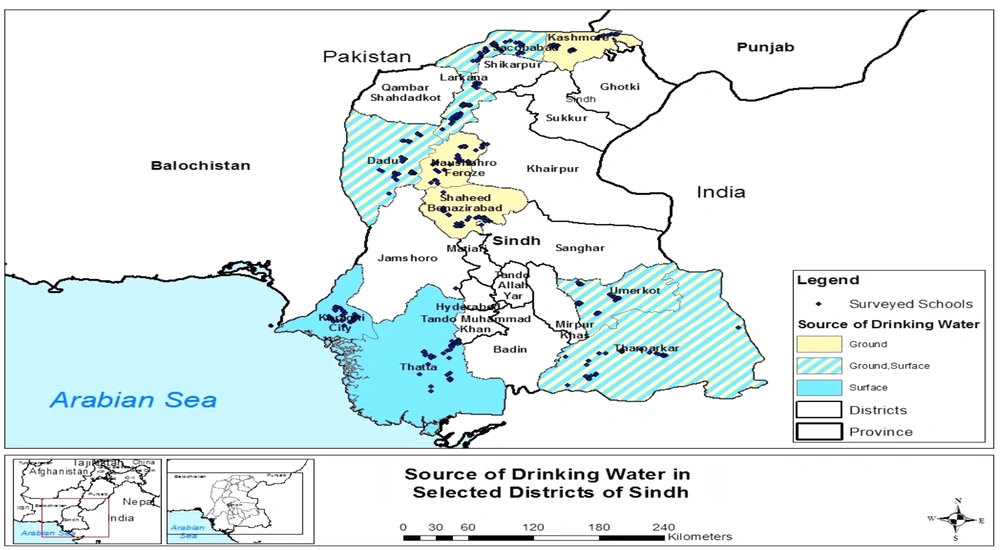
Pakistan is administratively divided into four provinces. The Sindh province is the second largest province with a population of around 4.8 million (17) located in the southeast of the country. Sindh has three climatic regions: north, south, and center. Each region is subdivided into districts, and there are 29 districts in Sindh (Figure 1). Sindh has enough resources of groundwater and surface water (14). However, the main source for drinking is groundwater in Central Sindh, groundwater and surface water in North Sindh, and surface water in South Sindh. These water resources are contaminated with fecal coliform and other pathogens. This is due to the disposal of untreated sewage and other industrial effluents in natural water bodies as shown in Figure 2. Moreover, if microbial contaminants are not present in water resource, water may became contaminated during storage in overhead tanks. It has already been established that water stored for drinking has higher microbial contamination than water directly obtained from resources (18). The majority of the primary schools of Sindh have limited or no improved drinking water supply and use poor sanitation facilities (19).
There has been less attention to WASH in schools as compared to household settings while children spend much of their time at schools. Besides, the intense levels of person-to-person contact expose children to many pathogens, including HAV due to poor hygiene and sanitary conditions. The under-nutrition and poor immunity go together to heighten the risk of HAV disease (20). More importantly, morbidities related to enteric viruses can negatively affect the performance of school children directly or indirectly. Hence, this population is under serious health threats due to HAV infection. A literature review did not reveal any data on the prevalence of HAV in primary schools of Pakistan (14, 16, 21). Therefore, the objective of the current study was to estimate the waterborne risk of HAV disease in primary school children using Quantitative Microbial Risk Assessment (QMRA).
Quantitative microbial risk assessment is a scientific model to measure risks such as the probability of an adverse effect including illness, infection, and/or death (mortality) due to exposure to a pathogen (22-24). The QMRA model starts with determining the concentration of the pathogen (HAV) in the environment (water) as input to calculate the associated risk as output. Studies have estimated the risk of various infections based on exposure to various doses of fecal coliforms as an indicator pathogen (22, 23). Various studies used the indicator-to-pathogen ratio such as the ratios of E. coli to Rotavirus and E. coli to Campylobacter. Similarly, we used the ratio of fecal coliform to HAV in this study (25). Moreover, some researchers detected the HAV load in different water sources such as well or river using total or fecal coliforms as indicator organisms (25-28).
2. Methods
2.1. Sample Selection
We found 42,900 primary schools registered with the Education Department of Sindh as the study population (26, 27). OpenEpi statistical software (29) was used to estimate the sample size based on the prevalence of HAV endemicity (90%) in almost similar settings (30), which resulted in a sample size of 425 primary schools. The sample size was estimated using the following formula:
Then, a multistage random sampling method was used to select 10 districts, followed by the random selection of primary schools from each district in proportion to the size of the population (Figure 1). Sindh is located in the subtropical region with overall cold winter (9 - 30ºC) and hot dry summer. Summer temperatures remain higher in North Sindh (45 - 50ºC) than in Central Sindh (43 - 44ºC) and South Sindh (35 - 38ºC). South Sindh is humid and windy whereas North and South regions are dry in climate. The rainfall is mainly observed from July to August during monsoon (16, 31).
2.2. Microbial Analysis of Drinking Water Samples
Standard microbial analyses were performed to determine total coliform and fecal coliform using the membrane filtration method, EMB, and MFC agars of Oxoid were used based on APHA 9222D (14). For this purpose, 1,500 mL drinking water samples were collected from the randomly selected points of use in primary schools of each district in sterilized bottles, representing the drinking water quality of the entire district. The samples were kept in an icebox and transported to a microbiology laboratory. Then, 100 mL of water sample was filtered through 0.45 µ filter papers using a filtration assembly separately for each microbial test, followed by incubation of filter papers on selective media agar plates at 45ºC for fecal coliform and 37ºC for total coliform bacteria for 22 - 24 hours. All samples were analyzed in replicates and the average results were recorded in CFU/100 mL (32).
2.3. Indicator Organism Strategy
An intensive literature review was carried out to find the ratio of HAV to fecal coliform (Table 1). Most researchers documented the concentration of HAV as 10-1 to 10-5 against one fecal coliform depending on methodology. This kind of data is very useful in resource-poor settings to consider a conversion ratio from the indicator pathogen to the pathogen with unknown concentration. Thus, keeping in view the available data, in the present study, HAV was measured by multiplying 10-5 by the concentration of indicator pathogen to estimate the concentration of HAV in drinking water, as done in numerous investigations (25-27). Hence, initially, fecal coliform bacteria were identified in drinking water samples from 10 districts of Sindh, Pakistan, followed by determining the concentration of HAV in water samples by multiplying the average concentration of fecal coliform bacteria by the HAV assumed ratio 10-5 to calculate the concentration of HAV (32). The QMRA tool was used to estimate the risk factor (1:10,000), the annual risk of infection, and the acceptable level of risk described by the U.S. Environmental Protection Agency (USEPA) for drinking water (33). We used fecal coliform as an indicator organism to predict HAV in water sources (25, 27).
| No. | Concentration of HAV | Source water | Detection | References |
|---|---|---|---|---|
| 1 | Fecal coliform to HAV 1:10-5 | Wastewater reuse for agriculture | Virus to HAV ratio | (27) |
| 2 | Relation of HAV from Salmonellae to HAV10-5 | Water for irrigating fresh produce | Using Salmonellae as an indicator organism | (28) |
| 3 | Fecal coliform to HAV 1:10-5 | Reused wastewater; Pi = 1-exp (-1/k)(d); K = 1.8229 | Using fecal coliform as an indicator organism | (26) |
| 4 | Fecal coliform to HAV 1:10-5 | Drinking water source | Assuming ratio for quantifying reference pathogen concentration | (25) |
2.4. Risk Determination
An exponential dose-response model was used to calculate the probability of infection per day due to exposure to HAV through drinking water in primary schools of Sindh.
Pi = Probability of infection per day
K = 1.8229
Doses were calculated using basic equation D = C*V
C = Concentration;
V = Volume ingested (for children, one liter/day)
The probability of infection per year was calculated using following equation (26, 28):
2.5. Morbidity and Mortality Calculation
The clinical illness of HAV was determined by multiplying the daily risks of infection by 0.5, while the probability of mortality was determined by multiplying the probability of illness by 0.01% for the population (32). The HAV mortality rates can vary from 0.5% to 1.5% depending on the age, immune system status, and socioeconomic status.
3. Results
The present investigation estimated the health risks of coliform-contaminated drinking water accompanying HAV in primary schools of Sindh. As the data regarding the burden of HAV infection in Pakistan were insufficient, an indicator pathogen-based QMRA strategy was applied to determine the risks associated with exposure to HAV. In this regard, the probabilities of HAV infection, illness, and mortality were calculated for 425 primary schools with 5 - 12-year-old children in 10 different districts of Sindh, Pakistan, who were consuming untreated/sewerage-contaminated drinking water. The risk was determined on the day-to-day, yearly, and lifetime bases. To the best of our knowledge, no such study has been conducted in primary school settings where the target population (children) spent considerable time in this risky environment.
3.1. Fecal Contamination in Drinking Water Sources in Primary Schools
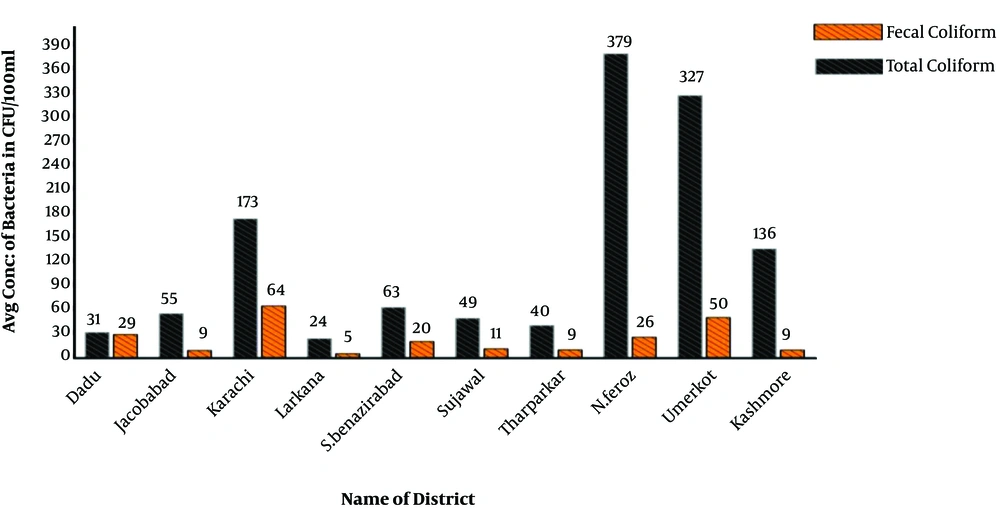
The collected drinking water samples were analyzed for microbial contamination. The results revealed that the drinking water of primary schools was highly contaminated with total and fecal coliforms (Tables 2 and 3). On average, total coliform as high as 378.79 CFU and fecal coliform as high as 50 CFU were detected in 100 ml of drinking water. The total coliform contamination was found highest in order of Nousheroferoz > Umerkot > Karachi > Kashmore (Table 2) whereas the fecal contamination was highest in order of Karachi > Umerkot > Dadu > Noushroferoz (Table 3). In this study, 40 to 50 schools per district were sampled randomly. The results of sample analysis exhibited huge differences in the status of contamination, even within a district, possibly due to variations in water supply sources (Figure 3) and storage conditions. Based on the observed differences in the contamination pattern, some water samples were found to have even no fecal coliforms, minimally. These were schools using point-of-use filter systems to protect their students’ health. Furthermore, N. Feroz (5), Karachi (10), Umerkot (11), and Kashmore (12) showed the lowest levels of total coliform.
| No. | Districts | Sample Size | Total Coliform (CFU/100 mL) | |||
|---|---|---|---|---|---|---|
| Average | Max | Min | SD | |||
| 1 | Dadu | 42 | 31.5 | 300 | 0 | 60.59 |
| 2 | Jacobaabd | 40 | 54.95 | 450 | 0 | 88.41 |
| 3 | Karachi | 40 | 173.12 | 736 | 10 | 194.48 |
| 4 | Larkana | 42 | 23.81 | 300 | 0 | 50.37 |
| 5 | S.Benazirabad | 47 | 62.68 | 500 | 0 | 88.628 |
| 6 | Sujawal | 40 | 48.95 | 300 | 0 | 69.11 |
| 7 | Tharparkar | 42 | 40.12 | 302 | 0 | 55.52 |
| 8 | N.Feroz | 45 | 378.97 | 3219 | 5 | 522.64 |
| 9 | Umerkot | 45 | 326.93 | 2800 | 11 | 438.10 |
| 10 | Kashmore | 42 | 135.64 | 427 | 12 | 107.09 |
| No. | Districts | Sample Size | Fecal Coliform (CFU/100 mL) | |||
|---|---|---|---|---|---|---|
| Average | Max | Min | SD | |||
| 1 | Dadu | 42 | 28.88 | 600 | 0 | 101.89 |
| 2 | Jacobaabd | 40 | 9.08 | 200 | 0 | 31.83 |
| 3 | Karachi | 40 | 64.6 | 400 | 0 | 107.58 |
| 4 | Larkana | 42 | 4.90 | 169 | 0 | 26.04 |
| 5 | S.Benazirabad | 47 | 20.17 | 200 | 0 | 37.41 |
| 6 | Sujawal | 40 | 11.15 | 73 | 0 | 15.17 |
| 7 | Tharparkar | 42 | 9.83 | 200 | 0 | 31.95 |
| 8 | N.Feroz | 45 | 25.69 | 93 | 0 | 22.77 |
| 9 | Umerkot | 45 | 50.18 | 600 | 0 | 88.68 |
| 10 | Kashmore | 42 | 9.47 | 47 | 0 | 13.06 |
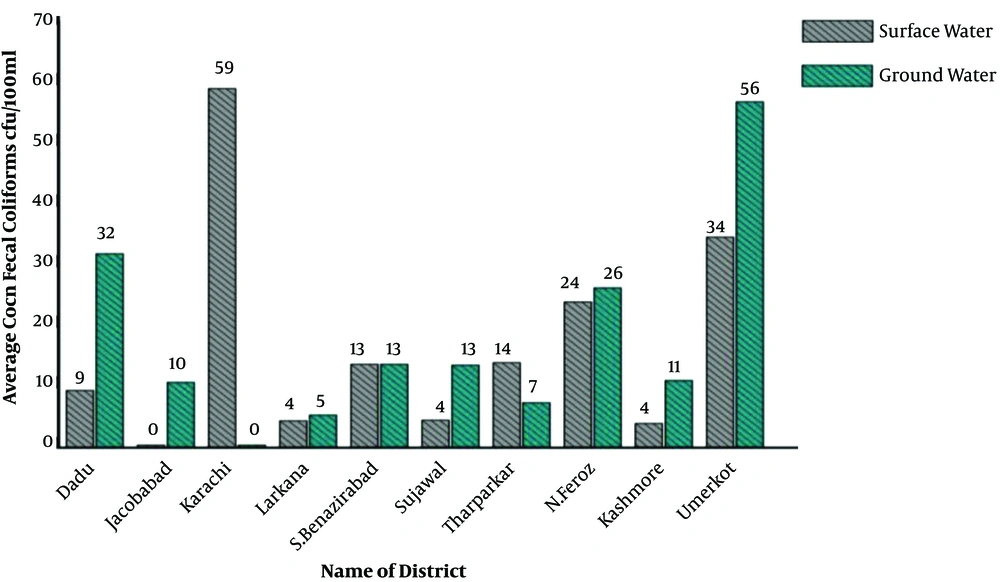
Overall, the average concentration of total coliform remained higher than that of fecal coliform. The highest drinking water contamination by total coliform was found in N. Feroz (379 CFU/100 mL) whereas Karachi located in the south region was more vulnerable to fecal coliform contamination (65 CFU/100 mL), as shown in Figure 4.
Focusing on the drinking water analysis of the city of Karachi (Figure 3) as the largest city of Pakistan, the city had the highest numbers of fecal coliforms and E. coli while its E. coli concentration was comparable to that of N. Feroz. The lowest fecal coliforms were found in Larkana; however, its concentration of E. coli was higher than fecal coliform concentration. The concentration of E. coli was found lowest at schools of Kashmore.
3.2. HAV Health Risks to Primary School Children
Table 4 represents the projected day-to-day and yearly risks of HAV infection and mortality. According to the results, children of all 10 districts, evaluated in the present study, were at a high risk of HAV infection. For districts Karachi and Umerkot, the situation was worst. The daily risks of HAV infection for school children of these two cites were calculated as 35 and 27 per 10,000 school children, respectively, with an annual risk of 66% and 56% respectively. The daily risks of HAV infection were estimated per 10,000 school children for Larkana (3.0), Jacobabad (5.0), Kashmore (5.0), Tharparkar (5.0), Sujawal (6.0), S. Benazirabad (11.0), N. Feroz (140), and Dadu (16). The annual risks were also calculated per 10,000 children for Larkana (775), Jacobabad (1387), Kashmore (1447), Tharparkar (1494), Sujawal (1676), S. Benazirabad (2824), N. Feroz (3447), and Dadu (3783). However, the probability of clinical illness ranged from 174 to 1,472 per 10,000 children, as shown in Table 4.
| District | Average Dose HAV/Day | Pinf/Day (Probability of Infection Per Day) | Pinf Annual (Annual Probability of Infection) | Prob of Mortality | Prob of Clinical Illness |
|---|---|---|---|---|---|
| Dadu | 28.88095 × 10⁻⁴ | 15.718 × 10⁻⁴ | 37.83 × 10⁻² | 17.02 × 10⁻⁴ | 85.118 × 10⁻³ |
| Jacobabad | 90.75 × 10⁻⁵ | 49.659 × 10⁻⁵ | 13.87 × 10⁻² | 62.421 × 10⁻⁵ | 31.215 × 10⁻³ |
| Karachi | 64.6 × 10⁻⁴ | 35.318 × 10⁻⁴ | 65.46 × 10⁻² | 29.455 × 10⁻⁴ | 14.729 × 10⁻² |
| Larkana | 49.0476 × 10⁻⁵ | 26.98 × 10⁻⁵ | 77.55 × 10⁻³ | 34.896 × 10⁻⁵ | 17.4487 × 10⁻³ |
| S.Benazirabad | 20.1667 × 10⁻⁴ | 11.012 × 10⁻⁴ | 28.24 × 10⁻² | 12.709 × 10⁻⁴ | 63.547 × 10⁻³ |
| Sujawal | 11.15 × 10⁻⁴ | 61.149 × 10⁻⁵ | 16.76 × 10⁻² | 75.44 × 10⁻⁵ | 37.721 × 10⁻³ |
| Tharparkar | 98.333 × 10⁻⁵ | 53.7981 × 10⁻⁵ | 14.94 × 10⁻² | 67.230 × 10⁻⁵ | 33.618 × 10⁻³ |
| N. Feroz | 25.6889 × 10⁻⁴ | 13.9935 × 10⁻⁴ | 34.47 × 10⁻² | 15.513 × 10⁻⁴ | 77.571 × 10⁻³ |
| Umerkot | 50.17778 × 10⁻⁴ | 27.451 × 10⁻⁴ | 56.21 × 10⁻² | 25.295 × 10⁻⁴ | 12.627 × 10⁻² |
| Kashmore | 94.762 × 10⁻⁵ | 51.8493 × 10⁻⁵ | 14.47 × 10⁻² | 64.9801 × 10⁻⁵ | 32.490 × 10⁻³ |
The annual probability of HAV diseases was found the highest among primary school children of Dadu, Karachi, and Umerkot. The mortality risk due to HAV per 10,000 children ranged from 4 to 29 deaths per year (Table 4).
The bacterial concentration among different districts by the source of water is shown in Figure 4. Overall, the average fecal coliform was 173 CFU/100 mL and 165 CFU/100 mL in groundwater and surface water resources, respectively. Also, there was a variation in the average number of fecal coliforms by each district. Karachi (South Sindh) showed the maximum average of fecal coliform (59 CFU/100 mL) in surface water and Umerkot district (South Sindh) showed the highest average of fecal coliform (56 CFU/100 mL) in ground water (Figure 4).
Pearson correlation was used to assess the relationship between the rate of HAV infection and the associated mortality. The rate of infection per year showed a strong, positive correlation (P < 0.01) with the associated mortality. Besides, the mortality per year showed a strong, positive correlation (P < 0.01) with the rate of illness.
4. Discussion
Developing countries like Pakistan pose high risks of orofecal pathogen transmission due to poor WASH facilities (31). Hepatitis A virus is transmitted primarily by the fecal-oral route when an uninfected person consumes contaminated or untreated water (2, 34, 35). In primary schools, waterborne diseases are also spread due to poor hygiene, lack of standard sanitation facilities, and supply of inadequately treated or sewage-contaminated water.
The findings of the present study showed that overall, total coliform remained higher than fecal coliform. The highest drinking water contamination by total coliform was found in N. Feroz district (379 CFU/100 mL) whereas Karachi located in the south region was more contaminated with fecal coliform (65 CFU/100 mL). There was a lot of variation in the bacterial concentration even within a district, possibly due to variations in water supply, storage conditions, drainage systems, seasonality, and hygienic conditions (14, 36). The quality of drinking water is determined by the quality of water resource, treatment level and efficiency, and the condition of water supply lines. In Sindh, most areas where the fresh water resource is not available and groundwater is saline, people have no choice but to consume the available source of water (14). The drinking water distribution in urban schools is exposed to microbial contamination mainly due to the mixing of sewers with water supply lines. In most rural areas, no pretreatment facilities are available for water filtration (36). Schools in central and north Sindh, which mainly depend on groundwater, have hand pumps and wells to withdraw water that is not safe from surface runoff and flooding (37). The southern part of Sindh adjoins the sea coast where drinking water quality deteriorates due to dumping urban and industrial waste while it has limited freshwater resources (36, 38).
Public or private primary schools (with students aged 5 - 12 years) included in this study were part of middle to lower socioeconomic communities that were using untreated/contaminated water for drinking purposes and were at a higher risk of HAV infection. Similarly, in a hospital setting, 60% of the viral hepatitis cases were detected in > 15 years’ age group in Pakistan (39, 40). According to the World Health Organization (12), the prevalence of HAV infection is more in children under 15 years of age than in the adult population due to weak immunity and unhygienic practices. Another hospital-based study in Sindh, Pakistan, revealed that the seroprevalence of HAV was 60%, mainly among children below 10 years with a history of poor sanitary conditions at household (38). The majority of previous studies were done in hospital settings and a few of them were in community settings (30, 41, 42).
The province of Sindh also has very poor school performance indicators such as dropout, absenteeism, and enrollment. Additionally, government statistics report poor WASH facilities in schools (19). Studies in low-income countries show a significant association between availability of WASH facilities and school performance (41, 42). The risk of HAV infection is linked with unsafe water, poor sanitation, and poor hygienic practices (10, 38). In primary schools of Sindh, there is an intensive level of person-to-person contact. This overcrowding reflects poor hygiene and lifestyle, resulting in a high risk of HAV transmission (15). Additionally, a safe and effective vaccine to prevent HAV is yet to be included in the routine mass immunization programs of Pakistan.
According to Haas et al. (24), QMRA can use the data of indicator organisms when there are limited data on the occurrence of pathogens; nonetheless, the use of indicator organisms in QMRA is a weak application. The presence of bacteria such as fecal coliforms in drinking water resource and reused wastewater may be the main predictor of the occurrence of HAV in drinking water and reclaimed water for irrigation (25, 27). In a study from the USA, a microbial risk assessment tool was used to predict HAV based on Salmonella as an indicator pathogen (28). Another study from Israel predicted the HAV load using fecal coliform as an indicator pathogen in drinking water resources (26).
According to the USEPA, the acceptable limit for waterborne infections for drinking water is only one infection per 10,000 users each year (33). The present study revealed that the condition of all primary schools in the evaluated districts of Sindh is alarming. The annual risk of HAV infection in the selected districts ranged between 3.0 and 6,547 children per 10,000 school-going children, which is far from one infection per year (33). This obviously has substantial social, economic, and health consequences for families and the country. However, HAV risks are lower for children over 15 years of age but the situation is shocking for young children who are immuno-compromised. Moreover, the number of fecal coliforms in school’s drinking water supplies exceeded the acceptable levels for drinking water. There should zero counts per 100 ml of drinking water (25, 31).
Various studies have determined that the drinking water situation of Karachi city is very critical due to bacterial contaminations (39, 43). In agreement with this observation, we found that children of primary schools of Karachi are at a severe risk of HAV. The highest daily fecal contamination and load of E. coli were detected in Karachi. Moreover, 35.0 children per 10,000 were daily at risk of HAV infection, with a 66% annual risk. This city has very old sewers intermingled with the water supply system, resulting in a very high fecal contamination of drinking water. After Karachi, Neushero Feroz (33 per 10,000 schoolchildren) and Umerkot (27 per 10,000 schoolchildren) had critical situations due to HAV-related health risks. Drinking water quality deterioration is also prevalent in the remaining districts as described in this study. Thus, it is no wonder that acute HAV diseases are endemic in Pakistan, as 90% of children get infected with HAV before reaching 10 years of age mainly due to unimproved water quality, sanitation, and poor hygienic practices (31, 39). Furthermore, HAV vaccination is not part of routine children immunization schedules currently pertinent in Pakistan (19).
The yearly possibility of mortality due to HAV was also quite high (Table 4), ranging from 4 to 29 per 10,000 children per year. However, children are using contaminated water every day; hence, it will develop immunity at young age. Nonetheless, the estimated risk of annual mortality due to HAV is consequently noteworthy for immuno-compromised young children who drink one to 1.5 liters of untreated/fecal-contaminated water daily. The collected drinking water samples were tested for fecal coliform, total coliform (Figure 5). In different districts, E. coli (CFU per 100 mL) was detected far more than the drinking water guidelines of WHO or Pakistan standards (25). Thus, water sources in schools were found to be inconsistent with the WHO or Pakistani guidelines (25, 44).
Accurate risk assessment for infections in school settings need more defined data related to the rates of HAV prevalence, accurate viral concentration in water supply/resources, the competence of recovery, and contagious dose. The extension of this study will comprise numerous inputs for parameters described above to record an adequate risk of HAV infection in school settings. Additionally, other human enteric viruses such as Hepatitis E virus, Rotavirus, Adenovirus, etc. can also be assessed in drinking water as pathogens by using risk assessment models. In Pakistan, HAV infection is endemic; hence, for accurate risk analysis, we require to consider many confounders. The most important confounders include the isolation and detection of HAV using available laboratory techniques; such practical limitations may affect the virus concentration and modeling calculations. There is no universal risk assessment model (25); nonetheless, adopted models should be modified according to pathogen, socio-cultural, and economic status of locals (11). In this investigation, the morbidity risk of HAV in primary school settings was determined by the ratio of indicator organisms to the pathogen; thus, these results are not universal and they only imitate the potential risk of HAV infection in children of primary schools of Sindh, Pakistan. Besides, the model is articulated on overestimates due to uncertainties; yet, the calculated risk of HAV infection could be underrated.
4.1. Conclusion
The present study estimated, for the first time, the risk of a major enterovirus, i.e. HAV, directing the attention to the burden of the disease and its potential negative impacts on school performance (absenteeism, dropout, illness, etc.) of primary school children of Sindh. Sustainable Development Goal 6 (SDG-6) considers water, sanitation, and hygiene as interlinked resources; hence, each resource has its direct or indirect impact on others. Therefore, on the one hand, there is a dire need to heavily invest on comprehensive WASH facilities to halt the transmission of HAV by ensuring the provision of safe drinking water supply in school settings. On the other hand, the government needs to establish a central registry and surveillance system for hepatitis cases and the inclusion of HAV vaccine in the government routine immunization programs to reduce the burden of HAV in the future.

