1. Background
Esophageal cancer (EC) ranks eighth among all common cancers and sixth among all cancers-related mortality worldwide (1). This form of cancer is common in developed regions of the world, Asia and Latin America and also in Asian countries like China, Japan, Republic of Russia, Iran and India has a high prevalence rate (2). Despite advances in the treatment of EC in the world in recent decades, the 5-year survival rate is less than 20% (3-5).
There are many risk factors for EC. The results of several epidemiological studies have shown that hot liquid, alcohol and tobacco are the common risk factors for EC (6-8). Geographical distribution has an important role for incidence of EC (9, 10). Nearly 80% of all cases of cancer occur in developing countries (9, 10). Another important risk factor is lifestyle. Studies have shown that people with low socioeconomic level due to excessive consumption of alcohol, smoking and poor nutrition are at higher risk of developing the disease (11). Human development index (HDI) is one of the known indexes which are in relation to some cancers (12, 13). According to various studies, there is a relationship between HDI and distribution of various types of cancer (3, 12).
The HDI is a composite statistic of three components, including life expectancy at birth, gross national income and the average years of schooling. The index has a number between zero and one (2). The distribution of the HDI is not the same in different parts of the world. Regions with very high HDI, which are one-sixth of the world’s population endure nearly half of cancer patients, whereas more than a third of the cancer incidence rates occur in regions with medium and low HDI with 3.4 billion people (11).
This study aimed to determine the global inequality in the incidence and mortality rates of EC and detecting of positive contributions in inequality by decomposition method. The results of our study could find additional information on epidemiology and inequalities related to EC to use for planning and further researches.
2. Methods
The present ecological study used dataset regarding the incidence and mortality rates of esophagus cancer and some related health factors in the world. The rates of incidence and mortality about EC was obtained from the global cancer project for 172 countries in year 2012 (1). The age-specific EC incidence and EC mortality rate was calculated by dividing the number of EC incidence and EC mortality number for each country by the corresponding population in that country and then multiplying by 100,000. Data about the HDI 2013 and its gradient including life expectancy at birth, mean years of schooling, and gross national income (GNI) per capita and also other health related variables were obtained from the World Bank database for 169 countries (2). No ethical approval was required for this study.
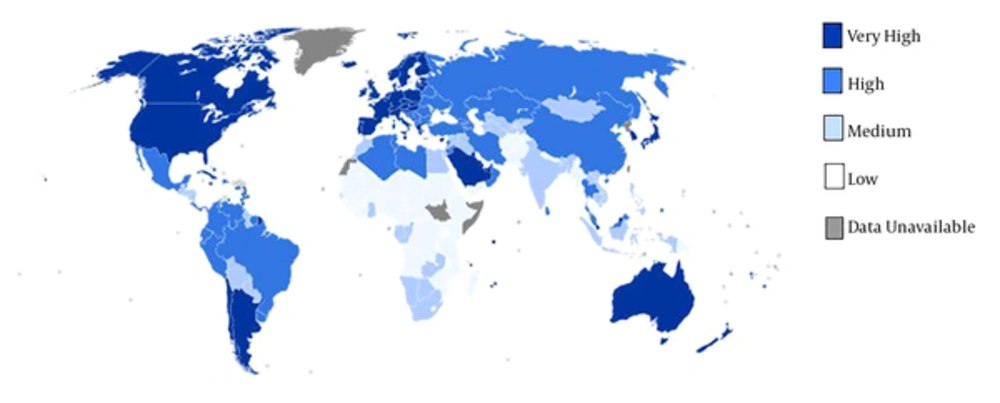
The epidemiological information from the GLOBOCAN database and the HDI were available for 169 countries. These countries categorized into four categories including 1, very high human development (27 countries); 2, high human development (37 countries); 3, medium human development (89 countries) and 4, low human development (16 countries) (Figure 1). We defined inequality in the age-specific incidence and mortality rates of esophagus cancer according to the HDI by using concentration index (CI). CI is calculated based on the concentration curve (CC) which plots the cumulative percentage of EC incidence and EC mortality (y-axis) against the cumulative percentage of the population ranked by HDI (x-axis) beginning with the low HDI (left) and ending with the very high HDI (right). The CI is defined as twice the area between the CC and line of equality (diagonal). When CC tangent with the diagonal, the CI is equal to zero usually indicating no inequality in mortality and incidence from EC; when CC lies above (below) the diagonal the CI is negative (positive) indicating the outcome is more concentrated among country whit lower (higher) HDI. CI was decomposed to detect of main contributors in ES inequality. The decomposing process divided to subsequent steps. At the first step, the amount of changes by any contributor in inequality was calculated by βkXk/μ. In this formula X = x1, x2… xk and µ is the mean score of ES. In second, elasticity multiplying to CI of each contributor and absolute contribution to inequality was estimated by (βkXk/µ)Ck where Ck are the CIs for contributors. In the final step absolute contribution divided to CI of each contributors and percentage contribution of each source was determined by (βkXk/μ)Ck /C (14). Linear regression models were also used for assessment of the HDI effect and other variables on EC incidence and EC mortality. The Stata command including; igini, clorenz and rbdineq was used to calculating of CI, CC and decomposition, respectively. All of analysis has done by Stata software version 12 (StataCorp, College Station, TX, USA). Data were analyzed at 0.05% significance level.
3. Results
In 2012, there were an estimated number of 456,000 new cases and 400,000 deaths from EC worldwide. About 80% of the new cases occurred in less developed countries. Negative value of concentration index in Table 1 and also results from Figure 2 for incidence (-0.23) and mortality (-0.25) rates of EC indicated that the rates of cancer is more concentrated in low HDI countries.
| Cancer Type | New Cases Diagnosed in 2012 (1,000s) | Death from EC in 2012 (1,000s) | Incidence Concentration Index (95%CI) | Mortality Concentration Index (95%CI) |
|---|---|---|---|---|
| Esophagus | 456 | 400 | -0.23 (-0.33, -0.13) | -0.25(-0.36, -0.15) |
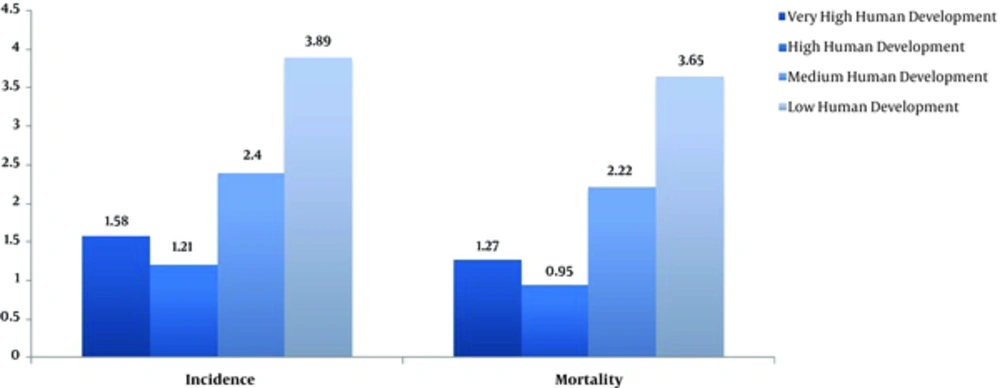
Base on linear regression model, a significant relationship was found between HDI and both incidence and mortality rates of EC. In other words, increasing of HDI had a negative effect on the incidence (B = -5.8, P < 0.001) and also negative effect on the mortality (B = -5.9, P < 0.001). The mean of life expectancy at birth, mean years of schooling, GNI per capita, percent of urbanization, and age standardized obesity had also a negative effect on increasing in the incidence and mortality rates of EC (Table 2). Incidence and mortality rates of esophagus cancer based on different HDI regions in 2012 was shown in Figure 3, results showed that low human development region (16 countries) had a highest esophageal rates compared to other categories.
| Variable | Esophagus Cancer Incidence | Esophagus Cancer Mortality | ||||
|---|---|---|---|---|---|---|
| β | CI | P Value | β | CI | P Value | |
| Life expectancy at birth | -0.13 | (-0.18, -0.07) | < 0.001 | -0.13 | (-0.18, -0.08) | < 0.001 |
| Mean years of schooling | -0.19 | (-0.35, -0.32) | 0.019 | -0.2 | (-0.35, -0.06) | 0.007 |
| Gross national income per 1000 capita | -0.037 | (-0.006, -0.012) | 0.009 | -0.037 | (-0.006, -0.012) | 0.005 |
| HDI | -5.8 | (-8.8, -2.7) | < 0.001 | -5.9 | (-8.7, -3.1) | < 0.001 |
| Urbanization level (%) | -0.05 | (-0.07, -0.03) | < 0.001 | -0.05 | (-0.07, -0.03) | < 0.001 |
| Age standardized obesity in adults | -0.09 | (-0.14, -0.05) | < 0.001 | -0.09 | (-0.13, -0.05) | < 0.001 |
Abbreviations: B, Coefficient; CI, Confidence Interval; HDI, Human Development Index.
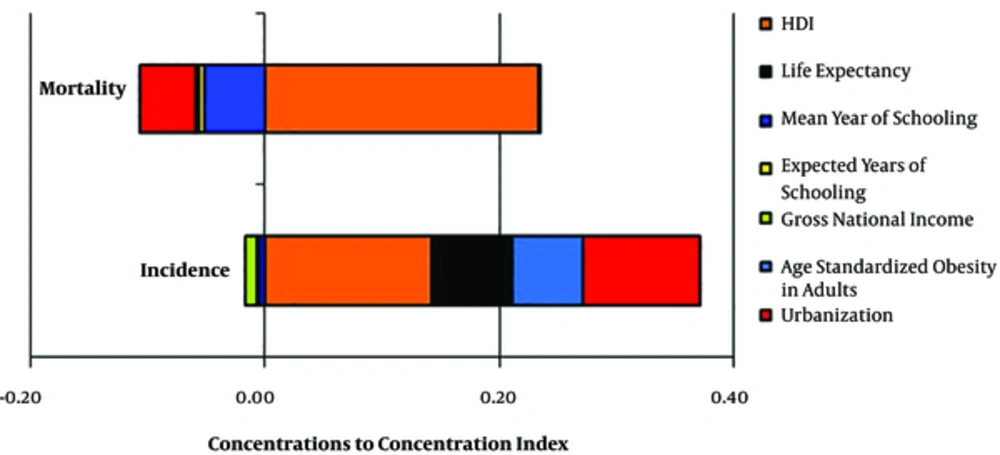
As shown in Figure 4 and Table 3, the important contributor in inequality for incidence rates of EC were HDI (0.14), urbanization (0.10), life expectancy (0.06), and age standardized obesity in adults (0.06) and absolute contributions in inequality of mortality rates of EC were HDI (0.15), urbanization (0.11), life expectancy (0.07), and age standardized obesity in adults (0.05). These results showed that HDI had a strong positive contributor in both incidence and mortality rate of EC.
| Variables | Incidence of Esophagus Cancer | Mortality of Esophagus Cancer | ||||
|---|---|---|---|---|---|---|
| Elasticity | Concentration Index | Absolute Contributions | Elasticity | concentration Index | Absolute Contributions | |
| HDI | -3.06 | -0.014 | 0.14 | -3.13 | -0.021 | 0.15 |
| Life expectancy | -2.05 | -0.013 | 0.06 | -2.22 | -0.016 | 0.07 |
| Mean year of schooling | 1.04 | -0.019 | -0.00 | 0.99 | -0.030 | -0.00 |
| Expected years of schooling | 2.31 | -0.006 | -0.00 | 2.34 | -0.011 | -0.00 |
| Gross national income | 0.18 | 0.003 | -0.00 | 0.19 | 0.022 | -0.01 |
| Age standardized obesity in adults | -0.40 | -0.078 | 0.06 | -0.35 | -0.077 | 0.05 |
| Urbanization level, % | -0.90 | -0.042 | 0.10 | -1.01 | -0.057 | 0.11 |
| Residual | 0.23 | 0.22 | ||||
| Total | 0.59 | 0.60 | ||||
Abbreviations: HDI, Human Development Index.
aElasticity, Elasticity shows how much change in the dependent variable is associated with one unit of change in the explanatory variable.
4. Discussion
Our findings showed that the incidence of EC and its mortality rate are significantly concentrated in the regions with low and very low HDI. Based on the results of this study, there was a significant negative correlation between the HDI and incidence and mortality rates of EC.
So that an increase in this index, incidence and mortality rate of EC were significantly decreased. This significant negative relationship is also true for each of the main components of HDI and ancillary indexes including level of urbanization and age-standardized obesity in adults. Also HDI was the strong contributor in inequality according to decomposition analysis of determinants. This finding is consistent with results of other studies which have examined the relationship between HDI and EC (3, 15). Our results indicated that higher rates of esophageal cancer occurred in countries with lower HDI. Many cases of EC occur in the less developed and developing countries. This could be due to changing lifestyles, smoking, alcohol, and nutrition (11).
Forasmuch as HDI composed of main components including mean years of schooling, life expectancy at birth, and gross national income (GNI) per capita, the role of each of these components can be examined in this finding. Life expectancy which is one of the most important indexes of health varies widely between regions and countries around the world (16). Regional differences in life expectancy and other health indicators are explained by both socio-demographic and environmental characteristics of communities (17), including levels of social capital, access to healthcare services, access to green blue spaces and environmental pollutants. However, many of these factors are effective in reducing risk of the incidence and mortality rates of EC.
Level of health literacy can be improved by increasing mean years of schooling. Previous studies revealed that the role of health literacy is associated with reducing high-risk behaviors such as drinking, smoking, physical inactivity, and poor lifestyle, which are the causes of cancer. On the other hand, illiterate people pay more attention to health messages and will follow cancer prevention and control programs (18).
Income and household wealth is another important factor which is related to lifestyle, particularly nutritional status. Previous epidemiological studies have shown that consuming more tobacco and alcohol, and fewer fruits and vegetables are prevalent among people with low incomes than those with higher incomes (19, 20). Unhealthy nutritional status and low intake of fresh fruits and vegetables will lead to malnutrition. An important role of malnutrition in the incidence rate of EC has been proven in multiple studies (21, 22).
According to decomposition results, urbanization is the second important contributor in inequality of incidence and mortality rates of EC. People who live in urban areas have better living conditions and socio-economic status. As a result, they have greater access to infrastructure and health services such as hygienic water, varied and healthy food (23). Urbanization may also lead to increased levels of education and income that the role of these factors in reducing the incidence and mortality rates of EC was mentioned.
The role of obesity as a risk factor in cancer has been shown in several studies (6, 7) that are not consistent with the findings of our study. Given that obesity is associated with urbanization (24) that is unavoidable in regions with high HDI; so in this study obesity considers as a confounding factor in conjunction with the HDI.
An important limitation of the study is impossible as to the generalizability of the finding to small communities. Conducting similar studies at the national level and smaller communities should be done across different countries.
We aimed to identify the global inequality in the incidence and mortality of EC in relation to the HDI. In conclusion, global inequalities exist in esophageal cancer incidence and mortality rates which are contributed to the cancer-related health disparities worldwide. The important positive contributors in inequalities were HDI and urbanization. These findings suggest that prevention, early detection, and public health education programs and policies should be targeted to reduce global cancer disparities, particularly in low and middle-income developing countries.


