


1. Background
Breast cancer is one of the most common malignancies among the female population and surgery is one of the main treatments for this disease (1). Post-mastectomy pain should be minimized, although in some women, this pain may persist for months in the form of post-mastectomy pain syndrome (2). Approximately, 40% of women experience severe postoperative pain after breast cancer surgery (3).
Regional anesthesia plays an effective role in the management of postoperative pain. The results of numerous studies have shown that different methods, including epidural thoracic, plexus block interscalene brachial, paravertebral block, and pectoral nerve I and pectoral nerve II blocks are suitable (4-8). Erector spinae block (ESB) is one of the new techniques with potential applications that can be performed, using a superficial or deep needle approach. In the superficial method, the drug is injected between the large rhomboid muscle and the erector spinae muscle, whereas in the deep method, the drug is injected beneath the erector spinae (9). The Pecs I block method is also one of the regional anesthetics that is injected between the large and small pectoralis muscles (3). The results have shown that this method reduces postoperative pain, morphine consumption, and nausea and vomiting after breast surgery (10, 11).
2. Objectives
In the current study, we sought to compare the ESB and Pecs 1 block methods in terms of nausea and vomiting and postoperative pain in breast lump removal.
3. Methods
In this clinical trial, 64 women aged 18 to 50 years with ASA class 1 and 2, who were referred to Shohadaye Tajrish Hospital in Tehran and were candidates for breast lump removal, were included. Prior to the enrollment, the patients were examined for inclusion criteria, and informed consent was obtained from the patients. The Ethics Committee of the university approved the study (IR.SBMU.RETECH.REC.1398.136). Also, the study was registered in the Iranian Registry for Clinical Trials (IRCT 20181126041760N1). Patients with allergy to local anesthetics, psychotic disorders, drug addiction, coagulation disorder, local skin infection, and chronic use of analgesics and nonsteroidal anti-inflammatory drugs were excluded.
Patients under study were divided into the two groups in a random manner before inducing general anesthesia, which was performed under aseptic conditions by ultrasonography (S-Nerve Sonosite, USA). The patients either received Pecs1 block or ESB (20 cc ropivacaine, Aspen, France, 0.25%) with Sonovisible catheter (85 mm, Vygon, France). The two groups received general anesthesia under the same conditions. Bispectral index (BIS) was maintained between 40 and 60 in both groups. After surgery and complete consciousness, an anesthesia resident blinded to block type recorded pain score based on the visual analogue scale (VAS) (at recovery time and 1, 2, 4, and 6 hours after surgery), nausea and vomiting, and need for opioids (meperidine, at the doses of 0, 25, and 50) for each patient. Intraoperative systolic and diastolic blood pressure and pulse rate were also recorded at different times.
4. Results
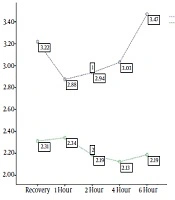
The investigation of 32 subjects in each study group and the comparison of the effect of ESB and Pecs B with respect to pain severity showed that pain intensity was less in the Pecs B group at the time of recovery and at 4 and 6 hours after surgery, but after 1 and 2 hours, the difference between the two groups was not significant. We also found a significant inter-group difference in pain intensity over time (P = 0.032; Table 1 and Figure 1).

Comparison of the pain intensity over time in the two groups
| Variable | Erector | Pecs | P Value |
|---|---|---|---|
| VAS | |||
| Recovery | 1.73 ± 3.21 | 1.22 ± 2.314 | 0.019 |
| Recovery 1 hour | 1.64 ± 2.87 | 1.61 ± 2.34 | 0.197 |
| Recovery 2 hour | 1.43 ± 2.93 | 1.67 ± 2.18 | 0.059 |
| Recovery 4 hour | 1.30 ± 3.03 | 1.49 ± 2.12 | 0.012 |
| Recovery 6 hour | 1.26 ± 3.46 | 1.14 ± 2.184 | < 0.001 |
| Repeated measurement test (P value) | 0.032 | ||
| Systolic blood pressure | |||
| Primary | 12.8 ± 116.2 | 12.2 ± 117.5 | 0.684 |
| After the injection | 12.4 ± 114.4 | 12.3 ± 117.2 | 0.341 |
| After 15 min | 12.6 ± 109.8 | 10.9 ± 117 | 0.019 |
| After 30 min | 13.5 ± 109.5 | 10.2 ± 116.2 | 0.032 |
| After 45 min | 13.1 ± 107.5 | 11.3 ± 115.7 | 0.010 |
| After 60 min | 12.9 ± 116.5 | 11.4 ± 111.7 | 0.003 |
| After 75 min | 12.7 ± 107.1 | 11.1 ± 116.5 | 0.002 |
| After 90 min | 12.7 ± 107.8 | 11.5 ± 116.7 | 0.005 |
| After 2 hours | 13.2 ± 108.3 | 12.9 ± 114.2 | 0.197 |
| After 3 hours | 13.7 ± 109.4 | 10.7 ± 116.2 | 0.019 |
| After 4 hours | 14.1 ± 109.4 | 11.2 ± 116.2 | 0.036 |
| After 5 hours | 14.5 ± 109.5 | 11.1 ± 116.9 | 0.025 |
| After 6 hours | 14.4 ± 109.7 | 10.3 ± 117.1 | 0.023 |
| Repeated measurement test (P value) | < 0.001 | ||
| Diastolic blood pressure | |||
| Primary | 7.82 ± 77.9 | 7.06 ± 78.4 | 0.778 |
| After the injection | 6.70 ± 76.8 | 6.74 ± 78.4 | 0.337 |
| After 15 min | 8.38 ± 74.6 | 6.47 ± 78.4 | 0.046 |
| After 30 min | 6.62 ± 73.9 | 5.98 ± 78.8 | 0.003 |
| After 45 min | 7.75 ± 73.8 | 6.04 ± 78.6 | 0.008 |
| After 60 min | 7.81 ± 76.2 | 6.24 ± 73.7 | 0.005 |
| After 75 min | 7.37 ± 73.2 | 2.47 ± 84.1 | < 0.001 |
| After 90 min | 6.92 ± 72.5 | 4.85 ± 78 | 0.001 |
| After 2 hours | 7.59 ± 73.8 | 4.59 ± 78.1 | 0.008 |
| After 3 hours | 7.01 ± 73.4 | 6.45 ± 78.1 | 0.004 |
| After 4 hours | 7.34 ± 73.8 | 5.33 ± 78.5 | 0.005 |
| After 5 hours | 8.21 ± 74.6 | 4.72 ± 78.1 | 0.041 |
| After 6 hours | 8.65 ± 75.2 | 7.10 ± 76.5 | 0.141 |
| Repeated measurement test (P value) | < 0.001 | ||
| Pulse rate | |||
| Primary | 10.1 ± 78.4 | 8.91 ± 76.7 | 0.457 |
| After the injection | 9.36 ± 78.1 | 8.74 ± 77.1 | 0.650 |
| After 15 min | 9.80 ± 75.1 | 8.77 ± 77.2 | 0.371 |
| After 30 min | 9.73 ± 73.5 | 8.75 ± 77.6 | 0.080 |
| After 45 min | 10.5 ± 72.5 | 8.27 ± 78.3 | 0.017 |
| After 60 min | 10 ± 72.3 | 7.93 ± 77.5 | 0.025 |
| After 75 min | 9.85 ± 71.8 | 8.58 ± 77.8 | 0.013 |
| After 90 min | 9.95 ± 73.1 | 8.04 ± 77.8 | 0.044 |
| After 2 hours | 9.78 ± 73.4 | 7.71 ± 77.8 | 0.050 |
| After 3 hours | 10 ± 74.2 | 7.07 ± 77.6 | 0.124 |
| After 4 hours | 9.94 ± 74.2 | 7.39 ± 77.4 | 0.139 |
| After 5 hours | 10.4 ± 74.3 | 6.74 ± 77 | 0.231 |
| After 6 hours | 6.21 ± 74.6 | 8.63 ± 76.6 | 0.344 |
| Repeated measurement test (P value) | < 0.001 | ||
Comparison of the Mean Pain Intensity, Systolic and Diastolic Blood Pressure, and Pulse Rate in the Two Groups at Different Times
The mean systolic blood pressure after 15 minutes to 6 hours was lower in the ESB group, and this difference was significant between the two groups over time (P < 0.001; Table 1 and Figure 2). The diastolic blood pressure was lower in the ESB group from 15 minutes to 5 hours, and it was significantly different between the two groups over time (P < 0.001; Table 1 and Figure 3).

Comparison of systolic blood pressure over time in the two groups

Comparison of diastolic blood pressure over time in the two groups
The results of the pulse rate in the two groups showed that the pulse rate was significantly lower from 45 minutes to 2 hours in the ESB group, but no difference was observed between the two groups until 6 hours. In addition, there was a significant difference in pulse rate between the two groups over time (P < 0.001; Table 1 and Figure 4).

Comparison of pulse rate over time in the two groups
We also noted that the need for opioids at zero doses was higher in the Pecs B group at different hours, and at the 25 and 50 doses, the need for opioids was more frequent in the ESB group. At 6 hours, the two groups were significantly different in terms of the need for opioids (P = 0.041; Table 2). The results demonstrated that the frequency of nausea and vomiting were not significantly different between the two groups (P > 0.55; Table 3).
| Need for Drugs/Group | Dose | P | ||
|---|---|---|---|---|
| 0 | 25 | 50 | ||
| Recovery | 0.061 | |||
| Erector | 20 (62.5) | 4 (12.5) | 8 (25) | |
| Pecs | 28 (87.6) | 2 (6.2) | 2 (6.2) | |
| Recovery 1 hour | 0.186 | |||
| Erector | 21 (65.6) | 7 (21.9) | 4 (12.5) | |
| Pecs | 27 (75) | 4 (36.4) | 1 (20) | |
| Recovery 2 hour | 0.661 | |||
| Erector | 23 (71.9) | 5 (15.6) | 4 (12.5) | |
| Pecs | 26 (81.3) | 3 (9.4) | 3 (9.4) | |
| Recovery 4 hour | 0.676 | |||
| Erector | 23 (71.9) | 6 (18.8) | 3 (9.4) | |
| Pecs | 26 (81.3) | 4 (12.5) | 2 (6.3) | |
| Recovery 6 hour | 0.041 | |||
| Erector | 21 (65.6) | 6 (18.8) | 5 (15.6) | |
| Pecs | 28 (87.5) | 4 (12.5) | 0 (0) | |
Comparison of the Need for Opioids at Different Doses in the Two Groups at Different Times
| Variable | Group | P | |
|---|---|---|---|
| Erector | Pecs | ||
| Nausea | 0.554 | ||
| No | 30 (93.8) | 31 (96.9) | |
| Yes | 2 (6.3) | 1 (3.1) | |
| Vomit | - | ||
| No | 32 (100) | 32 (100) | |
| Yes | 0 (0) | 0 (0) | |
Comparison of Nausea and Vomiting in the Two Groups
5. Discussion
The increasing number of breast surgery cases for the treatment of breast cancer has elevated the need for anesthetic techniques to reduce pain, safety, and complications. In breast surgery, acute postoperative pain in the injured muscles and nerves is one of the risk factors for chronic pain and its severity. Therefore, postoperative pain management is important in order to satisfy patients and achieve optimal treatment outcomes. Regional techniques are one of the optimal techniques for mitigating acute and chronic pain after breast surgery (12-14).
The aim of this study was to compare the effects of two methods of ESB and Pecs block on nausea and vomiting and postoperative pain in breast lump removal. The results showed that pain severity during recovery was lower in the Pecs B group at 4 and 6 hours, but no significant difference was noted after 1 and 2 hours. The results also showed a significant difference in pain intensity between the two groups over time. Kulhari et al. have recently shown that Pecs block produces better analgesia and reduces postoperative opioids use (15).
In the study of Gad et al., pain score and the frequency of analgesics use in the SEP group was higher than in the Pecs group, which was consistent with the results of the present study (16). A clinical trial by Ghamry and Amer (17) aimed at examining the role of erector spinae plane block (ESPB) versus paravertebral block in the control of postoperative pain after mastectomy showed no significant difference in pain score between the two groups within 24 hours (2, 4, 6). No pain was reported at 8, 12, 18, and 24 hours after surgery, and pain intensity began to increase at 3 to 6 hours after surgery, and pain intensity was significantly different between the two groups at 6 hours after surgery (17). In a clinical trial by Fang et al., no significant difference was found between the ESPB and thoracic paravertebral block (TPVB) groups during the first two days after surgery (18). The authors stated that injection in a seated or lying position affects the function of Pecs and TPVB (19).
The results showed that the mean systolic blood pressure after 15 minutes to 6 hours was lower in the ESB group and showed a significant difference between the two groups over time (although not clinically significant). Diastolic blood pressure was lower in the ESB group from 15 minutes to 5 hours and the difference between the two groups was significant over time. In Fang et al.’s study, blood pressure was also lower in the ESP B group than in the TPVB group, which was statistically significant (18). In the study of Altiparmak et al., the mean arterial blood pressure was similar in both groups (20).
The results of pulse rate evaluation in the two groups showed that the pulse rate was significantly lower from 45 minutes to 2 hours after surgery in the ESB group. However, the groups were different until 6 hours after surgery. There was a significant difference in pulse rate between the two groups over time. In Fang et al.’s study, there was a significant difference in pulse rate between the ESPB and TPVB groups. This finding is in line with the results of the present study (18). In the study of Altiparmak et al., there was no significant difference in pulse rate between the two groups, whereas in intra-group comparison, pulse rate was significantly different between the patients at different times compared to baseline in the two groups (20).
The results also showed that the need for opioids at zero doses was higher in the Pecs B group at different hours and at the 25 and 50 doses, and in the ESP B group, the need for opioids was more frequent, but at 6 hours, there was a significant difference between the two groups in terms of need for opioids. In a clinical trial by Fang et al., there was no significant difference between the two groups in terms of sufentanil dose (18).
In the study of Ghamry and Amer, there was no significant difference between the two groups in terms of postoperative morphine use (17). Altiparmak et al. in their study also showed that morphine use decreased by up to 65% in the ESPB group within 24 hours after surgery, although there was no difference in the severity of pain between the two groups (21). In a study by Altiparmak et al., the mean tramadol dose in the Pecs group was significantly lower than in the ESP group (20). In the study of Gad et al., morphine dose was significantly lower in the Pecs B group than in the ESPB group (16).
The results demonstrated that the frequency of nausea and vomiting was not significantly different between the two groups (Table 3), which is in agreement with the results of the study conducted by Fang et al. (7). In the present study, the frequency of nausea was 6.3% in the ESB group and 3.1% in the Pecs B group, while none of the patients in both groups had vomiting. In Gurkan et al.’s study, 32% of the patients in the ESB group and 40% in the control group had postoperative nausea and vomiting, which is higher than the findings in the present study (22). This discrepancy is due to the different sample sizes.
5.1. Conclusions
Different regional pain management techniques can be used in surgical procedures. Pecs block seems to block an anterior cutaneous medial branch of intercostal nerves of the same side and creates superior bilateral analgesia compared to ESB and reduces the need for opioids. On the other hand, due to proximity to the intrathecal and epidural space, ESB may be associated with more hemodynamic changes, but less clinical significance.
