


1. Background
Cancer refers to cellular proliferation when the cell no further follows the growth control and cell division mechanisms. Cancer is a genetic disease induced by genetic damage (1, 2).
In terms of carcinogenesis, the genes involved in cancer are classified into 2 large groups: The genes that produce the growth and proliferation phenotype, known as oncogenes; and genes that regulate or inhibit proliferation, the so-called tumor suppressor genes (3, 4).
Lung cancer is one of the leading causes of death worldwide, with more than a million deaths a year. Every year, out of every 100,000 people, 6.4 people develop lung cancer. According to the World Health Organization (WHO) report, published in May 2014, the number of deaths from lung cancer in Iran reached 4,356, or 13% of all deaths. About 85% of patients are suffering from non-small cell lung cancer (NSCLC), indicating the significance of diagnosis at the early stages. In spite of advanced surgical techniques and combined therapies, lung cancer is still with a poor prognosis. Lung cancer has the lowest probability of survival among other cancers (5, 6). Accordingly, the best practice for the timely treatment of the disease and the elimination of the disease complications is to find out specific markers for each type of cancer (7).
This information reveals an urgent need to detect more advanced diagnostic and therapeutic options (8).
With the use of proteomics, the phenotypes of cancerous and normal cells exactly highlight their phenotypic and then their genotypic differences, which is an accurate and logical method. Samples include both healthy and tumor sections of each patient, so after 2-dimensional electrophoresis, a healthy protein pattern and tumor are obtained that are comparable point to point. In addition, this method is with low error rate compared to parallel methods (9, 10).
Cytochrome b5 reductase 2 (CYB5R2) and fructose-1,6-bisphosphatase 1, both of which have important functions, can be further studied as prognostic molecules for lung cancer. For example, CYB5R2 may be a potent tumor suppressor gene (11).
The second protein is fructose-1,6-bisphosphatase 1, which is a metalloprotein with 3 magnesium groups and 1 manganese group. It acts as a speed-limiting enzyme in gluconeogenesis. Accordingly, it plays a critical role in regulating glucose sensitivity and insulin secretion from beta cells in the pancreas (12).
2. Objectives
The aim of this study was to obtain a protein pattern in people with NSCLC. However, due to limited financial resources, only a few protein spots were examined and further studies will be conducted.
3. Methods
3.1. Patients and Tissue Sampling
Total of 30 patients were selected by a specialist who was definitively diagnosed with lung cancer. From each patient, tumor tissue was taken from the center and a sample of healthy tissue was taken from the margins. Therefore, the number of samples examined was 60. Sampling place was at Masih Daneshvari Hospital, under the supervision of Shahid Beheshti University of Medical Sciences, the operating room was biopsied on the patients. Tissue samples were collected immediately after surgery, wrapped in aluminum foil, snap-frozen in liquid nitrogen, and maintained at -70°C. The age of the patients at the time of diagnosis ranged from 23 to 78 years (69% males, 31% females) with a mean of 58 years.
3.2. Protein Preparation
Firstly, 150 - 200 g of tissue was ground with liquid nitrogen and then was dissolved in a special buffer, after that was vortexed for 30 min, and then was centrifuged at 13,000 rpm for 30 min. The supernatant was removed and stored at -70° C for 2-dimensional electrophoresis (2DE) (13, 14).
3.3. Two-Dimensional Electrophoresis
Samples were subjected to isoelectrofocusing (IEF) following to adaptations and slight modification. Then 2-dimensional electrophoresis was performed (15).
3.4. Staining
Protein staining using silver nitrate staining was performed using 2 modified Bloom methods (16, 17).
3.5. Image Analysis
Pairs of 2DE gels composed of the tumor and normal gels from each patient were used and the percent volume of each spot was estimated and analyzed by Melani software versions 5 for image analysis.
The basis of protein point analysis on tumor and healthy gels was a point-to-point comparison and was based on 4 changes including increased expression, decreased expression, the presence or absence of proteins in healthy tissue relative to tumor tissue.
3.6. Mass Spectrometry
After examining the differences between tumor and healthy gels, as usual in all proteomics laboratories in the world, the spots were identified and cut off from the gels, and for Mass, in Vial 0.5 ml sent to Cinacolon Company for polypeptide detection using liquid chromatography-mass spectrometry (LC-MS / MS) method.
The acquisition was performed with an ABSciex TripleTOF 5600 (ABSciex, Foster City, CA, USA) equipped with an electrospray interface with a 25 μm iD capillary and coupled to an Exigent μUHPLC (Eksigent, Redwood City, CA, USA). Analyst TF 1.7 software was used to control the instrument and for data processing and acquisition.
3.7. Real-Time Reverse Transcriptase Polymerase Chain Reaction (Real-Time RT-PCR)
The ribonucleic acid (RNA) extraction steps were performed using the kit (Cinna pure Cat no. PR891620) measured by a NanoDrop device, and absorbed by spectrophotometer at 280 - 260 nm wavelength. The ratio was acceptable within the range of 1.6 - 1.8.
The synthesis of complementary Deoxyribonucleic acid (cDNA) was performed using Viva 2-step reverse transcriptase polymerase chain reaction (RT-PCR) Kit (Cat no. RTPL12). Table 1 shows the specifications of the primers used in the real-time RT-PCR reaction.
| Parameters | Fructose-1,6-Bisphosphatase | Cytochrome b5 Reductase 2 | 18s rRNA |
|---|---|---|---|
| Primer F | CTACGCCAGGGACTTTGACC | AAACACTGGCCGATCACCT | GTAACCCGTTGAACCCCATT |
| Primer length | 20 | 19 | 20 |
| Primer R | GGCCCCATAAGGAGCTGAAT | TGACCAAGATATCCTCCTCTGT | CCATCCAATCGGTAGTAGCG |
| Primer length | 20 | 22 | 20 |
Real-time RT-PCR reaction was performed using the Cat-No.BT11101 kit from Sinaclon CO. The components required to react in the master-mix kit were prepared. The real-time RT-PCR reaction components were: (A) 2 μL cDNA, (B) 4 μL master mix, and (C) Primer, according to the best concentration found in the initial set up experiments, (D) Deionized distilled water as much as the final volume of reaction reached 20 μL.
The reaction temperature and time were adjusted according to the kit instructions (Table 2). After the end of each reaction, the results were interpreted according to the Amplification and Melting peak curves. In order to determine the relative differences in the gene expressions of the 2 groups, the ΔΔCt method was used (18). Now, if 2 is powered by - ΔΔCt, the difference between the marker expressions is determined.
| Real-Time Step | Temperature | Duration |
|---|---|---|
| Initial activation | 95ºC | 5 min |
| 40 cycles | ||
| Denaturation | 95ºC | 15 s |
| Annealing | 56 - 60ºC | 60 s |
| Extension | 72ºC | 20 s |
4. Results
4.1. Demographic Data
Samples of 30 patients, which contained 2 cm healthy tissue and 2 cm tumor tissue, was examined in this study. The pathological records of all these patients were also provided by Masih Daneshvari Hospital. The participants consisted of 11 female and 19 male patients with minimum and maximum ages of 23 of 73 years, respectively, and an average age of 58 years.
4.2. Proteomics Research
More than 40 significant differences were observed in comparisons between tumor and healthy gels, but due to financial and currency problems, only a limited number of these differences were considered for the study, and the continuation of the evaluation of spots will be done in further studies (Figure 1).

A representative 2DE gel of tumor & normal tissue. Arrows and numbers indicate down-regulated proteins in comparison with their matched tumor tissue.
In this study, a number of differences between healthy and cancerous gels were used for mass spectrometry, of which 2 are discussed in this paper.
4.3. Mass Spectrometry Studies
After identifying the spots, they were removed from the gels and sent for mass spectrometry.
Fortunately, the same results were obtained for the digestion of repetitive samples.
Some of the specifications of these stains are shown in Table 3.
| Polypeptide | Protein Name | Tissue Specification | Accession Number Based on NCBI | Chromosome | Expression Profiling or Level |
|---|---|---|---|---|---|
| E | Fructose-1,6-bisphosphatase 1 | Normal | sp|P09467|F16P1 | 9 q22.3 | Down regulation |
| H | Cytochrome b5 reductase 2 | Normal | sp|P00167|CYB5 | 18q22.3 | Down regulation |
Abbreviation: LC-MS / MS, Liquid Chromatography–Mass Spectrometry.
4.4. Real-Time RT-PCR Results
After extracting the real-time RT-PCR reaction results, the number of patients from each of the 2 main study groups, who were positive regarding the expression of the markers, were specified.
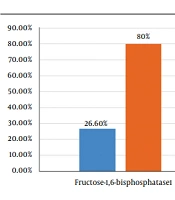
Positive fructose-1,6-bisphosphatase 1 mRNA marker for cancer samples was observed in 8 out of 30 samples. In healthy tissue group, the frequency was 24 out of 30 cases. The comparison of this marker positivity in the 2 groups using the 2-sample binomial test showed a significant difference between the 2 groups (P < 0.001) (Figure 2).

Expression of fructose-1,6-bisphosphatase 1 and reductase2 cytochrome b5 markers in healthy and cancerous tissues
The cytochrome b5 reductase 2 mRNA marker in 6 out of 30 cancer patients was positive. In the healthy tissue group, the frequency was 22 out of 30 cases. The comparison of this marker positivity in the 2 groups using the 2-sample binomial test showed a significant difference between the 2 groups (P < 0.001).
4.5. Evaluation of the Differences Between Marker Expressions in 2 Research Groups
Relative differences between marker expressions in healthy and cancer tissues were measured. This was carried out using the ΔΔCt method for fructose-1,6-bisphosphatase 1 and cytochrome b5 reductase2.
ΔΔCt was calculated for fructose-1,6-bisphosphatase 1 mRNA, indicated that the expression of this marker in healthy tissue was 0.8 times greater than its expression in cancerous tissues.
ΔΔCt was calculated for cytochrome b5 reductase 2 mRNA, indicated that the expression of this marker in healthy tissue was 0.64 times greater than its expression in cancerous tissues. (Figure 3).

Difference in the expression of fructose-1,6-bisphosphatase 1 mRNA markers and cytochrome b5 reductase 2 mRNA in healthy and cancerous tissues.
5. Discussion
Lung cancer is one of the major causes of death worldwide, with more than a million deaths a year (19).
Tumor markers are measurable chemicals that are associated with tumor malignancy. Tumor markers can be used for screening and early diagnosis of cancers, determining progress, monitoring treatment, or recognizing cancer reemergence (20, 21).
Two-dimensional electrophoresis is one of the methods that allows the study of a large number of proteins with high precision and sensitivity, which themselves are the product of the gene expressions. This method, along with other methods such as Blotting and Mass Spectrometry, has accelerated the investigation of the polypeptides. For example, such a method revealed 41 differences between healthy and cancerous cells in the hepatotoxicity (hepatoma) (22). In line with such studies, in this study for the case of lung cancer, approximately 74 differences between healthy and cancerous cells were detected. In this study, the effect of 2 proteins was also investigated:
The fructose-1,6-bisphosphatase is an enzyme that converts fructose-1,6-bisphosphate to fructose-6- bisphosphate-1 in gluconeogenesis and Calvin cycle, which both are anabolic pathways (12).
In this study, the findings showed that the expression of this protein in the cancerous tissues is greatly reduced and in more severe cases cancer has completely disappeared. Investigating 2-dimensional electrophoresis gels and mass spectrometric results, we also noticed that the expression of this important enzyme was greatly decreased in the Calvin cycle. In 2018, Dang et al. studied the enzyme promoter in patients with non-small cell lung cancer (NSCLC) and observed its sharply decreased expression. Their survey on the promoter area showed that the area was severely methylated and prevented the expression of the protein. On the other hand, the disruption of this enzyme in H460 cells using a specific small interfering RNA (siRNA) significantly increased cell proliferation and cell migration and metastasis compared to fructose-1,6-bisphosphatase. These findings document the significant role of this protein in decreasing this cancer-causing process in NSCLC patients (23).
In another study by Li et al. (2017) on 140 patients with cervical cancer, they noticed a sharp decrease in the enzyme. Moreover, the level of fructose-1,6-bisphosphatase mRNA in tumor tissues fell down, compared to the normal tissues of the cervix. (24).
In this case, Chen (2017) confirmed the reduction of fructose-1,6-bisphosphatase expression in a radiology journal through examining 85 HCC patients undergoing thermography (25).
The second protein considered in the present study was cytochrome b5 reductase, which is emphasized in many articles because of its tumor suppressor operation. We also observed a significant decrease in the expression of this vital protein for tumor tissues. Expression of this protein in healthy tissues suggests the activity of cytochrome B5, a membrane-bound hemoprotein, as an electron carrier for several membrane-bound oxygenases. Cytochrome B5 may be a potent tumor suppressor gene (11).
In order to further confirm this finding, Huixin et al. (2010) also announced CYB5R2 as a potential tumor suppressor, which inhibits cell proliferation and cellular mobility in the nasopharyngeal carcinoma (NPC). The inactivation of CYB5R2 is associated with metastasis to the lymph node in the NPC. The CYB5R2 regulates the expression of genes leading to negative NPG cell angiogenesis and reduces the Vascular Endothelial Growth Factor (VEGF) expression to decrease angiogenesis and ultimately suppress tumor (26).
In another study, Lund et al. (2015) claimed that metastasis is the leading cause of death from cancer and the most important challenge is how to manage the disease. Metastases are created through a complex multistage process including intracellular signaling pathways. They also studied 2 groups of patients with breast cancer and found a significant correlation between high expression of CYB5R2 and the absence of disease in patients with negative estrogen receptor tumors. Decreased apoptosis of metastatic cancer cells was confirmed by decreased CYB5R2 expression in functional experiments. They mentioned that these findings could be useful for introducing CYB5R2 as a potential biomarker (27).
In line with the finding of this study indicating that the Cytochrome b5 reductase expression significantly declined in the NSCLC cancer gel, Zaio’s et al. (2014) study on CYB5R2, as a member of the flavoprotein family, documented its critical role in cancer, especially NPC in patients with nasopharyngeal cancer. They showed that CYB5R2 might be an effective tumor suppressor gene, which is often deactivated by its hypermethylation promoter in the NPC. Eventually, they proposed the use of CYB5R2 as a NPC diagnostic biomarker in the future (28).
5.1. Conclusions
Accordingly, both of these proteins play important roles in the cancer-causing process of the cells. CYB5R2 has both signaling and detoxification effects on cancer cells. The enzyme fructose-1, 6- bisphosphatase also has a direct effect on the health of cells by regulating the energy flow pathway. Finally, further studies on these 2 proteins as diagnostic biomarkers are recommended.
