


1. Background
Radiotherapy plays a major role in the treatment of cancer (1). 3D conformal radiotherapy technique used in this study aimed at delivering the prescribed dose to the tumor volume by sparing the surrounding tissues and organs (2). Thus, a large amount of information on tumor and organs at risk (OAR) volumes is necessary to avoid any overdose or unacceptable dose uncertainty (1-3). X-ray computed tomography (CT) is the main imaging modality used for radiotherapy treatment planning and different volumes and structures delineation. Unfortunately, CT, in the case of brain cancer, cannot provide information on low-density tissues in comparison with magnetic resonance imaging (MRI). Indeed, MRI can provide high-resolution anatomical and structural images and details on the extension of the tumor and its impact on adjacent organs by using some specific MRI sequences (4, 5). Glioblastoma is the most common brain cancer among adults. It is caused by an abnormal proliferation of central nervous system cells called astrocytes. With radiotherapy, these cancer cells are destroyed or their development is stopped by exposing them to ionizing radiation. Radiotherapy is often prescribed after surgery. This technique is also used as the main treatment combined with chemotherapy when the tumor is not operable. To optimize the results of the treatment, the used beams ballistic is finely planned to specifically target the tumor and to avoid side effects. Thus, the contouring phase is crucial to achieving such an objective. Indeed, many contouring models were proposed based on clinical tumor volume (CTV) and edema delineation. In this research, we focused on the contribution of MRI in radiotherapy treatment planning and, particularly, its role in the visualization and delineation of the gross tumor volume (GTV), the programmed target volume (PTV), and the OARs for patients suffering from Glioma. The necessary CT/MRI image registration and fusion are sometimes and for a specific case of radiotherapy treatments so difficult to be performed concerning the recommended conditions by Khan (6) and Barett et al. (7). The related issues of such technical limitations are studied in this study. The present study concerns only rigid registration because non-rigid registration remains relatively not used in radiotherapy planning though some interesting approaches are under development (8, 9). Many registrations and fusion assessment metrics are proposed in this work to help clinicians to do accurate delineation (10, 11).
2. Objectives
In this study, the Eclipse treatment planning system (TPS) and Elastix rigid registration methods were studied and compared for a specific case of Glioma radiotherapy treatment. The comparison was performed in terms of volume delineation and dose calculation based on external and independent metrics.
3. Methods
3.1. Imaging Data and Treatment Planning
This study was carried out on 4 patients admitted for Glioma brain tumor (Table 1). The CT and MRI data were collected around Siemens SOMATOM AS high definition CT-scanner and 1.5T GE Optima MR450W MRI machine, respectively. The radiotherapy TPS used is the Varian Eclipse 11.0.31. The dose calculation algorithm used is the anisotropic analytical algorithm (AAA). The MRI sequences used are the T2-weighted flair sequence for the visualization of edema and the T1 sequence with Gadolinium contrast agent injection for the visualization of the tumor. The dose constraints on OARs that must be respected during radiotherapy planning and treatment of brain tumors are indicated in Table 2 (12).
| Patient 1 | Patient 2 | Patient 3 | Patient 4 | |
|---|---|---|---|---|
| PTV CT, cm3 | 448,3 | 519,8 | 328,5 | 297,9 |
| PTV MRI, cm3 | 620,4 | 696,6 | 408,7 | 466,5 |
| Tumor localization (x, y) | Right posterior parietal (189, 409) | Left parietal (273, 303) | Right posterior parietal (171, 338) | Right anterior (198, 181) |
Abbreviation: CT, computed tomography; MRI, magnetic resonance imaging; PTV, programmed tumor’s volumes.
| Organ | Dose Constraint, Gy |
|---|---|
| Optic chiasm | Dmax = 54 |
| Pituitary | Dmax = 45 - 50 |
| Larynx | Dmax < 63 - 66 |
| Spinal cord | Dmax ≤ 50 |
| Optic nerve | Dmax ≤ 54 |
| Eyes-crystalline | Dmax < 10 - 15 |
| Eyes-retina | Daverage ≤ 45 |
| Brain | V60 Gy < 33 % |
3.2. CT/MRI Image Registration and Fusion
In radiotherapy, multimodalities image registration is a geometrical process used in medical imaging to align two different images to bring together complementary information that is necessary to perform correct diagnosis and accurate volumes and structures delineation (13, 14). The image registration consists of a set of spatial transformations (translation, rotation, scaling, sampling, etc.) to be applied to a targeted image in order to make it spatially aligned to a reference image. In this research, the necessary CT/MRI image registration and fusion was performed within the Eclipse TPS by using automatic, manual, and hybrid (semi-automatic) registrations. These 3 registration tools used different similarity metrics, linear interpolators, registration optimizers, and 3D image translation and rotation. Unfortunately, these image registration tools do not give the same results within the same execution time. Therefore, depending on the considered treatment case, one Eclipse registration method might be more appropriate than another (15, 16). In the current study, automatic registration is considered a reference registration. In addition to the Eclipse registration tools and methods, the TPS independent Elastix image registration was also studied (10, 11). Elastix is an open-source software based on the insight segmentation and registration toolkit (ITK). Elastix registration is also used to evaluate the Eclipse image registration methods. Elastix registration uses mutual information as a similarity metric and the gradient descent as an optimizer. After the image registration with Elastix, Eclipse fuses the information of two images into a single one by selecting the suitable transparency and opacity parameters that give satisfaction to the radiotherapy clinician (17, 18).
3.3. Volumes and Structures Delineation
In the present study, the guess and check method was used. Thus, the cyclic work is achieved through a close collaboration between radiotherapy clinician that performs CT/MRI image registration and fusion as well as different volumes and structures delineations and the medical physics that performs dose calculation. The procedure is repeated for each new CT/MRI image registration and fusion. The delineation of the tumor and the OARs was done first on CT-slices and, then, corrected on fused CT/MRI images according to the protocol of Glioma treatment described by Feuvert et al. (19). The imaging modalities used for the delineation of the different volumes and structures of the studied cases are presented in Table 3 (19).
| Tumor’s Volumes and Organ at Risk | Modality of Delineation |
|---|---|
| GTV | MRI |
| PTV | MRI |
| Edema | MRI |
| Chiasma | MRI |
| Pituitary | MRI |
| Optic nerve | MRI |
| Brainstem | MRI |
| Eyes | CT |
| Brain | CT |
| Crystalline | CT |
Abbreviations: CT, computed tomography, GTV, gross tumor volume; MRI, magnetic resonance imaging; PTV, programmed tumor’s volumes.
3.4. Registration Evaluation and Comparison Metrics
The CT and MRI images were used with reconstruction resolution and voxel spacing as indicated in Table 4. In this work, suitable metrics are proposed to clinicians to assess their CT/MRI image registration and fusion work. Hence, the registration results were evaluated qualitatively and quantitatively regarding the automatic registration of Eclipse. The proposed metrics are the Dice score coefficient (DSC), the Jaccard similarity coefficient (JSC), and the Hausdorff distance (HD) (20-22). The DSC ranges from 0 to 1, where 0 indicates no overlapping and 1 indicates full overlapping between fused images. The JSC ranges also from 0 to 1, where 0 means no overlapping and 1 indicates a full overlapping. The HD is measured in mm and ranges from 0 (identical surfaces) to + ∞.
| Mode | Patient 1 | Patient 2 | Patient 3 | Patient 4 | |
|---|---|---|---|---|---|
| CT dimension | Cerebral | 512 × 512 × 71 | 512 × 512 × 74 | 512 × 512 × 74 | 512 × 512 × 74 |
| CT Voxel spacing, mm | 0.48 × 0.48 × 3 | 0.48 × 0.48 × 3 | 0.48 × 0.48 × 3 | 0.48 × 0.48 × 3 | |
| MRI dimension | T1-Gd | 512 × 512 × 296 | 512 × 512 × 250 | 512 × 512 × 264 | 512 × 512 × 37 |
| T2-flair | 512 × 512 × 45 | 512 × 512 × 34 | 512 × 512 × 49 | 512 × 512 × 37 | |
| MRI Voxel spacing, mm | T1-Gd | 0.46 × 0.46 × 0.7 | 0.46 × 0.46 × 1 | 0.46 × 0.46 × 1 | 0.46 × 0.46 × 5 |
| T2-flair | 0.46 × 0.46 × 5 | 0.46 × 0.46 × 5 | 0.46 × 0.46 × 5 | 0.46 × 0.46 × 5 |
Abbreviations: CT, computed tomography; MRI, magnetic resonance imaging.
4. Results
4.1. Comparison Between Delineation and Calculated Dose on CT and CT/MRI Fusion
In this study, the PTVs and OARs delineated on CT images and CT/MRI fused images are compared in terms of volumes and re-calculated doses. The PTVs delineated on the CTs were ~1.38 times smaller than the PTVs delineated on CT/MRI fused image. Otherwise, large differences between delineated volumes by CT and MRI were observed for edema and brainstem (Figure 1). The observed differences are due to the non-accurate localization and incorrect delineation of the PTV and the OARs on CT that can induce the irradiation omission of some tumor parts or the overdosing of the surrounding OARs (Figure 2). Figure 3 shows the dose levels to be delivered to the sensitive OAR (optic nerve and brainstem) when delineation is performed on CT-slices only or CT/MRI fused images. It is well verified that MRI optimizes considerably the dose to be delivered to the optic nerve and brainstem. Dose optimization is between -5.71% and -19.27% for the right optic nerve, between -4.76% and -57.69% for the left optic nerve except for patient 3, where dose increased by 10.34%, and between -2.53% and -14.13% for the brainstem except for patient 1, where dose increased by 18.32%. The exceptional observed dose augmentation is a normal effect of considered case complexity. It can be concluded that the tumor’s localization (Table 1) has a great impact on the optic nerve and brainstem dose optimization. By referring to the constraints on doses (Table 2), the deviations on calculated doses concerning these constraints are all within the admissible limits.

PTVs, edema, and Brainstem delineation by CT and MRI in cm3

3D images showing the difference between Glioma’s PTV delineated on CT and MRI images
 to be delivered to the optic nerve and the brainstem based on the CT and MRI delineations")
Calculated dose (Gy) to be delivered to the optic nerve and the brainstem based on the CT and MRI delineations
4.2. Evaluation and Comparison Between Registration Methods
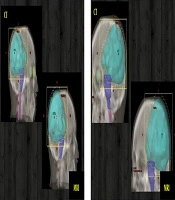
The PTV’s localization and shape of the image registration methods were compared to the TPS automatic registration results. The results of the PTVs comparison are shown in Figure 4. It can be easily verified that poor overlapping was observed for the hybrid registration, acceptable one for the manual registration, and almost good overlapping for the Elastix registration.
 and PTV’s volumes overlapping of the three tested registration methods in comparison to the reference automatic registration (bottom)-Overlapping difference is in white: 1, manual; 2, Hybrid; and 3, <i>Elastix</i>.")
Qualitative registration evaluation (top) and PTV’s volumes overlapping of the three tested registration methods in comparison to the reference automatic registration (bottom)-Overlapping difference is in white: 1, manual; 2, Hybrid; and 3, Elastix.
The comparison between registration methods based on the used metrics is presented in Table 5. The PTV of the automatic registration is taken each time as a reference. The metrics comparison demonstrates that the hybrid registration is the poor one in terms of exact volume and structure overlapping, a mean divergence is observed for the manual registration and almost a good registration similarity for the Elastix method. A comparison between re-calculated doses, based on these registrations and new treatment planning, was also performed. According to the obtained results (Table 5), the re-calculated doses of the Elastix registration were in good agreement with those of the automatic registration (reference). Thus, the Elastix registration was the best method followed by manual registration, which is better than the hybrid registration.
| Patient 1 | Patient 2 | |||||
|---|---|---|---|---|---|---|
| JSD | DSC | HD | JSD | DSC | HD | |
| Registration metrics comparison | ||||||
| PTV | ||||||
| Elastix | 0.967 | 0.983 | 1.880 | 0.949 | 0.974 | 1.753 |
| Hybrid | 0.877 | 0.635 | 5.016 | 0.817 | 0.899 | 5.545 |
| Manual | 0.934 | 0.966 | 2.817 | 0.898 | 0.946 | 3.507 |
| Edema | ||||||
| Elastix | 0.900 | 0.947 | 2.369 | 0.937 | 0.967 | 1.315 |
| Hybrid | 0.782 | 0.878 | 4.399 | 0.775 | 0.873 | 4.135 |
| Manual | 0.854 | 0.921 | 2.816 | 0.901 | 0.948 | 2.480 |
| Re-Calculated Dose, Gy for Each Registration Method | ||||||
| Brainstem | ||||||
| Elastix/automatic | 53.1/53.1 | 53.29/52.37 | ||||
| Hybrid/automatic | 55.2/53.1 | 57.12/52.37 | ||||
| Manual/automatic | 54.4/53.1 | 57.18/52.37 | ||||
| Chiasma | ||||||
| Elastix/automatic | 46.5/45.5 | 49.54/49.51 | ||||
| Hybrid/automatic | 48/45.5 | 56.49/49.51 | ||||
| Manual/automatic | 49.2/45.5 | 55.20/49.51 | ||||
| Optic nerve (right) | ||||||
| Elastix/automatic | 6.7/6.7 | 53.67/50.63 | ||||
| Hybrid/automatic | 7.6/6.7 | 58.32/50.63 | ||||
| Manual/automatic | 7.6/6.7 | 56.34/50.63 | ||||
| Optic nerve (left) | ||||||
| Elastix/automatic | 2/2 | 34.98/33.60 | ||||
| Hybrid/automatic | 2.1/2 | 47.30/33.60 | ||||
| Manual/automatic | 2.1/2 | 43.20/33.60 | ||||
Abbreviation: DSC, Dice score coefficient; HD, Hausdorff distance; PTV, programmed tumor’s volumes.
5. Discussion
For the studied tumor, the radiotherapy clinician firstly uses the rigid automatic registration, based on mutual information similarity metric and Downhill simplex optimizer, for CT/MRI image registration and fusion. This automatic registration is fast and simple and gives generally good results. However, the other manual and hybrid Eclipse’ registrations are used instead of the automatic registration, particularly when the last one fails. The manual registration is more difficult and time-consuming because the radiotherapy clinician is generally asked to perfectly use the TPS translation and rotation tools to perform correct 3D registration in the sagittal, coronal, and axial plans. In hybrid registration, the task is based on the manual selection of a set of points by the clinician on CT and MRI images at specific anatomical landmarks. Here, the registration consists of matching between defined points and task which is also so difficult and time-consuming.
In this study, the advantages and limitations of the CT/MRI image registration and fusion were well demonstrated in the case of Glioblastoma radiotherapy treatment with 3D conformal radiotherapy technique. The great contribution of MRI in the delineation of the edema and PTV, which cannot be correctly achieved by CT, was sufficiently demonstrated. The difference in terms of PTV localization and delineation between CT and MRI was found so large to completely reject the treatment planning based on CT data only. This difference is principally due to the excellent MRI soft tissue contrast and to its multitude of robust imaging sequences (T1, T2, T2-Flair, and T1-Gd.) that can be used for excellent brain examination. It was also demonstrated that Elastix registration can be used to judge the accuracy of the TPS automatic registration, which is generally first used. The registration performance was evaluated by the comparison of PTV and edema delineation based on DSC, JSC, and HD metrics and also by comparing the re-calculated doses after each registration. The results showed that an almost good reproduction of the automatic registration results was obtained by the Elastix registration within an average of 0.98 (98%) for DSC and less than 1 mm for HD.
5.1. Conclusions
In this research, among the studied registration methods, Elastix registration was demonstrated to perform the best registration and, therefore, the most accurate radiotherapy planning according to the considered intensity and anatomical landmarks metrics. The manually and hybrid TPS methods were found to be less efficient than the Elastix method and time-consuming. In terms of registration comparison metrics, the Elastix method gives the most closet results to the TPS automatic registration method (reference). Special care must be taken when applying TPS automatic registration because it does not give suitable results for each considered tumor’s case. In summary, we have shown that CT/MRI image registration in radiotherapy treatment planning can effectively be evaluated and improved by the clinician through the combination of TPS automatic registration and Elastix registration. Furthermore, we have demonstrated the importance of employing suitable evaluation metrics when assessing the accuracy of the registration used. It was, then, well demonstrated that the used registration can seriously affect the accuracy of dose calculation if not well assessed and optimized.
