1. Background
The incidence and mortality of breast cancer (BC) have shown an annual increase of 3.1% and 1.8% from 1980 to 2010, respectively (1). There is a broad consensus on the role of socioeconomic disparities in mortality and morbidity of cancer (2, 3), which puts a more severe strain on developing countries such as Iran.
Cancer is the 3rd cause of death in Iran (4-6). BC is the most common cancer and the 5th cause of cancer deaths among Iranian women (7). It is also responsible for 14.2% of overall cancer mortalities (8, 9). Moreover, to ameliorate complications arising from the increased length of survival (2, 10, 11), the significance of post-diagnosis health behaviors must be underscored. A review of the literature shows that health habits play a crucial role in increasing the odds of survival (12, 13).
Health behaviors have been instrumental in our understanding of the social gradient in health (14-17); one reason is that health behaviors potentially mediate the relationship between socioeconomic status (SES) and health (18, 19). Furthermore, health behaviors themselves are influenced by SES disparities (18, 20-22). This indicates a need to understand the mechanisms by which SES impacts health behaviors (23-27). Identifying these factors might be far more advantageous to survivors than the general population. Nonetheless, there have been few empirical studies paying attention to the mediating role of psychosocial factors in the SES-health behavior gradient in the cancer context (10, 28).
2. Objectives
In this study, we attempted to explore the impact of SES on health behaviors in BC survivors as well as identifying the role of stress, self-efficacy, and social support as mediating factors. We hypothesized that the SES impact on both exercise and F & V consumption could partly be explained by psychosocial mediators. We also hypothesized that the average exercise and F & V consumption of survivors would fairly be higher than the general population. Another hypothesis was that even though the diagnosis of a life-threatening disease might be a teachable moment and lead to tremendous lifestyle changes in survivors, the impact of SES on survivors’ lifestyles remains significant. In other words, the effects of SES on health behaviors cannot be completely overcome.
The present study fills a gap in the existing literature; to our knowledge, our study is the first to examine the intermediary role of psychosocial factors in the SES-health behavior gradient in BC survivors. The results of the current study can inform future studies and psychosocial empowerment interventions; enhancing psychosocial factors could potentially buffer the effects of social inequalities on health habits in socioeconomically disadvantaged survivors.
3. Methods
3.1. Study Design and Participants
The data were collected by telephone interviews from 196 BC survivors (from the initial 235) admitted to the Cancer Research Center of Shahid Beheshti University of Medical Sciences from March 2014 to February 2015. Patients’ information were retrieved from medical records. The participants were selected randomly from the patients’ list, and Krejcie and Morgan table was used for determining the sample size. The questionnaire comprised 97 questions and was administrated in Farsi. The inclusion criteria were as follows: (1) age > 18; (2) minimum 6 months interval between the primary treatment and the interview; (3) absence of serious disability and mobility impairments; (4) no previous mental illness history; and (5) absence of secondary or reoccurring cancer. All patients had gone under surgery and had been treated by either or both chemotherapy and radiotherapy. The oral consent was obtained by two trained interviewers, reading an approved written script to the participants, and briefly explaining the purpose of the study, how they have been selected, and the estimated time of the interview. After ensuring that the participants adequately understood the objectives of the study, they began the interview. Obtaining written consent was not feasible since participants were reachable only by phone. This study was derived from a master’s degree thesis submitted to the Faculty of Social Sciences of the University of Tehran and was approved by the Sociology Department, which was approved by the Ethical Committee of University of Tehran Research.
3.2. Measures
3.2.1. Socioeconomic Status
The data were measured by family income and educational attainment level. Family income was defined as the combined income of the family from all resources classified in 4 categories: less than 10 million, between 10 and 20, between 20 and 40, and more than 40 million Iranian rials. Educational attainment was initially categorized into 7 categories and, for statistical analysis, was reclassified into three categories.
3.2.2. Leisure-Time Physical activity
Leisure-time physical activity (LTPA) was measured by the exercise section of the Behavioral Risk Factor Surveillance system (BRFSS) 2013 (29). We used recommended guidelines from the Centers for Disease Control and Prevention (CDC) and The American College of Sports Medicine (ACSM) for adequate weekly physical activity (30). The recommended level was coded as 1, while below the recommended level was coded as 0. Reliability was calculated, using Cronbach’s alpha (α = 0.61).
3.2.3. F & V consumption
F & V consumption was measured by the BRFSS. The measurement of the F & V consumption was initially based on the American Cancer Society Guidelines, recommending 5 or more F & V servings per day (29). The recommended level was coded as 1, while below the recommended level was coded as 0 (α = 0.53).
3.2.4. Self-Efficacy
Self-efficacy was assessed by the brief version of the Self-Efficacy for Exercise scale developed by Sallis et al. (31) (α = 0.93).
3.2.5. Stress
3.2.6. Social Support
3.3. Data analysis
Descriptive statistics were used to assess the sociodemographic and clinical characteristics of the sample. Eta correlation coefficients were used to assess the relationship between education, family income, stress, social support, and self-efficacy. The associations between education, income, LTPA, and F & V intake were evaluated by one-way ANOVA. After checking for the normality of the distribution and measurement levels, logistic regression was used to examine the relationship between education, income, psychosocial factors, and health behaviors. Data management and analysis were performed, using SPSS 20.0.
4. Results
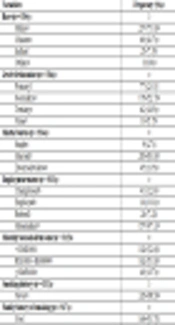
The demographic and health-related characteristics of the study sample were presented in Table 1. The average age of participants was 48.78 (SD = 10.86). Regarding the stage of diagnosis, 35%, 40%, and 23% of the survivors were diagnosed with stage 1, 2, and 3 BC, respectively, and only 2% were diagnosed with stage 4 BC. Regarding the exercise and F & V consumption, 52% and 53% of the survivors complied with the recommended levels. Psychosocial variables’ mean and SD for stress, self-efficacy, and social support were 16.69 (6.36), 24.15 (11.8), and 69.73 (15.68), respectively. Education was negatively associated with stress (η = -0.281) and positivity associated with self-efficacy (η = 0. 251) and social support (η = 0.178). Similarly, there existed a negative association between family income and stress (η = -0.255) and a positive relationship between family income and social support (η = 0.223), but no significant relationship between family income and self-efficacy was observed. Also, self-efficacy was positively related to exercise, whereas a negative relationship existed between stress and exercise; social support exhibited a positive relationship with F & V consumption.
Table 1.
Demographics and Health Care Characteristics
| Characteristic | Total, No. (%) |
|---|---|
| Marital status | |
| Married | 155 (79.1) |
| Bachelor | 18 (9.2) |
| Widowed | 16 (8.2) |
| Divorced | 7 (3.6) |
| Place of living | |
| Tehran | 81 (41.3) |
| Other cities-rural areas | 115 (58.7) |
| Family breadwinner | |
| Yes | 35 (17.9) |
| No | 160 (81.6) |
| Education | |
| Under high school | 64 (32.7) |
| High school diploma | 67 (34.2) |
| College or higher | 65 (33.2) |
| Monthly family income, million (IRR) | |
| < 10 | 39 (20.5) |
| 10 - 20 | 79 (41.6) |
| 20 - 40 | 49 (25.8) |
| > 40 | 23 (12.1) |
| Body mass index | |
| Normal | 50 (25.9) |
| Overweight | 94 (48.7) |
| Obese | 49 (25.4) |
| Health insurance coverage | |
| Covered | 194 (99) |
| Not covered | 2 (1) |
| General health status | |
| Excellent | 14 (7.1) |
| Very good | 32 (16.3) |
| Good | 89 (45.4) |
| Fair | 56 (28.6) |
| Poor | 5 (2.6) |
As for the logistic regression analysis for education and LTPA (Table 2), respondents in the middle and highest-education tertile were physically active. It is apparent in the second model that the relationship between middle-education tertile and physical activity became insignificant. In the third model, the association between the highest-education group and physical activity remained significant. The same regression analysis was employed to examine the relationship between family income and exercise (Table 3).
Table 2.
Logistic Regression Analysis for Education and LTPAa
| Model 1, OR (CI 95 %) | Model 2, OR (CI 95 %) | Model 3, OR (CI 95 %) | |
|---|---|---|---|
| Education | |||
| Lowest | 1 | ||
| Middle | 2.47 (1.17 - 5.20)* | 2.19 (0.99 - 4.84) | 1.82 (0.81 - 4.11) |
| Highest | 5.21 (2.35 - 11.54)*** | 4.01 (1.73 - 9.29)*** | 3.40 (1.44 - 7.99)*** |
| PA self-efficacy | 1.09 (1.046 - 1.14)*** | 1.09 (1.04 - 1.13)*** | |
| Stress | 0.93 (0.99 - 0.86)* |
aModels are adjusted for age and general health status.
Table 3.
Logistic Regression Analysis for Education and F & V Consumptiona
| Model 1, OR (CI 95 %) | Model 2, OR (CI 95 %) | |
|---|---|---|
| Education | ||
| Lowest | 1 | |
| Middle | 2.42 (1.17 - 4.98)* | 2.33 (1.11 -4.87)* |
| Highest | 2.72 (1.28 -5.77)** | 2.28 (1.05 - 4.94)* |
| Social support | 1.03 (1.01 - 1.05)** |
aModels are adjusted for age
The logistics regression for education and F & V intake comprised two models (Table 4). In the first model, education was initially entered into the model and both middle and highest tertiles were positively associated with consumption of F & V. Inserting social support to the second model, both education tertiles retained their significant relationship with the F & V intake. Social support was also associated with F & V intake. A similar regression analysis was employed to assess the relationship between family income and F & V intake (Table 5).
| Model 1, OR (CI 95 %) | Model 2, OR (CI 95 %) | Model 3, OR (CI 95 %) | |
|---|---|---|---|
| Family income | |||
| Low | 1 | ||
| Middle | 1.92 (0.83 - 4.45) | 1.64 (0.68 - 3.95) | 1.49 (0.61 - 3.66) |
| High | 2.98 (1.2 - 7.42)* | 1.95 (0.76 - 5.40) | 1.75 (0.66 - 4.68) |
| Very high | 6.17 (1.88 - 20.23)*** | 5.10 (1.49 - 17.48)** | 4.12 (1.18 - 14.42)* |
| PA self-efficacy | 1.09 (1.05 - 1.14)*** | 1.09 (1.04 - 1.13)*** | |
| Stress | 0.92 (0.99 - 086)* |
aModels are adjusted for age and general health status.
bLTPA is leisure-time physical activity
Table 5.
Logistic Regression Analysis for Family Income and F & V Consumptiona
| Model 1, OR (CI 95 %) | Model 2, OR (CI 95 %) | |
|---|---|---|
| Family income | ||
| Low | 1 | |
| Middle | 1.66 (0.74 - 3.72) | 1.54 (0.68 - 3.53) |
| High | 3.25 (1.32 - 7.99)* | 2.73 (1.09 - 6.87)* |
| Very high | 5.13 (1.62 - 16.22)** | 4.26 (1.32 - 13.76)* |
| Social support | 1.03 (1.01 - 1.05)** |
aModels are adjusted for age.
5. Discussion
The present study aimed at investigating the nature of the relationship between SES and LTPA and F & V consumption among BC survivors. To do so, we argued that BC survivors are more active than the general population and adhere more to the recommended F & V consumption than individuals without cancer. We also argued that SES effects on health behaviors are partially explained by mediating psychosocial factors, namely stress, self-efficacy, and social support.
5.1. Health-Related Behaviors
In this study, roughly half of the survivors reported engaging in some type of physical activity. The level of participation in LTPA varies from 20% to 72.5% in different studies (20, 38, 39). Also, more than half of the survivors complied with the recommended F & V consumption level. Regarding both health habits, the reported levels in survivors were remarkably higher than the levels reported by Iran’s general population. This confirms our hypothesis on significant differences in the level of activity and healthy diet between survivors and the general population (40, 41).
5.2. Socioeconomic and Psychosocial Factors Related to Health Behaviors
Both education and family income were predictors of exercise in survivors. However, education was a stronger predictor. Our findings were consistent with previous research (39, 42, 43). As for F & V consumption, those with higher education and family income were more likely to consume F & V. Similar to exercise, education was a stronger predictor. Other studies have also reached a similar conclusion in the general population (44-46). These findings validate our hypothesis that even after a life-changing event such as cancer, the social class remains a strong predictor of health behaviors in survivors; in our study, only participants in high and very high family income categories were physically active and consumed the recommended level of F & V, whereas middle-income survivors appeared to exhibit the same patterns as low-income families. This denotes that Iranian BC survivors in the middle-income cluster are, to some extent, as vulnerable to economic hardship as low-income groups, and lack the necessary resources to keep up with a healthy lifestyle.
Furthermore, socioeconomic inequalities were observed in all examined psychosocial factors. Education affected both stress and self-efficacy levels, but family income did not show such an impact on self-efficacy. This might be explained by the fact that the majority of participants were homemakers, not the primary breadwinners of the family; this means that the potential benefits of employment and earning income on self-efficacy did not apply to them.
Our findings support our premise that the relationship between both education and family income with LTPA was partially mediated by stress and self-efficacy. Similar findings were reported by other studies (23, 24). We also determined that social support, to some extent, was responsible for education and income disparities in F & V consumption.
Psychosocial factors could be used to mitigate health behavior disparities caused by educational deficits and economic disadvantages. Self-efficacy and social support have been shown to have a direct effect on health behaviors. The authors believe that one feasible solution lies within psychosocial interventions to influence positive health behaviors in cancer survivors. Regarding self-efficacy, less-educated patients should be the primary targets for intervention. Since self-efficacy is one of the key factors in raising exercise levels, interventions to directly promote self-efficacy could be of benefit; boosting self-efficacy appears to be one of the few practical measures capable of enhancing exercise levels in lower-education clusters. However, to date, the majority of research on this subject has solely concentrated on and is limited to providing a descriptive account of existing inequalities without any practical and feasible guidelines for intervention.