


1. Background
Hematopoietic stem cell transplantation (HSCT) is a curative treatment for several malignant and non-malignant disorders including hematopoietic disorders, immunologic abnormalities, and the like (1). HSCT is a common treatment for patients who are at high risk for relapse as well as for patients with genetic disease (2). A disease-free survival (DFS) of 50% or more is the achievement of HSCT: an achievement which has not been realized through other treatments (3). Several factors can affect the outcome of HSCT, such as patient-related factors; moreover, in allogeneic transplantation, and donor factors can influence the results of the transplant. Innumerable studies demonstrated that the individual characteristics factors including the patient’s age, gender, gender adaption between donor and receiver, primary performance, primary disease status, remission status, body mass index (BMI), type of transplantation, type of chemotherapy regimen, type of graft type of malignancy, and the like can influence the survival of patients after HSCT (4-8).
One of the signs of the transplant success is the increase in the number of white blood cells (WBC) after the pancytopenia period, following HSCT. White blood cells include the myeloid and lymphatic system and its recovery after HSCT is associated with better patient survival. An increase or decrease of WBC after the transplantation can represent various conditions, such as infection, relapse, or rejection (9). An increase in the WBC count represents the homing of the stem cells injected into the bone marrow and subsequently recovering the patient’s defective hematopoiesis. This can be affected by several factors such as the condition of the patient’s bone marrow at the time of transplantation and post-transplantation complications including infection, drug toxicity, graft versus host disease (GVHD), and so on (10). In many studies, such as research on hematopoietic malignancies, the researcher is often interested in recording the time of the event (complete recovery or death) and repeated measurements of longitudinal data for each subject. The longitudinal data, such as information on biological markers (white blood cells (WBC), hemoglobin (HB), and platelets (PLT)) can be effective on overall survival. Common models such as the Cox Proportional Hazard model for time-to-event, the linear mixed model, and the GEE method for longitudinal data do not consider dependency between 2 various data types (time to the event and longitudinal). Therefore, a powerful method for analyzing such data is using a joint model which includes 2 longitudinal and survival sub-models and dependence between 2 sub-models (the longitudinal biomarker and time to event) through a latent variable incorporated into the survival model. Ignoring dependency between the 2 models and the use of separate models for longitudinal and time-to-event data often leads to fewer efficiency estimates compared with a joint model.
The Frequentist and Bayesian are 2 approaches to inferential statistical methods. The Frequentist approach is based on maximum likelihood estimators (MLE). However, there are situations where calculating MLE is complicated or the sample size is small. A powerful approach to solve these problems is the Bayesian approach. The Bayesian approach combines data and external information or prior distribution via Bayes theorem, to produce the posterior distribution that is used to make all inferences about the estimate of the parameter. If the prior distribution is weakly defined, the posterior distribution will be heavily weighted in data, and if the prior distribution is strongly defined, then data will have little impact. Furthermore, when the sample size is large, posterior distribution will be more heavily affected by the data (11).
2. Objectives
This study used a joint model to estimate the parameters, leading to more accurate estimates than the separate model in longitudinal and time-to-event data. Also, the study determined the dependency between longitudinal and survival models, using a latent variable.
3. Methods
This is a retrospective cohort study in which 395 patients with hematologic malignancies received bone marrow transplantation in Taleghani Hospital, Shahid Beheshti University of Medical Sciences, Tehran, Iran between April 2007 and March 2015 and were followed till September 2017.
Data gathering was performed, using the patient’s medical records through a predetermined checklist including patient age, gender, type of malignancy, body mass index (BMI), type of graft, and number of pre-transplantation relapses. Furthermore, to determine the survival time (alive or dead) of the patients, phone interview was performed with the permission of both the hospital and the patients. Those who did not experience the event of interest (death) were considered as right- censored. Out of 395 patients, 23 (0.058%) patients did not answer phone which were excluded from the study.
These patients were classified into 5 groups: Multiple myeloma (MM), Non-Hodgkin’s lymphoma (NHL), Hodgkin’s disease (HD), Acute myeloid leukemia (AML), and Acute lymphocytic leukemia (ALL), whose bloods were repeatedly tested for complete blood count (CBC) within 75 days after transplantation, and white blood cell (WBC) counts were recorded every day.
This study was approved by the Ethics Committees of the Shahid Beheshti University of Medical Science, Tehran, Iran. (no.: IR.SBMU.RETECH.REC.1397.656).
3.1. Statistical Analysis
In this study, a joint effect model, including survival and longitudinal models was used to examine the effects of independent variables on patient survival. A joint model consists of 2 basic sub-models: longitudinal sub-model and survival sub-model. The longitudinal sub-model is a mixed model for a longitudinal biomarker including a linear model with random effects:
Yij = Xij + ɛij
Where denotes subject and subscript j denotes jth measurement time in longitudinal sub-model. So Yij is the observed outcome for the ith subject at the jth time. The quantity ɛij is a random error term that is assumed to have a normal distribution. Xij is longitudinal marker so Xij = u1i + βZi. The u1i is assumed to be random effect and has a normal distribution and is covariate effect on longitudinal marker. The survival sub-model is defined as a proportional hazard model:
h(t) = h0(t) exp (γXij + αZi)
Where h0(t) is Weibull distribution and α is covariate direct effect on survival time and the parameter is the measure of the dependence between longitudinal biomarker and time-to-event (12).
Due to the complexity of maximum likelihood estimation (MLE), the estimation of parameters was done through Bayesian inference using the Monte Carlo Markov chain (MCMC). Data analysis was done, using the Win Bugs software. Also, the Kaplan-Meier method was used to calculate the distribution of overall survival (OS).
4. Results
In the present retrospective cohort study, the data of 395 individuals who received HSCT were used, with 42.3% of males and 57.7% of females with a mean BMI of 25.5 ± 8.4. The mean age of these patients was 38 ± 13.93, ranging from 6 to 68 years old and 16.2% had experienced a relapse of disease before transplantation. The frequency with those with none-relapse was higher among the female gender in autograft and multiple myeloma (MM).
The frequency distribution of subjects based on gender, number of pre-transplantation relapses, type of graft, and type of malignancy are presented in Table 1.
| Variable | No. (%) |
|---|---|
| Gender | |
| Male | 167 (42.3) |
| Female | 228 (57.7) |
| Relapse | |
| None | 331 (83.8) |
| One | 57 (14.4) |
| Two | 4 (1) |
| Three | 3 (0.7) |
| Malignancy | |
| MM | 134 (33.9) |
| NHL | 48 (12.2) |
| HD | 124 (31.4) |
| AML | 56 (14.2) |
| ALL | 33 (8.4) |
| Type of graft | |
| Auto | 301 (76.3) |
| Allogeneic | 94 (23.7) |
| Total | 395 (100) |
Frequency Distribution of Subjects Based on Qualitative Variables
The median survival time was 2673 days (7 years and 118 days) where 81 (21.5%) patients died till the end of the follow-up period. The overall survival rate for different malignancies within years 1 to 7 is shown in Table 2.
| Overall Survival, y | Malignancy | ||||
|---|---|---|---|---|---|
| MM | ALL | AML | NHL | HD | |
| 1 | 0.946 | 79.5 | 80.4 | 85.1 | 92.9 |
| 2 | 0.899 | 52.3 | 77.4 | 74.6 | 88.7 |
| 3 | 0.811 | 49.5 | 68.7 | 71.1 | 84.5 |
| 4 | 0.764 | 41.8 | 68.7 | 63.2 | 82.2 |
| 5 | 0.736 | 41.8 | 68.7 | 63.2 | 79.3 |
| 6 | 0.67 | 41.8 | 68.7 | 63.2 | 77.6 |
| 7 | 0.62 | 41.8 | 68.7 | 63.2 | 77.6 |
Distribution of the Overall Survival Rate of Patients
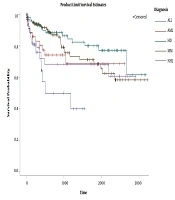
The Kaplan Meier survival probability at any point in time for various malignancies manifested that patients with HD had the highest survival time and ALL-malignancy ones had the lowest survival time (Figure 1).

Survival probabilities for different malignancies after BMT
The results of the “fitting the survival sub-model” in the joint effect model indicated that the variables of the number of relapses before transplantation, age, and type of malignancy proved to be significant, in a way that as the number of relapses increased, the risk of death became greater by 64% (HR = 1.64 CI: (1.09, 2.4)) and as the age increased, the risk of death became greater than 2% (HR: 1.02 CI: (1,002, 1.04)). The risk of death for patients with NHL diagnosis was 0.66 times lower than those with ALL diagnosis (HR: 0.33 CI: (0.152, 0.73)). Moreover, the death risk for patients with AML diagnosis was 0.38 times lower than patients with ALL diagnosis (HR: 0.62, CI: (0.29, 0.7)). In the longitudinal sub-model, the time, BMI, gender, relapse rate before transplantation, and type of malignancy were recognized as significant in the joint model. For a one-unit increase in time (day), the average number of WBC increased (mean: 1.03, CI: (1.034, 1.039)). With the increase in BMI, the average WBC count increased (mean: 1.015, CI: (1.004, 1.033)). In addition, in the patients with NHL (mean: 1.82, CI: (1.24, 2.69)) and HD (mean: 1.75, CI: (1.28, 3.45), the mean increase in the WBC was 1.82 and 1.75, respectively, compared to patients with ALL. The average WBC count after transplantation was 1.09 times more for males than females (mean: 1.09, CI: (1.071, 1.278)) and by increasing the number of relapses before transplantation, the average number of WBC decreased to 0.998 after transplantation (mean: 0.998, CI: (1.019, 1.210)). In the joint model, the communication parameter, which is a criterion for measuring the dependence between the 2 longitudinal responses and survival, was measured as negative, representing an inverse relationship between the longitudinal response and survival (exp (-0.51) = 0.6, CI: (0.0802, 0.37)), in a way that as the number of WBC in the blood increased after the transplant, the risk of death in these patients was reduced by 40%. The standard errors of the parameters were used for comparing the efficiency of the joint model with the separated survival and longitudinal models. By comparing the standard errors (SE) in Table 3, as can be seen, it is concluded that the standard error in the Joint model is less than that of the separate model, suggesting that the joint model is more accurate in estimation parameters compared to the separate model. The results of the separate and joint models with the Bayesian approach are presented in Table 3.
| Parameter | Separate Analysis | Joint Analysis | ||||
|---|---|---|---|---|---|---|
| HR | SE | 95% CI | HR | SE | 95% CI | |
| Longitudinal Model | Longitudinal Sub-model | |||||
| Intercept | 5.793a | 0.004 | (4.96, 6.70) | 6.572a | 0.002 | (6.02, 7.14) |
| Time | 1.92 | 0.007 | (0.96, 6.95) | 1.034a | 0.0002 | (1.03, 1.03) |
| Age | 1.005 | 0.0005 | (0.99, 1.01) | 1.008 | 0.0004 | (0.99, 1.00) |
| Gender | ||||||
| Male | 1.39a | 0.0012 | (1.09, 1.78) | 1.09a | 0.008 | (1.07, 1.27) |
| Female (ref) | - | - | - | - | - | - |
| Malignancy | ||||||
| MM | 1.33 | 0.0027 | (0.80, 2.17) | 2.37 | 0.0017 | (0.951, 1.30) |
| NHL | 1.64 | 0.0029 | (0.34, 1.05) | 1.84a | 0.0019 | (1.22, 2.69) |
| HD | 1.3 | 0.0025 | (0.46, 1.20) | 1.75a | 0.0016 | (1.28, 3.45) |
| AML | 1.282 | 0.0028 | (0.75, 2.196) | 2.05 | 0.0018 | (0.95, 1.28) |
| ALL (ref) | - | - | - | - | - | - |
| Relapse | ||||||
| Yes | 1.08a | 0.0014 | (1.22, 1.44) | 0.998a | 0.0001 | (1.01, 1.21) |
| BMI | 1.022 | 0.0001 | (0.99, 1.049) | 1.015a | 0.0001 | (1.00, 1.03) |
| Type of graft | ||||||
| Auto | 1.198 | 0.0001 | (0.91, 1.58) | 1.135 | 0.0001 | (0.09, 1.37) |
| Allogeneic | - | - | - | - | - | - |
| Survival Model | Survival Sub-model | |||||
| Intercept | 0.004 | 0.0007 | (0, 0.002) | 0.003 | 0.005 | (0.00, 0.015) |
| Age | 1.02a | 0.00014 | (1.00, 1.05) | 1.02a | 0.0001 | (1.00, 1.04) |
| Gender | ||||||
| Male | 0.83 | 0.0024 | (0.51, 1.34) | 0.87 | 0.002 | (0.53, 1.43) |
| Female (ref) | - | - | - | - | - | - |
| Malignancy | ||||||
| MM | 0.39 | 0.0042 | (0.39, 1.05) | 0.276 | 0.003 | (0.20, 1.14) |
| NHL | 0.27a | 0.0048 | (0.10, 0.54) | 0.33a | 0.004 | (0.15, 0.73) |
| HD | 0.58 | 0.0045 | (0.23, 1.52) | 0.6 | 0.003 | (0.26, 1.42) |
| AML | 0.29a | 0.0046 | (0.10, 0.12) | 0.62a | 0.004 | (0.29, 0.7) |
| ALL (ref) | - | - | - | - | - | - |
| Relapse | ||||||
| Yes | 1.609 | 0.0022 | (1.06, 2.30) | 1.64a | 0.002 | (1.09, 2.40) |
| BMI | 0.97 | 0.0027 | (0.91, 1.02) | 0.97 | 0.0002 | (0.92, 1.02) |
| Type of graft | ||||||
| Auto | 0.98 | 0.0002 | (0.58, 1.71) | 0.88 | 0.0005 | (0.26, 1.78 |
| Allogeneic | - | - | - | - | - | - |
| γ | - | - | - | 0.002 | (0.08, 0.37) | |
Separate and Joint Bayesian Analysis
5. Discussion
The goal of this study was to assess the effect of factors on survival time among patients undergoing hematopoietic stem cell transplantation using the joint model. Based on the results, age, type of malignancy, and relapse of the disease before transplantation had a significant effect on the patient’s survival in the joint model. Furthermore, the link parameter indicated a negative association between the 2 longitudinal responses (WBC) and death risk, in a way that, increasing the longitudinal marker reduced the risk of death.
Immunity system deficiency following HSCT (which is due to cytoreductive conditioning regimens) can complicate this procedure, with its success relying on the robust recovery of the myeloid and lymphoid hematopoietic system. Immunity system recovery in post-transplantation and increase in the total number of immune cells is critical for clinical outcomes after HSCT. Mutually, several factors can influence the extent and duration of immune deficiency including age, BMI, the intensity of conditioning regimen, etc. WBC count is a simple, yet independent prognostic marker after bone marrow transplantation, as with the usual WBC increase after HSCT, patients’ life span increases (9). WBC count consists of both myeloid and lymphoid parameters and can indicate fluctuations of the immune system in response to several circumstances such as inflammation, relapse, infection, etc. To study the factors affecting the survival of patients with cancer, most studies used a Cox model without a longitudinal marker or consider longitudinal marker as a time-dependent covariate in the Cox model (12). In this study, for the purpose of estimating the parameters accurately, the joint model was used, and the association parameter of the relationship between longitudinal and survival models entered through the random intercept. This relationship proved to be significant so that for one-unit increase in the logarithm of the WBC count, the risk of death decreased by 40%. Various studies support the assertion of rapid lymphocyte recovery as an effective factor for survival after HSCT (13-20). Similarly, Kim et al. showed that low or high WBC count in the first 3 months after HSCT was associated with poor OS and PFS (9). Contrary to the data of the present study, they asserted that leukocytosis early after HSCT may be due to transplant-related complications such as infection, corticosteroid therapy for GvHD, etc.; thus, high WBC count can reduce patients’ OS. This controversy may be due to a smaller sample size as well as a shorter follow-up period in the present study. In addition to WBC count, numerous risk factors affect outcome after transplantation with allogeneic hematopoietic stem cells. The comparison between the genders in the joint model showed that the risk of death in males is lower than that of females, while in some other studies, the risk of death in males was higher than in females, which could be due to the more number of females in the present study (21, 22).
Age is an important factor in the survival of patients after HSCT. The findings of the present study were in line with other studies as age proved to increase the risk of death in patients (21, 23-26). Contrary to the data of the present study, some studies with a variety of hematologic malignancies indicated no impact of age on overall survival, non-relapse mortality (NRM), and other outcomes of Allo-HSCT (27, 28). However, several centers have shown an increased risk of NRM after auto-HSCT in older patients (29-34). The majority of the data concerning the outcomes of HSCT in older patients is derived from MM patients; however, studies in older patients with lymphoma who underwent auto-HSCT did not show inferior survival; accordingly, this highlights that age should be considered in combination with other factors (35). Many pre-transplant factors considerably affect the treatment outcome. The success of HSCT is profoundly dependent on the remission status of the disease at the time of transplantation (7, 36-39). Better outcome has been demonstrated in patients transplanted in the first or second remission (40-42). The extent of the underlying disorder and its sensitivity to chemotherapy strongly affect the result of HSCT. The frequent relapse of the underlying condition can cause acute bone marrow injury due to exposure to toxic agents and influence the recovery of the hematopoietic system that is crucial for the desirable outcomes. Consistent with these findings, the present data showed higher numbers of disease recurrence pre-transplantation which were associated with reduced OS in patients. The importance of BMI before bone marrow transplantation is somewhat controversial (43). Previous studies have shown that obesity (BMI > 35) is a proprietary index in cellular transplantation, with an increased risk of death as a non-recurrence variable (44, 45), which was not found as significant in the joint model. It seems that the average BMI of individuals plays a crucial role. Previous studies have shown that the average BMI in the United States and Japan was 28 and 22, respectively (43). In the present study, the BMI of the participants was 25.4 and a mere 18 patients had BMI > 35. Autologous and allogeneic HSCT are considered according to primary disorder, disease status, comorbidities, etc. The type of transplantation is effective in the survival of patients after BMT; the patients who had Auto-transplantation showed higher survival rates. In this study, the risk of death for patients who received auto-transplant was 22% lower than those who received allogeneic transplants, which was reported as 21% in another study (46), although this variable was not significant in the joint model. Due to its retrospective nature, the limitations of this study can be seen in the presence of missing data and patients’ incomplete records. Conducting prospective studies with effective blood factors is suggested.
5.1. Conclusions
The result of this study indicated the median survival time for the patients with hematologic malignancy; furthermore, it was revealed that age, relapse before transplantation, type of malignancy, and increase in WBC have survival time after transplantation in patients undergoing hematopoietic stem cell transplantation.
