1. Background
Central nervous system (CNS) lymphoma is a rare non-Hodgkin’s lymphoma that can be divided into primary and secondary groups (1). Primary CNS lymphoma is defined as the presence of disease in the CNS, without systemic involvement at the time of diagnosis, and accounts for 80% to 90% of all CNS lymphoma cases, 5% of all brain tumors, and 1% of non-Hodgkin’s lymphoma cases (2). In contrast, secondary CNS lymphoma, including lesions in both the CNS and other organs at the time of diagnosis, often occurs 5-12 months after the diagnosis of systemic lymphoma (2). CNS lymphoma presents as the dense infiltration of tumor cells in the perivascular space and blood-brain barrier disruption, on histopathological examination (3). Ki-67 expression has been significantly correlated with tumor proliferation and is considered to be a prognostic factor (4-6).
Diffusion-weighted imaging and perfusion-weighted imaging can be used to assess the tumor cell density and angiogenesis, and providing important information for the diagnosis and treatment planning of intracranial tumors. CNS lymphoma generally presents low values for the apparent diffusion coefficient (ADC) and relative cerebral blood volume (rCBV), due to hypercellularity and the absence of angiogenesis characteristics (7-9). Moreover, the correlation between ADC values and the Ki-67 proliferation index may represent an additional noninvasive indicator for use in the diagnosis and prognosis of CNS lymphoma (10).
A previous study has reported increased ADC values in response to tumor cell proliferation inhibitors (11). However, studies examining the correlation between ADC values and the Ki-67 proliferation index are limited (10, 12). In addition, few studies have examined the correlation between rCBV values and the Ki-67 proliferation index in CNS lymphoma, although several studies have examined this correlation for other intracranial tumors (13, 14).
2. Objectives
This study aimed at analyzing the correlations between ADC and rCBV values and the Ki-67 proliferation index in CNS lymphoma.
3. Methods
3.1. Study Population
From August 2019 to March 2020, 26 patients (14 men and 12 women, aged 18 to 82 years, with an average age of 58 years) who underwent biopsy or surgery at Viet Duc and National Cancer hospitals, with the histopathological confirmation of CNS lymphoma, were included in this retrospective study. The patients underwent magnetic resonance imaging (MRI), with results showing intracranial masses, with solid portions larger than 10 mm in diameter. Diffusion acquisitions were performed in 26 examinations, and perfusion acquisitions were performed in 10 examinations. Immunohistochemistry results for the Ki-67 proliferation index were available for all cases. We did not collect patients diagnosed as CNS lymphoma without histopathological findings and treated by chemotherapy before MRI scanning. Ethical clearance received from the institute ethics committee (Ref: 2967/QĐ-DHYHN), with a waiver of informed consent.
3.2. Imaging Technique
The MRI examinations were conducted on 1.5 Tesla Siemens Avanto (Siemens Medical Systems, Erlangen, Germany), 1.5 Tesla Hitachi Echelon (Hitachi Medical Corporation, Tokyo, Japan), 1.5 Tesla Philips Ingenia (Philips Healthcare, Best, Netherlands), and 3.0 Tesla GE SIGNA Pioneer (GE Healthcare, Chicago, IL, USA), using a head coil. The conventional sequences included: non-enhanced axial or sagittal T1-weighted images, axial fluid-attenuated inversion recovery (FLAIR) images, axial T2 gradient-echo images, contrast-enhanced T1 volumetric images, reconstructed in the axial, coronal, and sagittal planes.
Axial diffusion-weighted images, with 2 b-values of 0 and 1,000 s/mm2, were performed with the following parameters: 240-mm field of view (FOV), 5-mm slice thickness, repeat time (TR)/echo time (TE): 4,500/102 ms, and matrix: 192 × 192. ADC images were automatically calculated.
Perfusion acquisition was performed before contrast-enhanced T1 volumetric acquisition. The T2 gradient-echo echo-planar sequence was used with the following parameters: 230 × 230-mm FOV, 5-mm slice thickness, TR/TE: 500/40 ms, matrix: 144 × 256, and 1-mm slice spacing. A dynamic series of 10 sets, with a 1-s delay between each set, was acquired, and the first 3 sets were acquired before contrast injection. A bolus of contrast agent, at a dose of 0.1 mmol/kg (Dotarem, Guerbet, France) and a rate of 5 mL/s, was administrated using a power injector through an 18-20 G intravenous catheter, during the fourth set. Afterward, a bolus of 20 mL saline was immediately injected, at the same rate.
3.3. Image Analysis
The ADC and CBV values were independently analyzed on a Ziostation 2 version 2.9.7.2 (Ziosoft Inc, Tokyo, Japan), by 2 senior radiologists. The Ki-67 proliferation index was blinded. Any disagreement between the 2 investigators was solved by consensus. For multifocal lesions, the ADC, CBV, and Ki-67 proliferation index values were all measured and counted on the same lesion.
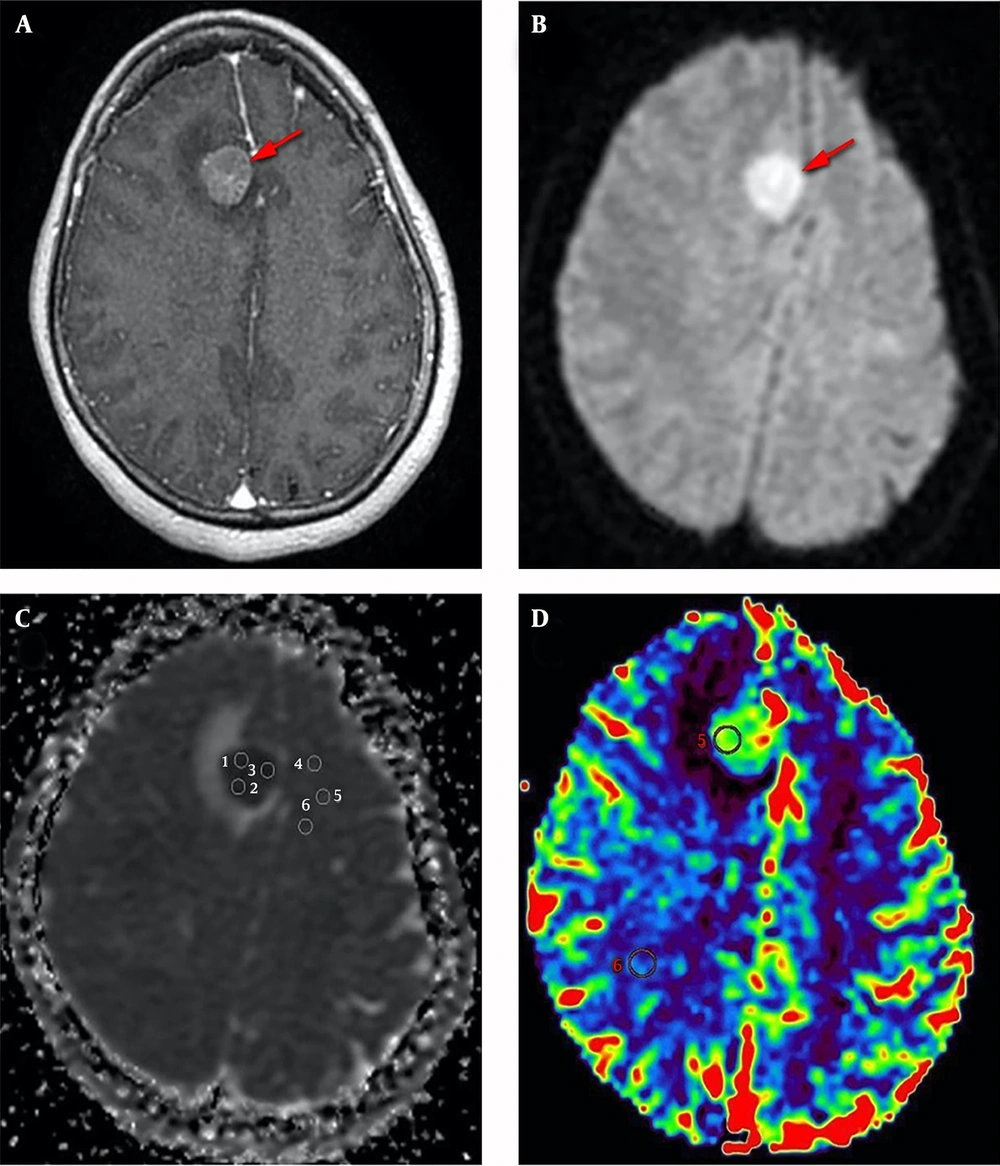
On the ADC map, the ADC values were evaluated by drawing a 10-20-mm2 region of interest (ROI) within the solid portion of the tumor, taking care to avoid necrotic, hemorrhagic, cystic, or calcific areas and blood vessels, and tumoral ADC (tADC) and relative ADC (rADC) values were calculated. The tADC value was calculated as the average of 3 ROIs placed within the solid portion that showed the lowest signal on the ADC map (Figure 1). The mean ADC value of the opposite white matter was calculated as the average of 3 ROIs placed within the normal white matter, at the same level as the tumor (Figure 1). The rADC value was calculated as the ratio between the values of the tADC and the mean ADC of the opposite white matter.
A 62-year-old female with right frontal secondary CNS lymphoma. An axial, contrast-enhanced, and T1-weighted; image (a) shows a homogenous enhancement (arrow). An axial diffusion-weighted image, with b-values of 1,000 s/mm2 (b), shows a homogenous hyperintensity. ADC map (c) shows 3 ROIs were placed within the lowest signal area of the mass, and 3 additional ROIs were placed within the opposite normal white matter. CBV map (d) shows an ROI was placed within the most vascular proliferative area of the mass, corresponding to the highest color spectrum, and another ROI was placed within the normal white matter.
On the CBV map, the tumoral CBV value was evaluated by placing a 10-20 mm2 ROI within the most vascular proliferative area, corresponding to the highest color spectrum, and avoiding large vessels and the choroid plexus. In the control area, the ROI was placed within the normal white matter, at the same level as the tumor (Figure 1). rCBV was calculated as the ratio between the tumoral CBV and the CBV in the control area.
3.4. Statistical Analysis
SPSS version 20.0 software was used to analyze data (IBM Corp, New York, USA). Quantitative variables are described as the mean and standard deviation. Categorical variables are described as the number and percentage. The correlations between the tADC, rADC, rCBV, and Ki-67 proliferation index were determined using the Spearman rank correlation test, with the level of significance set to P < 0.05.
4. Results
4.1. Study Population
Overall, multifocal lesions (65.4%) were more common than unifocal lesions (36.6%). Primary CNS lymphoma was identified in 18 (69.2%) patients, and secondary CNS lymphoma was found in 8 (30.8%) patients.
The average lesion size was 32.88 ± 12.7 mm (13-47 mm). Diffusion restriction was detected in all cases. The mean tADC value was 0.61 ± 0.12 × 10⁻³ mm2/s (0.41-0.90 × 10⁻³ mm2/s). The mean rADC value was 0.73 ± 0.14 (0.46-1.04). The mean rCBV value was 1.1 ± 0.32 (0.60-1.75).
4.2. Histological Characteristics
Non-Hodgkin’s lymphoma was identified in all cases, including 25 cases with diffuse large B-cell lymphoma and 1 case with small lymphocytic lymphoma. All samples were positive for Ki-67, with a mean proliferation index of 65.96 ± 18.0% (ranging from 20% to 90%).
4.3. Correlations Between the tADC and rADC Values and the Ki-67 Proliferation Index Values
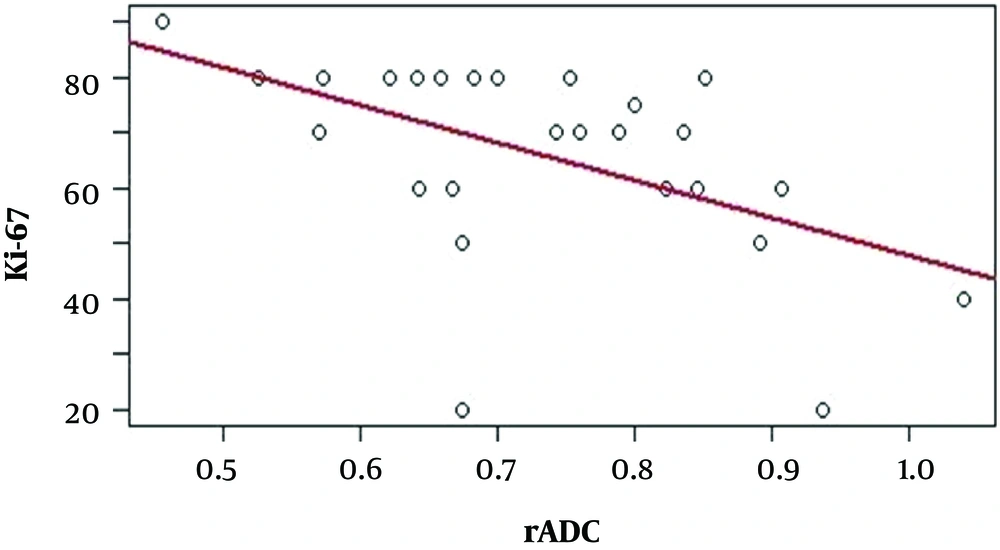
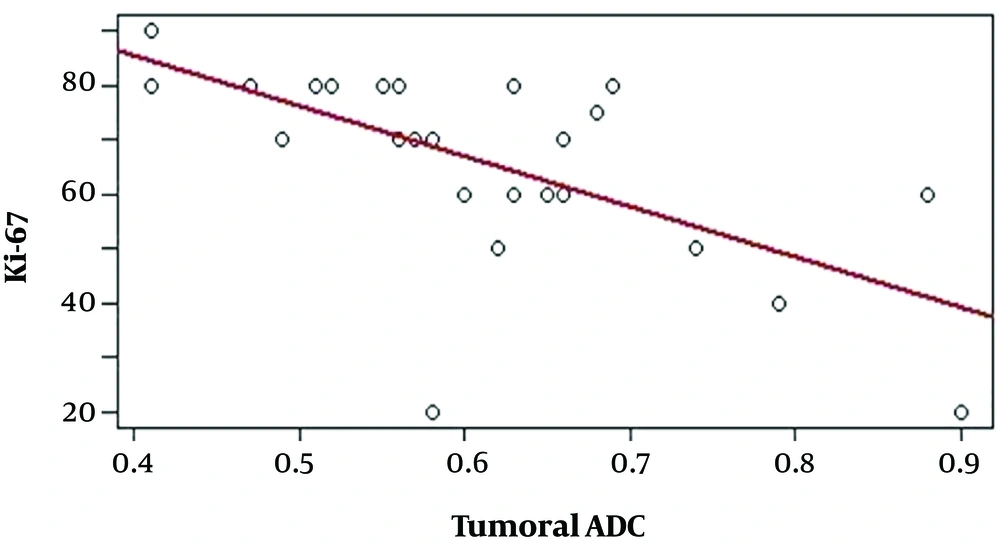
All 26 cases, with available tADC, rADC, and Ki-67 proliferation index data were used to analyze the correlations among these values, which are presented in Table 1. Negative correlations were identified between the tADC value and the Ki-67 proliferation index (r = -0.656, P < 0.01) (Figure 2) and between the rADC value and the Ki-67 proliferation index (r = -0.540, P < 0.01) (Figure 3), indicating that lower tADC and rADC values are associated with increases in the Ki-67 proliferation index.
| Spearman's rho | P Value | |
|---|---|---|
| tADC and Ki-67 | -0.656 | < 0.001 |
| rADC and Ki-67 | -0.540 | 0.004 |
4.4. Correlations Among the tADC, rADC, and rCBV Values and the Ki-67 Proliferation Index
We analyzed 10 cases with available tADC, rADC, rCBV, and Ki-67 proliferation index data to determine the correlations among these values, which are presented in Table 2. No significant correlations were identified between the rCBV value and the Ki-67 proliferation index (r = 0.117, P > 0.05), between rCBV value and the rADC value (r = -0.139, P > 0.05), or between the rCBV value and the tADC value (r = -0.097, P > 0.05).
| Spearman's rho | P Value | |
|---|---|---|
| rCBV and Ki-67 | 0.117 | 0.748 |
| rCBV and rADC | –0.139 | 0.701 |
| rCBV and tADC | –0.097 | 0.789 |
5. Discussion
Previous research demonstrated the ADC values representing tumor density and proliferation (11). However, experiments exploring the association between the ADC values and the Ki-67 proliferation index in CNS lymphoma were not widespread (10, 12). In addition, the association between rCBV values and Ki-67 proliferation index in CNS lymphoma has been tested in a few reports (13, 14). In this analysis, we noted that no substantial correlations between the rCBV value and the Ki-67 proliferation index were reported, and significantly negative correlations with the ADC parameters and Ki-67 proliferation index in CNS lymphoma were observed.
Previously, CNS lymphoma was found to be strongly associated with immunocompromised states, particularly human immunodeficiency virus (HIV)/acquired immune deficiency syndrome (AIDS). More recently, the increased occurrence of CNS lymphoma has been reported in immunocompetent patients, in both sexes, and across all ages (15). CNS lymphoma tends to occur in the elderly, with a peak incidence among patients 50-70 years in age, in immunocompetent individuals, and in young immunocompromised patients, with a male predominance (1). Our study population presented a similar distribution, with a mean age of 58 years, ranging from 18 to 82 years (the 50-70-year-old age group accounted for 57.7% of our cohort), and a male to female ratio of 1.17:1. Diffuse large B-cell lymphoma represents 95% of all CNS lymphoma cases, and the remainder consisted of low-grade B-cell lymphoma, T-cell lymphoma, and Burkitt lymphoma (1, 16). Based on immunohistochemistry results, CNS lymphoma is characterized by a high Ki-67-positive rate (50%–70%), (17), Chacko et al. (18) in a study of 73 primary CNS lymphomas found that the Ki-67 proliferation index from 60% to 98%. A study by Schob et al. (12) reported a mean Ki-67 proliferation index of 76.19% in 21 primary CNS lymphoma samples. The results of this study, were similar to previous findings, with 25 cases of diffuse large B-cell lymphoma and 1 case of small lymphocytic lymphoma, which is a subtype of low-grade B-cell lymphoma. The Ki-67 proliferative index in the present study varied from 20% to 90%, with an average of 65.96% ± 18.0%, which was lower than that reported by Schob et al. study and more variable than that reported by Chacko et al. This discrepancy may be due to differences in the cell counting process, as Ki-67 positive cells were manually counted in the current study, whereas Schob et al. used an automatic counting tool. In addition, the present study included both primary and secondary CNS lymphoma groups, whereas the studies by Chacko et al. and Schob et al. only included primary CNS lymphoma.
CNS lymphoma often presents with restricted diffusion, with low ADC values during the diffusion acquisition. Previous studies have demonstrated that the ADC values of CNS lymphoma are significantly lower than those for glioblastoma, anaplastic astrocytoma, and metastatic lesions (19-23). The results of Matuszewska1 et al. (24), in a study of 16 CNS lymphomas found in 12 patients, showed that all lesions presented with restricted diffusion, with tADC and rADC values as low as 0.54 × 10⁻³ mm2/s and 0.71, respectively and no significant differences were identified between primary and secondary CNS lymphomas. Lee et al. (19) reported tADC and rADC values as low as 0.595 ± 0.228 × 10⁻³ mm2/s and 0.86 ± 0.26, respectively. The lowest tADC values reported by the studies performed by Yamashita et al. (20), Calli et al. (21), and Neska-Matuszewska et al. (22) were 0.61 ± 0.13 × 10⁻³ mm2/s, 0.51 ± 0.09 × 10⁻³ mm2/s, and 0.57 ± 0.12 × 10⁻³ mm2/s, respectively. Doskaliyev et al. (23) obtained tADC values as low as 0.717 ± 0.094 × 10⁻³ mm2/s and 0.390 ± 0.081 × 10⁻³ mm2/s, with b values of 1,000 and 4,000, respectively. Our study identified a mean tADC value of 0.61 ± 0.12 × 10⁻³ mm2/s, which is comparable to the results reported by Lee et al. (19), Yamashita et al. (20), and Neska-Matuszewska et al. (22); however, this result is higher than those reported by Neska-Matuszewskal et al. (24) and Calli et al. (21) and lower than the result reported by Doskaliyev et al. (23). These disagreements among various studies are likely due to differences in the study populations and ROI settings. Several studies have reported that ADC values are negatively correlated with cell proliferation. Schob et al. (12) found that the lowest, the mean, and the highest ADC values all reflected cell division, based on the positive expression of Ki-67. Jung et al. (10) studied the correlation between rADC values and the positive expression of Ki-67 in 50 patients with primary CNS lymphoma and detected a negative correlation between these 2 values. Our study identified negative correlations between the tADC values and the Ki-67 proliferation index (r = -0.656, P < 0.01) and between the rADC values and the Ki-67 proliferation index (r = -0.540, P < 0.01). According to these results, tADC values are more strongly correlated with Ki-67 expression than rADC values. The ADC values of normal white matter tend to increase with age; therefore tADC values may better reflect tumor cell proliferation (25). Based on this correlation, ADC values can be used as an additional non-invasive predictor of tumor cell proliferation, which can provide additional information for the prognosis and evaluation of chemical treatment responses, particularly among patients treated with cell proliferation inhibitors.
According to previous studies, CNS lymphoma presents with low rCBV values, due to the absence of tumoral angiogenesis (6, 9, 26). In a study of 12 CNS lymphomas, Hartmann et al. (9) reported a mean rCBV of 1.29 ± 0.18, whereas Hakyemez et al. (27) reported a mean rCBV value of 1.1 ± 0.32. In contrast, the rCBV values reported by Lee et al. (8) and Neska-Matuszewskal et al. (24) were 1.68 and 1.58, respectively. Furthermore, Lee et al. (8) and Neska-Matuszewskal et al. (24) found no significant differences between the mean rCBV values measured in primary and secondary CNS lymphoma groups. The mean rCBV in our study was 1.1 ± 0.32 (0.60-1.75), which is similar to those reported by Hartmann et al. (9), Hakyemez et al. (27), Abul-Kasim et al. (26), and Blasel et al. (28) but is lower than those reported by Lee et al. (8) and Neska-Matuszewskal et al. (24). Despite the divergence among study results, several authors have determined that the rCBV values for CNS lymphoma are significantly lower than those for glioblastoma, meningioma, and metastasis (9, 21, 22, 26, 27, 29). The rCBV value has been proven to serve as a valuable indicator for the grading and prognosis of some intracranial tumors, based on studies examining the correlation between rCBV values and the Ki-67 proliferation index. Ginat et al. (14). found a positive correlation between rCBV values and the Ki-67 proliferation index in meningioma and determined that rCBV values can be used to distinguish atypical meningioma from anaplastic meningioma. A positive correlation between these 2 values was also detected in a study of high-grade glioma (13). However, our study showed no correlation between rCBV values and the Ki-67 proliferation index in CNS lymphoma (r = 0.117, P = 0.748). This result may be due to the growth patterns associated with CNS lymphoma, which is characterized by angiotropism or angiocentric phenomena, with the migration of tumor cells along or within blood vessels, which differs from the angiogenesis associated with glioma or meningioma, during which the formation of new blood vessels occurs (14, 29). Although the presence of vascular endothelial growth factor has been reported in CNS lymphoma, angiogenesis appears to independently occur from the proliferation of tumor cells (30, 31). In a histological study of 32 patients with primary CNS lymphoma, Roser et al. (31) found no correlation between vascularity and proliferation.
The present study had some limitations. Firstly, the study included small sample size, particularly for rCBV data. Secondly, primary and secondary CNS lymphomas are different; however, in this study due to the small sample size, we could not perform the comparison of subgroups of lymphoma. Although no correlation was observed between rCBV and ADC values, further studies with larger sample sizes must be performed to validate these findings. Thirdly, the manual counting of Ki-67-positive cells may have affected the final results, and future studies should consider the use of automatic counting. Finally, the investigation of the correlations among rCBV, ADC, and Ki-67 should be performed within subgroups of CNS lymphomas.
5.1. Conclusion
The negative correlations between tADC and rADC values and the Ki-67 proliferation index indicated that these values can be used as non-invasive indicators for the prediction of the degree of cell proliferation occurring in CNS lymphoma. Further studies should be performed to validate the present findings.


