


1. Background
Despite recent advances in diagnosis and treatment of colorectal cancer (CRC), this disease is still classified as a serious gastrointestinal carcinoma, accounting for 551 269 deaths in 2018 (1). The prevalence of CRC was estimated at 33.3% worldwide, and it was classified as one of the top 5 cancers associated with mortality in both men and women. Also, CRC is the third cancer with the highest rate of incidence and the second cancer with the highest rate of mortality (2).
Therapeutic strategies for advanced stages of CRC have led to a 5-year survival rate below 50% in developing countries (3). Since certain prognostic markers allow physicians to select the primary therapeutic strategies (3, 4), the grade of invasion is an informative characteristic that should be recognized as a primary parameter in CRC progression (5). At the beginning of metastasis, lymphatic invasion leads to the migration of malignant cells to lymphatic vessels (6). Therefore, the detection of lymph node involvement and vascular invasion in tumor formation, which was previously described by Goldhisrch in patients with breast cancer, can be incorporated in interventional programs (7).
Growth factors are recognized parameters in cancer progression and development. Fibroblast growth factors (FGFs) are among these important growth factors. FGFs are divided into 3 groups of paracrine, intracrine, and endocrine, which play critical roles in tumor progression, primary tumor development, and tissue repair (8, 9). FGF9, a member of the paracrine family, is mainly secreted by the Homo sapiens glioma cell line and is known as a glia-activating factor (10). FGF upregulation has been discussed and confirmed in various cancers, such as lung, prostate, and gastric cancers (9, 11, 12). For marker selection, archival formalin-fixed, paraffin-embedded (FFPE) tissue samples have been used based on the fresh frozen (FF) specimen reactivity in quantitative real time-polymerase chain reaction (qRT-PCR) assays. Although FF samples are reported to be more reliable for expression experiments, simple collection and storage of FFPE tissues make them a valuable option for molecular investigations (13).
2. Objectives
This study aimed at evaluating lymphatic and vascular invasion during FGF9 overexpression in FF tumor tissues and FFPE specimens based on clinical and pathological data to make comparisons with the normal adjacent tissues and to determine if FGF9 can be considered a prognostic biomarker for CRC stages.
3. Methods
3.1. Study Population
This study was conducted on 80 FF specimens and paired 40 FFPE tissue samples collected from patients, who were referred to Taleghani Hospital affiliated to Shahid Beheshti University of Medical Sciences (Tehran, Iran) for tumor resection surgery, in addition to 80 adjacent non-tumor tissue samples. The specimens were selected by defining adequate RNA extraction in patients without a history of radiotherapy or chemotherapy in their medical reports. Also, 25 normal individuals visiting the gastrointestinal clinic for screening programs were included in this study based on their colonoscopy reports. Patients with a non-CRC cause of death or loss to follow-up were excluded from the study.
The clinicopathological data of the participants were confirmed by two senior pathologists. Ethical approval was obtained from the Medical Ethics Committee of the Department of Cancer Prevention of Research Center for Gastroenterology and Liver Diseases (RCGLD) (code: IR.SBMU.RIGLD.REC.1396.180). Informed consent forms were collected following the Declaration of Helsinki (14). Written informed consent was obtained from all participants, whose information was included in this study. All resected tissues were directly added to liquid nitrogen and stored at -80°C.
3.2. Sample Preparation
RNA extraction from tissue samples was performed by using the TRIzol reagent (Invitrogen, Carlsbad, CA, USA) based on the manufacturer’s protocol. In brief, tissue specimens were homogenized in 1 mL TRIzol reagent. Then, 0.2 mL of chloroform was mixed for protein extraction and 0.5 mL isopropanol was used for precipitation. The quantity and quality with the amount of total extracted RNA were measured by using Nanodrop (Nanodrop Technologies Inc., Wilmington, DE, USA) (15). For FFPE RNA extraction, 10 µm sections of thick blocks were added to 1.5 mL microtubes. For deparaffinization, 1 mL of xylene was added to the tubes for 10 minutes. To confirm complete deparaffinization, xylene was added once again; then, 1 mL of absolute ethanol was added twice for 20 minutes (16). Next, total RNA extraction was performed, using the RNeasy FFPE Kit (Qiagen, Germany). The total extracted RNA density was examined by a Nanodrop system (Thermo Fisher Scientific, Waltham, MA, USA).
3.3. cDNA Synthesis and qRT-PCR Assay
The cDNA was synthesized from 500 ng of mRNA according to the Takara protocols (Takara, Dalian, Liaoning, China). The qRT-PCR assay was conducted in 40 cycles at 94°C for 30 seconds, at 60°C for 30 seconds, and at 72°C for 30 seconds on a retrogene (Applied Biosystems, Foster City, CA, USA) with 1.0 µL of 0.1 diluted and synthesized cDNA and SYBR Green Real-Time PCR Master Mix (Takara, Dalian, Liaoning, China).
The internal controls for normalizing the expression levels included β-globin (forward primer, 5’-TGCTGTCTCCATGTTTAGTGTATCT-3’ and reverse primer, 5’-TCTCTGCTCCCCACCTCTAAGT-3’) and GAPDH (forward primer, 5’-GCTCTCTGCTCCTCCTGTTC-3’ and reverse primer, 5’-ACGACCAAATCCGTTGACTC-3’). Also, the sequence of designed primers using Primer3 for FGF9 was as follows: FGF9 forward primer, 5’-GCAGTCACGGACTTGGATCAT -3’ and FGF9 reverse primer, 5’-TCCAGAATGCCAAATCGGCT-3’).
3.4. Statistical Analysis
The FGF9 mRNA expression was analyzed based on the relative quantification (RQ) by the 2-ΔΔct method. Upregulation was confirmed in patients with RQ above the estimated median, and downregulation was confirmed in patients, whose RQ was below the estimated median. All expression experiments were performed in duplicate. The overall survival (OS) of patients with cancer was determined as the time from the primary diagnosis of cancer until death because of relapse or metastatic outcomes. All data related to the association between FGF9 expression and clinicopathological parameters were measured, using SPSS version 21 (SPSS Inc., Chicago, IL, USA) and Mann-Whitney U test in GraphPad Prism 8.0 (GraphPad, CA, USA). Descriptive analyses were performed to present the data as mean ± standard deviation (SD). The receiver operating characteristic (ROC) curve was also plotted to assess the prognostic value of FGF9 as a biomarker. Moreover, the Kaplan-Meier survival curve was used to determine the effect of FGF9 expression on the mortality rate. The level of statistical significance was set at P < 0.05.
4. Results
4.1. FGF9 Upregulation in CRC Patients
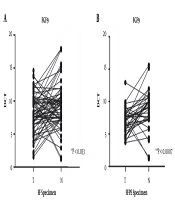
The FGF9 upregulation was significant in FF cancer tissues and FFPE specimens in comparison with the normal adjacent tissue samples from patients with CRC (P < 0.033 and P < 0.0007, respectively) (Figure 1). Nearly 52% of FF samples and 51% of FFPE specimens showed higher FGF9 expression levels than the median level and were categorized in the high-expression group. The rest of the specimens, which showed expression levels under the median level (48% and 49%, respectively), were classified in the low-expression group.
 tissue resected fresh (FF) and (B) paraffined (FFPE) specimens. * Dct, Delta CT; * T, Tumor specimen; * N, ADJ normal specimen.")
Over expression of FGF9 (A) tissue resected fresh (FF) and (B) paraffined (FFPE) specimens. * Dct, Delta CT; * T, Tumor specimen; * N, ADJ normal specimen.
4.2. Association of FGF9 Expression with the Clinicopathological Data
Subsequent analyses of FFPE and FF tissue samples were carried out to define the effects of clinical parameters on CRC progression. A significant association was found between the FGF9 expression in FFPE and FF specimens and tumor, node, metastasis (TNM) stage (P < 0.003 and P < 0.013, respectively), lymph node invasion (P < 0.047 and P < 0.0001, respectively), and vascular invasion (P < 0.047 and P < 0.004, respectively). Other clinical data, such as gender and age were also significant in the FF specimens (P < 0.0052 and P < 0.01, respectively), but not in the FFPE specimens. However, other clinical data, including the tumor size, pathologic tumor differentiation, and involved tumor region showed no significant relationship with the FGF9 expression in the FFPE or FF samples (Table 1).
| Parameters | FFPE Samples, Mean ± SD of RQ | P-Value | FF Samples, Mean ± SD of RQ | P-Value |
|---|---|---|---|---|
| Sex | 0.62 | 0.0052 | ||
| Male | 5.37 ± 4.22 | 0.73 ± 1.002 | ||
| Female | 3.87 ± 3.89 | 0.68 ± 0.66 | ||
| Age | 0.81 | 0.01b | ||
| ≤ 50 | 4.38 ± 4.20 | 0.47 ± 0.52 | ||
| > 50 | 6.26 ± 4.51 | 0.83 ± 0.98 | ||
| Tumor size | 0.71 | 0.56 | ||
| ≤ 5 | 2.84 ± 2.91 | 0.69 ± 0.89 | ||
| > 5 | 6.51 ± 5.00 | 0.96 ± 1.10 | ||
| TNM stage | 0.003b | 0.013b | ||
| I and II | 2.61 ± 2.71 | 0.66 ± 0.72 | ||
| III and IV | 8.25 ± 8.02 | 0.79 ± 1.15 | ||
| Lymphnode metastasis | 0.047b | < 0.0001b | ||
| No (N0) | 2.57 ± 2.76 | 0.10 ± 0.24 | ||
| Yes (N1, N2, N3) | 8.45 ± 8.26 | 0.78 ± 1.17 | ||
| Vascular invasion | 0.047b | 0.004b | ||
| No | 2.85 ± 2.91 | 0.61 ± 0.73 | ||
| Yes | 9.01 ± 9.62 | 0.85 ± 1.25 | ||
| Differentiation | 0.63 | 0.36 | ||
| Well + moderate | 4.75 ± 3.87 | 0.67 ± 0.78 | ||
| Poor | 7.60 ± 6.50 | 0.87 ± 1.03 |
Association of FGF9 Expression with Clinical Parameters in FF and FFPE Specimens of CRC Patientsa
The FGF9 mRNA expression in FF tissue samples and FFPE specimens was measured by the qRT-PCR assay, and the plotted diagram specified the elevated RQ in FF samples versus FFPE samples (Figure 2). Next, a correlation analysis was carried out to determine the r-value. The analysis of correlations clarified the relationship between the two types of samples. The Pearson’s coefficient was estimated at 0 to 1, which shows that variables tended to change together; however, the correlation was not significant (r = 0.06, P < 0.68) (Figure 3).
 and FFPE (Formalin Fix Paraffin Embeded) tissues.")
Log2 expression level of FGF9 compared in FF (Fresh Frozen) and FFPE (Formalin Fix Paraffin Embeded) tissues.

FGF9 expression correlation between FF and FFPE tumoral tissue samples.
4.3. FGF9 Measurement as a Prognostic Biomarker of CRC Stage
The FGF9 expression was determined as a prognostic biomarker by plotting the ROC curve for both types of specimens. The AUC for CRC stages I and II and CRC stages III and IV in terms of FGF9 expression was 72.47% in FF tissue samples with a sensitivity of 78.57% and specificity of 66.67% (P < 0.007). The corresponding AUC in the FFPE samples was 69.38% with a sensitivity of 58.82% and specificity of 78.26% (P < 0.03). Therefore, it can be deduced that FGF9 is a prognostic biomarker for distinguishing the CRC stages. The FF and FFPE specimens were not significantly different according to the ROC curve analysis; however, the FF tissue samples were more sensitive for discrimination of CRC stages (Figure 4).

ROC curve illustrates the prognostic significance of FGF9 in FF samples and paraffin blocks.
4.4. Invasion in Patients with CRC and OS
The expression level of FGF9 was examined concerning OS in all FF and FFPE samples. The results revealed that CRC cases with high expression levels of FGF9 had shorter survival than those with low FGF9 expression (log-rank HR: 2.47; 95% CI: 1.094 - 5.253; P < 0.02). Also, regarding the association between invasion and FGF9 expression, the Kaplan-Meier and log-rank tests were used for patients with lymphatic and vascular metastasis; lack of invasion was reported in paired FF and FFPE samples. The results revealed that OS was remarkably longer in patients with CRC with no invasion, compared to patients with vascular and lymph node metastasis (log-rank HR: 0.32; 95% CI: 0.1151 - 0.9446; P < 0.038) (Figure 5).
 FGF9 expression and (B) Lymphatic and Vascular Invasion")
Kaplan-Meier analysis demonstrates the overall survival of CRC patients according to (A) FGF9 expression and (B) Lymphatic and Vascular Invasion
5. Discussion
In the present study, we evaluated lymph node metastasis and vascular invasion according to the expression level of FGF9 and clinicopathological features, using RT-PCR assays. The results demonstrated that FGF9 overexpression was significant in tumoral FF and FFPE samples in comparison with the normal adjacent tissues and normal controls (data not shown). The FGF9 upregulation in both types of samples was within a similar range. The archived paraffin blocks provided consistent data, which could be used for molecular experiments in retrospective studies.
As shown in Table 1, the upregulation of FGF9 mRNA expression was correlated with a higher stage of CRC, lymph node metastasis, and vascular invasion, which were the main causes of rapid tumor growth in the progression of cancer. In this regard, Ohgino et al. (13) evaluated FGF9 expression in non-small cell lung cancer cells, using immunohistochemistry. The results indicated FGF9 upregulation in only 10% of specimens with poor prognosis. Also, the association of FGF9 expression with the stage of disease and lymph node metastasis was indicated in patients with lung cancer (16, 17). Moreover, a study compared FGF9 upregulation between the samples of patients with prostate cancer and control samples by qRT-PCR assay and Western blotting. The results showed that cancer progression and metastasis both had a relationship with FGF9 expression (18, 19). Also, Jibiki et al. examined the correlation between FGF expression and clinicopathological parameters both serologically and pathologically and found that lymphatic invasion was associated with FGF expression (20).
Based on the molecular analyses, there are major obstacles in the diagnosis and prognosis of CRC, which have not been resolved because of the special nature and characteristics of CRC (21-24). Early detection of CRC can reduce the mortality of this disease, which is one of the deadliest cancers worldwide. Therefore, accurate biomarkers are needed to reduce the late prognosis problem of CRC. In previous studies, FGFs and their dependent pathways were considered appropriate targeted therapy for various cancers (25, 26). In other words, when FGFs were secreted from epithelial cells, growth improvement was observed.
According to the ROC curve for biomarker selection, FGF9 could be considered a major prognostic biomarker with an AUC of 72% in FF samples and 69% in FFPE samples from patients with CRC. To the best of our knowledge, RNA isolation from FF tissue samples can provide extremely reproducible information. Besides, FF samples have been approved for their sensitivity and specificity in molecular experiments. In the present study, we found that the specificity of the FFPE solid base for the measurement of gene expression must be considered, using the traditional RNA extraction and cDNA synthesis methods.
In the present study, the ROC curve analysis showed that both FF tissue samples and FFPE specimens could be used for CRC diagnosis; however, for more sensitive results to distinguish between high and low CRC grades, FF tissues were more beneficial. The FGF9 overexpression and lymphatic and vascular metastasis were significantly associated with the OS rate in patients with CRC (27). In this regard, White et al. conducted an animal survey based on FGF9 upregulation (28). Ohgino et al. (13) also suggested that FGF9 could be considered a candidate driver oncogene; the microarray analysis of FGF9 expression indicated a significant correlation with survival in CRC.
In conclusion, FGF9 upregulation was associated with tumor stage and invasion and led to the rapid development and progression of CRC. For invasion detection, FGF9 could be used as a suitable biomarker to reduce the prognosis time for survival improvement; therefore, FGF9 might be used in routine invasion detection. The findings revealed that archived FFPE specimens could facilitate retrospective studies of intriguing gene expressions in the future.
