


1. Background
Oral cancer is the sixth most common cancer worldwide and is more prevalent in South Asia than anywhere else in the world (1). Tobacco and alcohol use are among the most important etiological factors, and HPV has recently been found that implicated in oral cancer (2). About 75% of oral cancers are related to changeable behaviors such as smoking and excessive alcohol consuming. Other factors include oral hygiene, poor nutrition, and some chronic infections caused by fungi, bacteria, or viruses (3, 4).
This type of cancer may develop as a primary lesion in any of the tissues of the mouth, either by metastasizing from another organ or through an adjacent anatomical structure, such as the nasal cavity (5). Alternatively, oral cancers may occur in any of the oral tissues and may have different histological types including teratoma, salivary gland carcinomas, lymphocytic lymphoma, or oral squamous cell carcinoma (6). The squamous cell carcinomas account for 90% of oral cancers, reaching the mouth and lips and its mortality in 2015 was 146,000 people (4).
Oncogenes are activated by DNA mutations and have been identified as the most important risk factors in oral cancer in epidemiological studies (7). One of the important gene families in the carcinogenic pathways of various cancers is the forkhead box (FOX) family genes. The FOX box protein is an evolutionarily conserved transcription factor (TF) protein family (8). Currently, more than 2,000 members of this TF family are found based on sequence homology, which is widely found in a wide variety of organisms from yeast to humans (9). The FOX protein involves in a wide range of biological processes by gene expression regulation (10). FOXA1 and FOXA2 play important roles in tumorigenesis based on their multiple activities (11, 12). These roles are mainly due to genome instability and mutation, metastasis activation, and sustained proliferative signaling (9). FOXA1 and FOXA2 are also associated with a variety of cancers including liver (11), pancreatic (13), lung (14), and prostate (15). Molecular mediators associated with FOXA family genes act together as central cofactors that control cell growth and normal cell differentiation (16).
The SOX10 gene is one of the oncogenes that has been associated with oral cancer (17) and plays an oncogenic role in cancers such as basal cell, lung, breast, and melanoma (18-20). The mutations in SOX10, which is located on the long arm of chromosome 22 and exon 4 (21), result in the production of an abnormal copy of the SOX10 protein (22). The highest expression of the SOX10 gene is in salivary glands and the brain. SOX10 can prevent the growth and metastasis of tumors related to gastrointestinal cancers and therefore has a tumor inhibitory role (23).
Another gene involved in carcinogenesis is GAS2 (24). This gene encodes a protein that acts as a substrate for caspase-3 also plays an important role in regulating microfilament changes and cell deformation during apoptosis (24). It can also modulate cell sensitivity to p53-dependent apoptosis by inhibiting calpain activity (24). Previous studies have shown the role of the GAS2 gene in cancers including leukemia (25), colorectal (26), hepatocarcinogenesis (24), and pediatric T-cell acute lymphoblastic leukemia (25). However, a review of the pieces of the literature revealed that so far there is no report on the role of this gene in oral squamous cell carcinoma (OSCC).
2. Objectives
This present study aimed at investigating the changes in the expression of SOX10, GAS2, FOXA1, and FOXA2 genes in squamous cell carcinoma to assume the role of these genes in the diagnosis of oral squamous cell carcinoma and its relationship with prognosis.
3. Methods
3.1. Sample Preparation
Thirty oral squamous cell carcinoma samples and normal tissues from the margin area of the tumor were separately prepared from patients who underwent oral and maxillofacial surgery under the supervision and approval of a specialist in Imam Khomeini Hospital, Tehran, Iran.
Written permission was prepared from all patients whose tissue samples were used in this study according to the consent form of Imam Khomeini Hospital. The current study has been approved by the ethics committee of the Faculty of Medical Sciences of Islamic Azad University, Tehran, Iran (ethics code: IR.IAU.PS.REC.1398.146 / IR.IAU.PS.REC.1398.149).
3.2. RNA Extraction and cDNA Synthesis
For RNA extraction, Trizol (Sigma Aldrich, USA) was used. After RNA extraction, the quantity and quality of RNA were evaluated by nanodrop (Thermo scientific, USA) and electrophoresis (Biorad, USA), respectively. Then, cDNA synthesis was done by cDNA synthesis kit (Takara, Japan) according to manufacturer instruction.
3.3. Primer Design
To study the expression of the desired genes in OSCC and normal tissues, specific primers were designed for each gene using Generunner and Primer 3 software. Primer’s analysis in the terms of optimal features and specificity was performed by oligo Analyzer and BLAST, respectively. Table 1 shows the sequence of the primers used.
| Genes and Primer Sequences | Amplified Length |
|---|---|
| FoxA1 | 122 |
| Forward: 5’ GCCCTACTCGTACATCTCGC 3’ | |
| Reverse: 5’ GCTGGTTCTGCCGGTAATAG 3’ | |
| FoxA2 | 111 |
| Forward: 5’ACACCACTACGCCTTCAACC 3’ | |
| Reverse: 5’ GCCTTGAGGTCCATTTTGTG 3’ | |
| GAS2 | 153 |
| Forward: 5’ GCTGGGAAACTTTTGCAGGG 3’ | |
| Reverse: 5’ AACTGGCAGAGACCACCAAG 3’ | |
| SOX10 | 146 |
| Forward: 5’ CACAAGAAAGACCACCCGGA 3’ | |
| Reverse: 5’ AAGTGGGCGCTCTTGTAGTG 3’ | |
| GAPDH | 219 |
| Forward: 5’ TCGGAGTCAACGGATTTG 3’ | |
| Reverse: 5’ CCTGGAAGATGGTGATGG 3’ |
3.4. Real-time PCR
To investigate the gene expression changes at the molecular level, the real-time PCR method using SYBER Green (Takara, Japan) and the real-time PCR instrument (Applied Biosystem, Thermofisher, USA) were used. The used temperature program was according to Table 2. The reaction mixture included 8 µL SYBER Green, 6 µL nuclease-free water, 1 µL cDNA, and 1 µL primer mix (R + F). Eventually, the gene expression was normalized to glyceraldehyde-3-phosphate-dehydrogenase (GAPDH), and results were calculated as fold change relative to the control (n = 5 per group and time point).
| Steps | Temperature (°C) | Time | Cycles (n) |
|---|---|---|---|
| Initial denaturation | 95 | 2 min | 1 |
| Denaturation | 95 | 30 s | 40 |
| Annealing | 60 | 30 s | |
| Extension | 72 | 30 s | |
| Final extension | 72 | 5 min | 1 |
After completing the above steps, the obtained information was checked for the Melting curve and the obtained diagrams were examined for dimer formation.
3.5. Statistical Analysis
Data and the relationship between them were assessed using ANOVA by Prism 8 software at a significant level < 0.05. Shapiro-Wilk normality test was used to measure the normality of the data. The biomarker potential of studied genes was done by ROC analysis.
4. Results
4.1. Clinicopathological Features
From 30 patients with oral squamous cell carcinoma, the results showed that the age range was 26 - 86 years with a median of 64.13 years. More than 73% of patients were male and56.6% of tumors were in grade 1 and most tumors were in stages II and III (Table 3).
| Attributes | Cases |
|---|---|
| No. of Patient | 30 |
| Age, median (range) | 64.13 (36 - 76) |
| Gender | |
| Male | 18 (60) |
| Female | 12 (40) |
| Grade | |
| I | 17 (56.6) |
| II | 13 (43.4) |
| Stage | |
| I | 4 (13.3) |
| II | 10 (33.3) |
| III | 9 (30) |
| IV | 7 (23.3) |
a Values are expressed as No. (%) unless otherwise indicated.
4.2. Evaluation of Changes in Genes Expression
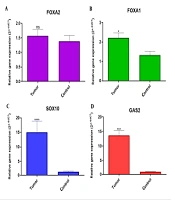
According to Figure 1A, FOXA1 gene had a significantly different expression compared with normal but in terms of the FOXA2 gene, no significant difference was seen between tumor sample and normal tissues (Figure 1B). Both SOX10 and GAS2 genes showed a significant increase in expression in tumor samples compared to tumor margin samples (normal) (Figure 1C and D).
.")
The comparison of A, FOXA2; B, FOXA1; C, SOX10; and D, GAS2 expression in OSCC and normal tissues. A, FOXA1 gene had a significantly different expression compared with normal. B, in the FOXA2 gene, no significant difference was seen between the tumor sample and normal tissues. C and D, Both SOX10 and GAS2 genes showed a significant increase in expression in tumor samples compared to tumor margin samples (normal).
4.3. ROC Analysis
To evaluate the biomarker potential of FOXA1, FOXA2, SOX10, and GAS2 genes for diagnosis of OSCC, receiver operating characteristics (ROC) curve analysis was used. In this study, the FOXA1 and FOXA2 gene had a slight increase in expression in tumor tissue compared to tumor peripheral tissue. In this regard, the area under the curve (AUC) for FOXA1 and FOXA2 genes was calculated to be equal to 0.66 and 0.57, respectively, which indicates the less favorable biomarker potential of both genes (Figure 2A and B). However, AUCs for SOX10 and GAS2 genes were calculated to be 0.90 and 1, respectively, (Figure 2C and D) indicating favorable biomarker potential of both genes for diagnosis of OSCC.

ROC Analysis for A, FOXA1; B, FOXA2; C, SOX10; and D, GAS2 genes
4.4. The Relation of FOXA1, FOXA2, GAS2, and SOX10 Expression with Clinicopathological Features
4.4.1. Age and Gender
The study of the expression of the studied genes in patients with OCSS of different ages and gender showed that the GAS2 overexpressed in patients older than 55 years. However, no significant differences in the expression of the FOXA1, FOXA2, GAS2, and SOX10 genes were observed in other clinicopathological variables (Figure 3).

A, FOXA1; C, FOXA2; E, GAS2; and G, SOX10 genes expression in terms of patients’ age. B, FOXA1; D, FOXA2; F, GAS2; and H, SOX10 genes expression in terms of patients’ gender.
4.4.2. Grade and Stage
There were no significant differences in the expression of FOXA1, FOXA2, GAS2, and SOX10 genes in different grades and stages in patients with OCSS, except that the SOX10 gene was upregulated in grade II and there was a significant difference in the expression of this gene in grade I and II (Figure 4). As a result, it seems FOXA1, FOXA2, GAS2, and SOX10 cannot be valuable biomarkers for diagnosis based on Grades and Stages.

A, FOXA1; C, FOXA2; E, GAS2; and G, SOX10 genes expression in terms of tumors’ grade. B, FOXA1; D, FOXA2; F, GAS2; and H, SOX10 genes expression in terms of tumors’ stage.
5. Discussion
The results of the present study showed overexpression of FOXA1, FOXA2, SOX10, and GAS2 genes in tumor tissue compared to normal. It was also found that SOX10 and GAS2 genes have high biomarker values in oral cancer diagnosis. Also, significant differences were observed between the expression of the GAS2 gene and the age of patients with OSCC and it was found that the expression of this gene in patients over 55 years was higher. SOX10 gene expression was associated with tumor grade and upregulated in grade II.
There are conflicting results in the expression of the FOXA1 gene in cancers, and some studies reported oncogenic effects in acute myelocytic leukemia, esophageal squamous cell carcinomas, lung adenocarcinomas, thyroid carcinoma, prostate cancer, and AR-positive molecular apocrine breast cancer (27-30) and antitumor effects in hepatocellular carcinoma, pancreatic, and estrogen receptor (ER)-positive breast cancer (13, 31, 32). This suggests that the role of this gene may be pro-oncogenic or anti-oncogenic, depending on the type of cancer. In the present study, high expression of this gene was observed in OSCC tumor cells compared to normal cells. To the best of our knowledge, the present study is the first study to examine the expression of FOXA1 in OSCC cancer, and the results emphasized its oncogenic role in OSCC. This difference in the role of FOXA1 in carcinogenesis seems to depend on the type of tumor. The response of FOXA1 in aggressive thyroid cancers was studied and it was observed that the overexpression of this gene reduces the expression of p27Kip1 and thus promotes the cell division cycle (33). Therefore, in the present study, it is likely that FOXA1 caused the progression of OSCC cancer by affecting the expression of proteins involved in the cell division cycle, however, confirmation of this requires further study in this area.
FOXA2 has been shown to play a pivotal role in the development and growth of major organs including the lung, liver, pancreas, and prostate (34-36). However, in the present study, no difference was found between FOXA2 gene expression in OSCC tumor cells and normal cells. On the other hand, it has been reported that inhibition or mutation in this gene can be involved in the development of several types of cancer (37, 38). Studies have shown the role of the antitumor effect of FOXA2 overexpression and inducing growth retardation, apoptosis, and cessation of cell division cycle in lung cancer cells (37). This gene also prevented lung cancer cell metastasis by inhibiting EMT in human lung cancer (39). However, in the current study, no changes in the expression of this gene were observed in cancer cells and normal cells, which is contrary to the findings of other studies mentioned above. This can be attributed to the type of cancer.
The results of this study showed that both SOX10 and GAS2 genes overexpressed in tumor samples so both SOX10 and GAS2 genes can be used as a good diagnostic biomarker for OSCC. So far, no study has been performed on the GAS2 gene expression in OSCC, but a study by Tong et al., which examined the clinical factors of the GAS2 gene on colorectal cancer cells, concluded that the GAS2 gene in phase G2 is expressed in the cell cycle and involved in the proliferation of cancer cells, which significantly increases the expression of this gene in colon cancer (23). Zhou et al. reported that SOX10 was significantly upregulated in liver cancer cells (40). These findings are in line with the current study.
In general, OSCC tissues had a significant difference in the expression of the studied genes compared to normal tissue. Meanwhile, no association was found between the expression of these genes and clinicopathological variables. The results showed that the SOX10 and GAS2 genes have the potential to be used in the diagnosis of OSCC as biomarkers. However, more studies are needed in this area. Considering that, the prevalence of oral squamous cell carcinoma (OSCC) tumor is less than 10% and the positive patients are rare, the main limitation of this study was the sample size.
