


.jpg)


1. Background
Breast cancer (BC) is the most common malignancy diagnosed and the main cause of cancer deaths in women worldwide (1). BC is a highly heterogeneous disease and is devided into at least 4 molecular subtypes (Luminal A, Luminal B, Her2, and Triple negative) according to the immunohistochemistry markers of estrogen receptor (ER), progesterone receptor (PR), and human epidermal growth factor receptor 2 (HER2) (2, 3). Triple-negative breast cancer (TNBC) is accounted for approximately 15 - 20% of BC and is diagnosed by the lack of ER, PR, and HER2 (4). TNBC is characterized as the most aggressive and challenging subtype of BC with a higher risk of recurrence and visceral metastasis, especially brain metastasis (5-7). Nearly 46% of patients with advanced TNBC would develop brain metastasis as their initial site of recurrence, which is associated with poor survival (8). Brain metastasis is a multi-step process involving tumor-cell invasion, intravasation, and circulation of cancer cells in the bloodstream, adhesion of cancer cells to the blood vessel walls in the brain, extravasation of circulating tumor cells across the blood-brain barrier, and colonization of tumor cells in the brain (9, 10). However, the precise molecular mechanisms of brain metastasis in TNBC patients are not fully understood. Moreover, there is no specific guideline for the management of such patients (11). Consequently, one of the essential aspects of TNBC patients’ management is the identification of efficient biomarkers and therapeutic targets. It has recently been revealed that neurotransmission signaling pathways play critical roles in cancer cell proliferation, migration, and invasion. Intriguingly, TNBC tumors have a higher number of up-regulated neural genes than non-TNBC tumors (12), which may explain the higher rate of brain metastasis in TNBC. Nowadays, high‐throughput microarray and RNA‐seq technologies, as well as the systems biology approaches, have provided new strategies for the identification of molecular mechanisms and novel therapeutic targets in malignant tumors (13, 14).
In the current study, we analyzed multiple TNBC expression microarray datasets and identified the GABA receptor π subunit (GABRP) gene as the top up-regulated gene among the differentially expressed genes (DEGs). The expression of GABRP was also compared between TNBC and non-TNBC samples.
2. Objectives
Considering the role of GABRP in nervous system development, its evaluation may help to unravel the underlying molecular mechanism of higher brain metastasis rate in TNBC subtype.
3. Methods
3.1. Bioinformatics Analysis
3.1.1. Data Collection and Preprocessing
In this study, 7 original expression microarray datasets (GSE12763, GSE18864, GSE21653, GSE20711, GSE76275, GSE65194, and GSE45827) from the NCBI Gene Expression Omnibus (GEO) database (http://www.ncbi.nih.gov/geo) were considered. A total of 1068 samples were included in these datasets and all datasets were performed based on the GPL570 platform ([HG-U133_Plus_2] Affymetrix Human Genome U133 Plus 2.0 Array, Santa Clara, CA, USA). Normal breast tissues, cell lines, and tumor samples with unknown subtype have been excluded from our study, therefore, 1013 samples (439 TNBC and 574 non-TNBC) were recruited for the downstream analysis. Multiple preprocessed expression datasets were integrated into one global expression matrices according to gene symbol and subsequently, the technical heterogeneity or batch effect was removed across the datasets by the combat method in the R software. To determine significant DEGs between the TNBC and non-TNBC tumors, the linear model for microarray analysis (LIMMA) package in R with cut-off criteria of |log2FC| > 1 and adjusted P-value < 0.001 was utilized. Co-expression network was constructed for up-regulated DEGs with log2FC > 2 and adjusted P-value < 0.001. Then, based on the Pearson correlation coefficient, the top 20 co-expressed genes were selected using GEPIA online tools (15). Only co-expressed genes that belonged to the DEGs list were selected and the functional enrichment analysis was performed by DAVID bioinformatics tool (16).
3.1.2. Experimental Validation
3.1.2.1. Patients
A total of 83 Iranian women with primary breast cancer including 50 TNBC and 33 non-TNBC, were enrolled in the study. Tumor tissues were provided by the Iranian National Tumor Bank from April 2007 to August 2019. No patient was exposed to any kinds of treatment such as chemotherapy or radiotherapy before surgery. Besides, patients with more than one primary cancer were also excluded. Written informed consent was obtained from all participants. All samples were confirmed by an experienced pathologist and rapidly dissected and snap frozen in liquid nitrogen, then stored in a -80°C freezer until RNA extraction. The current study was approved by the ethics committee of Shahid Beheshti University of Medical Sciences.
3.1.2.2. RNA Extraction and Reverse Transcription
Total RNA was isolated from fresh frozen tumors using GeneAll Hybrid‐R™ RNA extraction kit (GeneAll, South Korea) and then RNA quantity and purity were assessed by NanoDrop UV spectrophotometer (Biotek, Winooski, VT, USA). RNA was converted into complementary DNA (cDNA) using Thermo Fisher Scientific according to the manufacturer’s instructions.
3.1.3. Quantitative Real‐time Polymerase Chain Reaction (qRT‐PCR)
To evaluate GABRP expression, a 2-step amplification PCR assay was performed in an ABI 7500 real-time PCR detection system (Applied Biosystems, USA) using 2.0X RealQ-PCR Master Mix® with SYBR Green (Ampliqon, Denmark) according to the manufacturer’s protocol. The final PCR reaction volume was 20 µL that was consisted of 10 µL 2 × RealQ‐PCR Master Mix, 0.5 µL of each primer (10 pmol), 2 µL cDNA (reverse transcribed from 1 µg RNA), and 7 µL of nuclease-free water. Two‐step real‐time PCR program consisted of an initial denaturation for 15 minutes at 95°C, followed by 40 cycles 95°C for 20 seconds and 60°C for 40 seconds. Melting curve analysis and gel electrophoresis were performed to verify the specificity of PCR amplification. We evaluated 5 endogenous control genes (HPRT1, TBA, PUM1, B2M, RPS23, and HUWE1) for normalization through bioinformatics approaches and finally B2M was selected due to high expression value and expression stability in TNBC tumors as well as non-TNBC tissues. Primers’ sequences were as follows:
(1) GABRP
5'- AGCCAAAGATAGGGGGACAAC-3' (forward)
5'- GGTCAAGTCACTGTAGTCAACG-3' (reverse)
(2) B2M
5'- TGTCTTTCAGCAAGGACTGGT-3' (forward)
5'- TGCTTACATGTCTCGATCCCAC-3' (reverse).
3.2. Statistical Analysis
The qRT-PCR amplification efficiency and cycle threshold (Ct) for each sample were calculated from raw amplification data using LinRegPC software (version:2017.1). GraphPad Prism 8.0 (GraphPad Software, La Jolla, CA, USA) was used for statistical analysis and P-value < 0.05 considered as statistically significant. The normal distribution of GABRP mRNA expression in the TNBC and non-TNBC tumors was analyzed using the Shapiro-Wilk method. The relationship between GABRP expression status and clinicopathological features was analyzed by Fisher’s exact test. The receiver operating characteristic (ROC) curve analysis was used to evaluate the distinctive value of GABRP in TNBC tumors vs non-TNBC tumors.
4. Results
4.1. Identification of Differentially Expressed Genes
In total, 430 DEGs were identified between TNBC and non-TNBC tumors after batch effect correction, including 213 up-regulated and 217 down-regulated DEGs in TNBC tumors based on the cut-off criteria of |log2FC| > 1 and an adjusted P-value < 0.001. The top 10 significantly up-regulated and down-regulated genes are listed in Table 1.
| Gene Symbol | Log2FC | Adjusted P-Value |
|---|---|---|
| Up-regulated | ||
| GABRP | 3.67 | 1.66E-79 |
| HORMAD1 | 3.05 | 1.61E-104 |
| FDSCP | 2.91 | 1.02E-50 |
| PROM1 | 2.81 | 6.05E-53 |
| EN1 | 2.55 | 1.29E-106 |
| FOXC1 | 2.54 | 3.30E-118 |
| ROPN1B | 2.38 | 1.07E-85 |
| PPP1R14C | 2.29 | 2.52E-74 |
| ELF5 | 2.27 | 5.69E-73 |
| BCL11A | 2.13 | 1.32E-93 |
| Down-regulated | ||
| AGR3 | -4.59 | 4.76E-113 |
| ANKRD30A | -4.04 | 1.25E-112 |
| LINC00993 | -4.02 | 6.59E-106 |
| AGR2 | -3.79 | 5.50E-142 |
| TFF1 | -3.61 | 1.23E-79 |
| MLPH | -3.48 | 3.02E-159 |
| SCGB2A2 | -3.45 | 1.42E-48 |
| FOXA1 | -3.42 | 9.15E-143 |
| PIP | -3.18 | 1.67E-56 |
| TFF3 | -3.10 | 7.42E-91 |
4.2. Construction of Co-expression Networks
To explore the molecular mechanism of TNBC tumors, a co-expression network was constructed based on up-regulated DEGs that had cut-off criteria of |log2FC| > 2 and adjusted P-value < 0.001. Next, these DEGs were imported to the GEPIA database and their co-expressed genes were selected regarding to |log2FC| > 1 criterion, and the network was visualized by Cytoscape version 3.7.2 (Figure 1A). Network analysis revealed that GABRP had the highest degree among other genes and was considered as a hub gene. The functional analysis of up-regulated co-expression network disclosed a prominent role of central nervous development genes in TNBC tumors (Figure 1B).
 Up-regulated co-expression network in TNBC tumors. The size of nodes has been adjusted according to degree, and the color depth are proportional to the Pearson correlation coefficient that was obtained from GEPIA. (B) Gene ontology (GO) enrichment analysis of up-regulated co-expression genes. The significant GO terms were selected based on the gene count and the chart was displayed according to the data obtained from DAVID GO term enrichment analysis. Also, the lines were sorted from top to bottom based on how significant that term is (P‐value < 0.05). BP: biological process, CC: cellular component, MF: molecular function.")
(A) Up-regulated co-expression network in TNBC tumors. The size of nodes has been adjusted according to degree, and the color depth are proportional to the Pearson correlation coefficient that was obtained from GEPIA. (B) Gene ontology (GO) enrichment analysis of up-regulated co-expression genes. The significant GO terms were selected based on the gene count and the chart was displayed according to the data obtained from DAVID GO term enrichment analysis. Also, the lines were sorted from top to bottom based on how significant that term is (P‐value < 0.05). BP: biological process, CC: cellular component, MF: molecular function.
4.3. GABRP Gene is Highly Expressed in TNBC Tumors
Consistent with microarray expression analysis findings, qRT-PCR results showed that the GABRP expression level was significantly up-regulated in TNBC tumors compared to non-TNBC tumors (P-value < 0.05; Figure 2).
 Microarray expression analysis of <i>GABRP</i> in TNBC and non-TNBC tumors. (B) qRT-PCR validation of <i>GABRP</i> in breast tumors of the current study.")
Expression of GABRP in breast cancer tissues. (A) Microarray expression analysis of GABRP in TNBC and non-TNBC tumors. (B) qRT-PCR validation of GABRP in breast tumors of the current study.
4.4. Correlation Between GABRP Expression and Clinical Characteristics
To identify the clinical relevance of GABRP mRNA expression in TNBC tumors, the correlation between GABRP expression and clinicopathological characteristics were examined (Table 2). The patients were classified into high and low GABRP expression groups according to the median value. No significant correlation was observed between GABRP expression and age, tumor size, grade, stage, lymph node metastasis, number of lymph nodes positive, and vascular invasion.
| Characteristics | Total No. (N = 48) | GABRP Expression | P-Value | |
|---|---|---|---|---|
| Low (N=22) | High (N=26) | |||
| Age | 0.38 | |||
| < 50 | 23 | 13 | 10 | |
| ≥ 50 | 25 | 11 | 14 | |
| Tumor size (cm) | 0.73 | |||
| ≤ 2 cm | 2 | 1 | 1 | |
| > 2 and 5 ≤ cm | 38 | 18 | 20 | |
| > 5 cm | 8 | 5 | 3 | |
| Tumor grade | 0.95 | |||
| I | 2 | 1 | 1 | |
| II | 15 | 8 | 7 | |
| III | 29 | 14 | 15 | |
| Unknown | 2 | |||
| Tumor stage | 0.5 | |||
| I | 0 | |||
| II | 36 | 17 | 19 | |
| III | 12 | 7 | 5 | |
| IV | 0 | |||
| Lymph node metastasis | 0.5 | |||
| Yes | 15 | 7 | 8 | |
| No | 29 | 16 | 13 | |
| Unknown | 4 | 1 | 3 | |
| Number of lymph nodes positive | 0.12 | |||
| 0 | 29 | 14 | 14 | |
| 1 - 3 | 9 | 5 | 4 | |
| 4 - 9 | 3 | 0 | 3 | |
| ≥ 10 | 6 | 5 | 1 | |
| Unknown | 2 | 0 | 2 | |
| Vascular invasion | 0.55 | |||
| Yes | 30 | 14 | 16 | |
| No | 18 | 10 | 8 | |
In the current research, we investigated the expression value of GABRP as a distinctive biomarker in the TNBC from non-TNBC tumors by ROC curve analysis in integrative analysis and then validated by experimental studies. ROC curve analysis showed that GABRP expression can be considered as a discriminative biomarker in TNBC tumors. The ROC curves revealed area under curve (AUC) values of 0.79 (95% CI: 0.76 - 0.82) and 0.72 (95% CI: 0.60 - 0.85) for integrative analysis and qRT-PCR, respectively (Figure 3).
 The ROC curve of <i>GABRP</i> expression was used to assess its distinctive value in TNBC from non-TNBC based on our integrative analysis. (B) the ROC curve of <i>GABRP</i> expression based qRT-PCR. AUC, area under the curve; qRT-PCR, real-time quantitative polymerase chain reaction.")
ROC curve analysis of GABRP expression value for distinguishing TNBC from non-TNBC tumors. (A) The ROC curve of GABRP expression was used to assess its distinctive value in TNBC from non-TNBC based on our integrative analysis. (B) the ROC curve of GABRP expression based qRT-PCR. AUC, area under the curve; qRT-PCR, real-time quantitative polymerase chain reaction.
5. Discussion
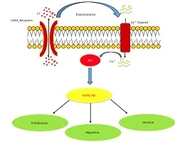
An integrative approach of multiple gene expression profiling data could provide a robust and comprehensive strategy that improves the statistical power to identify the critical genes and pathways involved in TNBC pathogenesis. In the current study, 430 DEGs were identified in TNBC compared to non-TNBC tissues through merging multiple expression microarray datasets. The results revealed GABRP gene as the first top-ranked gene among the up-regulated DEGs (Log2FC: 3.67, adjusted P-value: 1.66E-79). To validate the microarray data, we evaluated GABRP gene expression in TNBC relative to non-TNBC samples by qRT-PCR. The results confirmed the remarkable overexpression of GABRP in TNBC tissues. Moreover, the ROC curve analysis showed that expression levels of the GABRP could be used as a discriminative molecular biomarker between TNBC and non-TNBC tumors. The GABRP is located at 5q35.1 and encodes a transmembrane protein belonging to GABAA receptor family expressed in brain and many non-neuronal tissues (17). It is well known that GABA and GABA receptors play an inhibitory neurotransmitter role in the adult vertebrate brain (18). In addition to its role, several studies have been documented that GABA and GABA receptors play roles in the differentiation, proliferation, and migration of different cells, including cancerous cells (19-21). In the past decade, the role of neurotransmitters-initiated signaling pathway was identified as a critical pathway in cancer development and metastasis (18, 22). Previously, many studies indicated the oncogenic role of GABRP in different types of cancer including breast, pancreatic, prostate, and ovarian cancer (23, 24). On the other hand, several reports have shown that GABA and its receptors seem to have key regulatory effects in many types of cancer (19, 25, 26). Given to findings of various studies, activation of GABAA receptors via depolarizing of cancer cells increases intracellular Ca2+ levels and stimulates the small guanine nucleotide-binding protein Ras, which activates the mitogen-activated protein kinase/extracellular signal-regulated kinase (MAPK/ERK) cascade, and promotes cell proliferation, migration, and invasion in cancer (18, 20, 27) (Figure 4).
 pathway to be activated that facilitates proliferation, migration, and invasion in cancer cells.")
Schematic diagram of GABRP signaling pathways. Activation of GABAA receptors induced cell membrane depolarization and elevated intracellular Ca2+ then Ca2+ leads to activation of the small guanine nucleotide binding protein Ras. Ras activation causes the mitogen activated protein kinase/extracellular signal-regulated kinase (MAPK/ERK) pathway to be activated that facilitates proliferation, migration, and invasion in cancer cells.
Wali et al. showed that GABRP knockdown inhibited TNBC cell growth and colony formation. They also suggested that GABRP can be a potential therapeutic target in TNBC subtype (28). According to our bioinformatics investigation, GABRP was identified as a hub node with the highest degree and betweenness centrality in the co-expression network. Moreover, the functional enrichment analysis indicated that the co-expression network had been enriched mainly in the nervous system development; therefore, it is reasonable to infer that neural genes may play critical roles in TNBC tumorigenesis. Tan et al. also observed that neural genes are more up-regulated in TNBC than non-TNBC subtypes and proposed these genes may have different neural functions in TNBC tumors (12). It is well known that brain metastasis has a high incidence rate of 46% in advanced TNBC patients, and is one of the most important challenges in the patients’ clinical management (8). According to Paget’s seed/soil hypothesis, our findings suggest that the co-expression pattern of up-regulated genes in TNBC cells could provide a microenvironment similar to the nervous system, which may facilitate colonization of circulating cancer cells in the brain tissue. It has been reported that breast cancer patients with brain metastasis display a GABAergic phenotype similar to neuronal cells with up-regulation of GABAA receptors, GABA transporters, and GABA transaminase (29). Sizemore et al. demonstrated that GABRP expression is associated with brain metastasis in breast cancer cells for the first time (21). The precise molecular mechanisms leading to brain metastasis in TNBC patients are not completely understood and remain a subject of debate. Furthermore, there is no specific guideline for the management of these patients (11). Thus, the identification of biomarkers that predict brain metastasis in TNBC patients may help disease management. Our findings proposed that GABRP, as a noticeable up-regulated gene, along with its co-expressed genes could prone tumor cells to homing in brain tissue. Therefore, magnetic resonance imaging (MRI) of the brain in TNBC patients with high expression of the GABRP gene may provide a more personalized disease management. Moreover, GABRP is a promising therapeutic target in TNBC because it could be feasibly targeted since it is a cell surface receptor subunit. Systemic inhibition of GABRP is likely to exhibit negligible neurotoxicity due to the little abundance in neuronal tissues than in other organs (21, 28). This study was limited by its small sample size and lack of clinical metastasis evidence. Therefore, these findings need to be further evaluated in larger series of breast cancer patients with identified clinical metastasis in future studies.
In conclusion, we identified the GABRP as a first-ranked up-regulated gene among DEGs in TNBC compared with non-TNBC based on a couple of microarray data through an integrative bioinformatics approach. Furthermore, the bioinformatics assessment suggested that the up-regulation of GABRP could serve as a molecular signature of brain metastasis in TNBC patients. In order to improve cancer management strategies, a short interval monitoring by MRI of the brain may be suggested as a practical approach for TNBC patients with a high level of GABRP expression.
