


1. Background
Prostate cancer (PCa) is the second most prevalent cancer following lung cancer and the fifth leading cause of men's mortality (1, 2). Genetic variations and environmental factors such as age, diet, and smoking participate in the pathogenesis of PCa (3). Rectal examination, prostate-specific antigen (PSA) serum levels measurement, and prostate biopsy are commonly used for PCa diagnosis (4). Also, with the emerging advances in genetic analyses, an increased number of gene loci have been identified in these patients (5-8). On the other hand, benign prostatic hyperplasia (BPH) is one of the most common findings in older men, which is described only by benign proliferation in prostate cells (9). The etiology and molecular mechanisms involved in BPH are not well understood (10). Although PCa and BPH often occur simultaneously in older men, the cellular and molecular mechanisms involved in the two diseases are different (11, 12). Thus, despite the apparent and semiological similarities of both diseases, the differential diagnosis of PCa from BPH with genetic biomarkers will be valuable.
Due to the upcoming drug resistance in metastatic PCa cases, there is an urgent need to set new treatment goals. Signal transducer and activator of transcription 3 (STAT3) transcription factor is a potential therapeutic target for the treatment of progressive PCa (13, 14). STAT3 acts as an oncogenic protein in PCa via activating transcription of proteins such as B-cell lymphoma 2 (BCL-2) (15-17). STAT3 plays an important role in angiogenesis as a key step of cancer development in both physiological and pathological conditions (18).
Protein tyrosine phosphatase receptor-type T (PTPRT) acts as a tumor suppressor by interacting with its substrate, STAT3 (19). Whole-exome sequencing and protein array analysis has shown that mutations in the PTPRT gene in head and neck cancer lead to increased cell survival via increased activity of STAT3 and, therefore, can be used as a biomarker to predict the effectiveness of STAT3 inhibitor chemotherapy drugs (20).
Long non-coding RNAs (lncRNAs) are a newly identified class of non-coding RNAs with more than 200 nucleotides, whose role in numerous biological processes by regulating the expression level of the effector genes had been elucidated (21). TNK2 Antisense RNA 1 (TNK2-AS1) is an oncogenic lncRNA that stabilizes STAT3 by protecting it from proteasome degradation. Reciprocally, STAT3 binds to the TNK2-AS1 promoter and stimulates its transcription. This positive feedback between these two increases the VEGF expression and facilitates angiogenesis (22). Long intergenic non-protein coding RNA, regulator of reprogramming (LINC-ROR) is another lncRNA involved in tumorigenesis and angiogenesis under hypoxia. This lncRNA is dysregulated in various cancers, including breast cancer, hepatocellular cancer, endometrial cancer, and so on (23-30).
Due to the difficulties in distinguishing PCa from BPH and also a need to predict the possibility of BPH progression to PCa, there is a need for reliable markers to have differential expressions in these two conditions.
2. Objectives
In the present study, we aimed at assessing the expression level of the STAT3, PTPRT, TNK2-AS1, and LINC-ROR genes in the prostate tissues of patients with PCa compared to adjacent non-cancerous tissues (ANCTs) and BPH tissue samples and their association to tumor grade and stage. Also, we evaluated their value in the diagnosis and progression of prostate malignancy.
3. Methods
3.1. Participants
Our study population was composed of 50 patients diagnosed with PCa undergoing surgery as well as 50 BPH patients, who were referred in the same period to the Hasheminejad Hospital in Tehran, Iran. Formalin-fixed paraffin-embedded (FFPE) samples of tumoral and ANCTs were taken from patients with PCa and patients with BPH conditions. All patients were Iranian, aged more than 50 years, with no history of familial PCa, whose condition was histopathologically confirmed by a pathologist. Patients with PCa included in the study had a tumor with a stage of more than 3 and received no chemical or radiation therapy at the time of sampling. There was no evidence of the coexistence of any other malignancies or prostate inflammation in patients with PCa and BPH. Patients are classified into 5-grade groups based on the modified Gleason score groups. Our study protocol was approved by the Ethics Committee of Shahid Beheshti University of Medical Sciences (IR.SBMU.MSP.REC.1399.588), and signed informed consent was taken from each participant.
3.2. Gene Selection
We executed a pathway-based biomarker search to find genes engaged in the angiogenesis processes in prostate tissue using known databases such as Kyoto encyclopedia of genes and genomes (KEGG) and database for annotation, visualization, and integrated discovery (DAVID). Then, to evaluate protein cross-reactions, listed genes were applied to search tool for the retrieval of interacting genes/proteins (STRING) and BioRidge databases, as well as Cytoscape software. Using such an algorithm was conducted to select STAT3, PTPRT genes, which had the highest score. To explore lnc-RNAs related to these genes, two valid databases, LncRNA2Target and LncRNADisease, were searched. Then, the lnc-RNAs from the list that have a putative role in the angiogenesis pathway were selected. Finally, we selected two lnc-RNAs, namely TNK2-AS1 and LINC-ROR, whose expression in prostate tissue was approved by exploring National Center for Biotechnology Information (NCBI) and “GENE CARD” databases.
3.3. Quantitative Real‐Time RT‐PCR
Total RNA was extracted from the 10 μm-thick sectioned FFPE samples, using the RNeasy FFPE Kit and deparaffinization solution (Qiagen, Inc., Valencia, CA, USA) based on the producer protocol. The ExcelRT™ Reverse Transcription Kit (SMOBIO, Taiwan) was used for cDNA synthesis from about 1 µg of total RNA according to the kit’s manual. Then, to analyze genes expression levels, an SYBR Green-based real-time PCR assay on synthesized cDNAs was performed, using the RealQ Plus 2x Master Mix Green, High ROXTM (AmpliQon, Denmark) on the StepOnePlus™ Real-Time PCR instrument. For mRNA expression level normalization, the β2M (β2 microglobulin) gene was used as the internal control. All experiments were performed in duplicate. The primer sequences used for real-time amplification of STAT3, PTPRT, TNK2-AS1, LINC-ROR, and β2M genes mRNA are shown in Table 1.
| Gene Name | Sequence | Product Length |
|---|---|---|
| STAT3 | F: GCCGGAGAAACAGTTGGGAC | 158 bp |
| R: TGACTCTCAATCCAAGGGGC | ||
| PTPRT | F: CATGGTGGAGACCCTGGAAC | 161 bp |
| R: AGAGCTCCTGAGCCCAGTTA | ||
| TNK2-AS1 | F: TGGGGCTCCTTCCCGTTCA | 128 bp |
| R: TCGACTCGGCGGGACTTC | ||
| LINC-ROR | F: TAACTCTCACAGTGGAAGAAACC | 153 bp |
| R: CAACCCTGAAGTCACACACA | ||
| β2M | F: AGATGAGTATGCCTGCCGTG | 105 bp |
| R: GCGGCATCTTCAAACCTCCA |
Sequences and the Length of Products for Primer Sets Used for Gene Expression Analysis
3.4. Statistical Analysis
The GraphPad Prism 8 software was used for statistical analysis. Fold changes for expression of evaluated genes were assessed, using REST 2009 software. For evaluating the distribution normality of all data sets, the Shapiro-Wilk test was performed. The student paired t-test and Mann-witney tests were used for assessing the significant difference in expression of genes for normal and non-normal distributed data sets, respectively. Correlation between the relative gene expression levels was assessed, using the Pearson or Spearman correlation coefficient based on the normality of data sets. The association between the patient grade groups and gene expression levels in normal and non-normal distributed data sets was evaluated, using One-way ANOVA (Analysis of variance) and Kruskal-Wallis tests, respectively. To evaluate the power of each gene transcript level for differentiation between the tumoral tissue and ANCT, the receiver operating characteristic (ROC) analysis was applied. A P-value less than 0.05 was considered significant for all statistical analyses.
4. Results
4.1. Participants Clinicopathologic Properties
Table 2 showed the patient’s clinicopathologic properties. The mean age of patients included in this study was 60.38 ± 3.64 for patients with PCa and 60.28 ± 4.36 years for patients with BPH. More than 60% of patients in both groups were smokers. The majority of PCa patients (> 80%) had a tumor with a stage of 3. Our analysis showed that the PSA serum level of PCa patients was significantly higher than patients with BPH (P < 0.0001).
Participants’ Clinicopathologic Properties
4.2. Bioinformatic Analysis
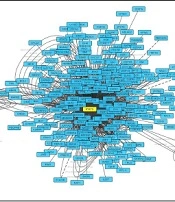
Important genes involved in the angiogenesis pathway were identified, using KEGG and DAVID databases. Evaluating protein reactions using STRING and BioRidge databases and Cytoscape software showed that PTPRT and STAT3 genes are considered as best candidates with the highest degrees. This indicated that these genes have a key role in angiogenesis and were considered hub-nodes (Figure 1).

PPI Network platting of protein interactions using Cytoscape software. STAT3 and PTPRT were considered hub-nodes.
4.3. Expression Analysis of STAT3, PTPRT, TNK2-AS1, and LINC-ROR Genes in PCa Tumoral Tissues Compared with ANCTs
To reveal the potential changes, the gene expression levels of STAT3, PTPRT, TNK2-AS1, and LINC-ROR in PCa tumoral tissues were compared with their expression in ANCTs. Our investigation revealed significant overexpression of the STAT3 by 27-fold (P < 0.0001) and LINC-ROR genes 8-fold (P < 0.0001) in tumoral tissues compared to ANCTs. But, there were no significant differences between the expression level of PTPRT and TNK2-AS1 in tumoral samples compared to ANCTs (P = 0.49 for both genes). Figure 2 shows data of the relative expression in tumoral tissues in comparison to ANCTs for genes of interest.
, <i>PTPRT1</i> (B), <i>TNK2-AS1</i> (C), and <i>LINC-ROR</i> (D) genes in tumoral tissues compared to ANCTs. The Y-axis shows the expression level and the type of sample represented in the X-axis. Each bar represents the relative expression of the gene of interest. Results are presented in mean ± SEM.")
Relative expression of STAT3 (A), PTPRT1 (B), TNK2-AS1 (C), and LINC-ROR (D) genes in tumoral tissues compared to ANCTs. The Y-axis shows the expression level and the type of sample represented in the X-axis. Each bar represents the relative expression of the gene of interest. Results are presented in mean ± SEM.
4.4. Expression Analysis of STAT3, PTPRT, TNK2-AS1, and LINC-ROR Genes in PCa Tumoral Tissues Compared with BPHs
Additionally, we evaluated the differential expression of the above-mentioned genes in PCa tumoral tissues compared with BPHs to see if there is a difference between these two conditions in the context of angiogenesis-related genes and lnc-RNAs expression level. Figure 3 shows the relative expression analysis for STAT3, PTPRT, TNK2-AS1, and LINC-ROR genes in tumoral tissues compared with BPHs. The expression analysis showed that the expression level of the STAT3 in tumoral tissues was significantly higher (3-folds) than in BPH tissues (P = 0.001). However, the expression of PTPRT, TNK2-AS1, and LINC-ROR genes did not show a significant difference in tumoral against BPH tissues.
, <i>PTPRT1</i> (B), <i>TNK2-AS1</i> (C), and <i>LINC-ROR</i> (D) genes in tumoral tissues compared to BPH tissues. The Y-axis shows the expression level and the type of sample represented in the X-axis. Each bar represents the relative expression of the gene of interest. Results are presented in mean ± SEM.")
Relative expression of STAT3 (A), PTPRT1 (B), TNK2-AS1 (C), and LINC-ROR (D) genes in tumoral tissues compared to BPH tissues. The Y-axis shows the expression level and the type of sample represented in the X-axis. Each bar represents the relative expression of the gene of interest. Results are presented in mean ± SEM.
4.5. Association Between Gene Expression Levels and Clinicopathological Characteristics in PCa
Figure 4 illustrates the analyses of the association analysis between the grade group of patients and expression levels of STAT3, PTPRT, TNK2-AS1, and LINC-ROR genes in PCa samples compared with ANCTs, which were performed to reveal the influence of tumor progression at the transcript level. As shown, there was a significant association between the higher grade group of the tumor and the relative expression of STAT3 in PCa samples compared with ANCTs (P = 0.03). Here we found no association between the expression level of PTPRT, TNK2-AS1, and LINC-ROR genes and the grade group of the tumor (P = 0.15, P = 0.85, P = 0.1 respectively). As shown in Figure 5, evaluating the association between the tumor stage and gene expression level revealed that the high expression level of PTPRT and LINC-ROR genes was associated with a higher stage of cancer in patients with PCa (P = 0.002 and P = 0.0001, respectively).
, <i>PTPRT1</i> (B), <i>TNK2-AS1</i> (C), and <i>LINC-ROR</i> (D) genes. The Y-axis represents the relative expression of each sample and the X-axis represents the grade groups.")
The association between the tumor grade and the expression level of STAT3 (A), PTPRT1 (B), TNK2-AS1 (C), and LINC-ROR (D) genes. The Y-axis represents the relative expression of each sample and the X-axis represents the grade groups.
, <i>PTPRT1</i> (B), <i>TNK2-AS1</i> (C), and <i>LINC-ROR</i> (D) genes. The Y-axis represents the relative expression of each sample and the X-axis represents the stage categories.")
The association between the tumor stage and the expression level of STAT3 (A), PTPRT1 (B), TNK2-AS1 (C), and LINC-ROR (D) genes. The Y-axis represents the relative expression of each sample and the X-axis represents the stage categories.
4.6. ROC Curve Analysis
Due to the significant difference in the expression level of STAT3 and LINC-ROR in tumoral tissues of PCa patients compared to ANCTs, the ROC curve analysis was performed for the transcript level of these genes to evaluate their diagnostic power. The area under curve (AUC) value of STAT3 gene transcripts for discrimination of tumoral tissue from the ANCTs was 0.93 (P < 0.0001) and is considered an excellent diagnostic marker. The LINC-ROR transcript level was able to differentiate between tumoral tissue and the ANCTs with an AUC value of 0.75 (P < 0.0001). Since the expression level of the STAT3 gene was significantly different in tumoral tissues of PCa compared to BPH patients, the ROC curve was plotted for evaluating its diagnostic power and the AUC value of STAT3 gene transcripts for discrimination between tumoral tissue and the BPH was 0.9 (P < 0.0001). The data suggested STAT3 expression level as an excellent diagnostic marker. Figure 6 and Table 3 show data of ROC curve analysis for STAT3 and LINC-ROR transcript levels.
 <i>STAT3</i> gene expression level for discrimination of PCa and ANCTs, (B) expression level of <i>LINC-ROR</i> for discrimination of PCa and ANCTs, and (C) <i>STAT3</i> gene expression level for discrimination of PCa and BPH.")
The results of the ROC curve analysis for evaluating the diagnostic power of (A) STAT3 gene expression level for discrimination of PCa and ANCTs, (B) expression level of LINC-ROR for discrimination of PCa and ANCTs, and (C) STAT3 gene expression level for discrimination of PCa and BPH.
| GOI | AUC (95% CI) | P-Value a | J | Sensitivity | Specificity | PPV, % | NPV, % |
|---|---|---|---|---|---|---|---|
| STAT3 (PCa vs. ANCT) | 0.93 (0.864 to 0.973) | < 0.0001 | 0.78 | 86 | 92 | 68.77 | 96.98 |
| LINC-ROR (PCa vs. ANCT) | 0.75 (0.660 to 0.837) | < 0.0001 | 0.46 | 100 | 46 | 27.50 | 100 |
| STAT3 (PCa vs. BPH) | 0.9 (0.830 to 0.955) | < 0.0001 | 0.74 | 88 | 86 | 68.83 | 95.33 |
ROC Curve Analyses for Evaluation of the Diagnostic Power of STAT3 and LINC-ROR in Patients with PCa
4.7. Correlation Between the Expressions of STAT3, PTPRT, TNK2-AS1, and LINC-ROR Genes
To examine any relationship between the expression levels of STAT3, PTPRT, TNK2-AS1, and LINC-ROR, a genes correlation analysis was performed. Statistical analysis showed that except for STAT3 and TNK2-AS1 (r = 0.78 and P < 0.0001), there was no significant correlation between the expression level of the rest pairwise in tissue samples (Table 4).
| Pairwise Correlation | R Coefficient | P-Value a | 95% CI |
|---|---|---|---|
| STAT3 and PTPRT | 0.28 | 0.0004 | 0.1256 to 0.4293 |
| STAT3 and TNK2-AS1 | 0.78 | < 0.0001 | 0.6367 to 0.7917 |
| STAT3 and LINC-ROR | 0.2 | 0.01 | 0.1260 to 0.2033 |
| PTPRT and TNK2-AS1 | 0.29 | 0.0003 | 0.1358 to 0.4378 |
| PTPRT and LINC-ROR | 0.36 | < 0.0001 | 0.0249 to 0.3348 |
| TNK2-AS1 and LINC-ROR | 0.26 | 0.0009 | 0.062 to 0.3757 |
Pairwise Correlation Between the Expression Levels of STAT3, PTPRT, TNK2-AS1, and LINC-ROR Genes in Tissue Samples
5. Discussion
We evaluated expression changes of STAT3, PTPRT, TNK2-AS1, and LINC-ROR genes in the tumoral tissues compared to ANCTs from PCa patients and also to BPH tissue samples. Besides, the association between the expression level changes with the clinical data of patients was measured. These data showed the higher expression of the STAT3 and LINC-ROR genes in tumoral tissues compared to ANCTs. Besides, the STAT3 expression level was significantly upregulated in tumoral tissues compared to BPH. Significant associations were found between the higher grade group of the tumor and the relative expression of STAT3 in PCa samples compared with ANCTs. The present study revealed a significant association between the expression levels of PTPRT and LINC-ROR genes and a higher stage of cancer in patients with PCa.
Don-Doncow et al. studied 223 patients with advanced PCa; they showed that the STAT3 expression level was significantly increased in more than 95% of bone and lymph node metastases and hypothesized that tissue type can affect STAT3 expression levels. Therefore, targeting STAT3 expression could be considered a potential therapeutic strategy for PCa (15). In line with these data, our study also showed increased expression of STAT3 in patients with PCa tumors with a grade 3 or more; also, this worked an association between increased expression with tumor grade. Altogether, these data proposed that the increased expression of STAT3 may have a role in the progression of PCa to advanced form and metastasis.
To our knowledge, this was the first study on the expression status of TNK2-AS1 in patients with PCa. Wang et al. showed increased expression of TNK2-AS1 in non-small cell lung cancer and its correlation with poor prognosis. TNK2-AS1 interacts with STAT3 to protect it against proteasome degradation, and STAT3 stimulates transcription by binding to the TNK2-AS1 promoter, and positive feedback between these two increases VEGF and facilitates angiogenesis (22). As mentioned here, STAT3 showed increased expression in tumor samples compared to ANCT and BPH, which proposed the prominent role of this gene in the invasion process. Although tumor tissue was not significantly different from ANCT and BPH tissue in terms of TNK2-AS1 expression in this study, STAT3 and TNK2-AS1 expression levels showed a significant positive correlation, indicating a close molecular interaction between these two genes. The fact that the expression pattern of genes might vary in different tissues could be the cause of the discrepancy between our data and the results presented in the above-mentioned research on NSCLC patients.
A study on tumoral and BPH samples compared with ANCT samples showed altered expression of 3384 genes based on RNA-seq analysis. Finally, they approved the increased expression of 4 genes, including PTPRT via RT-qPCR (31). In our study with larger sample size, PTPRT expression changes between tumor tissue and ANCT or BPH were not significant. However, this gene showed a significant increase in expression with the increasing stage of the disease. This finding alone could indicate the need for more and more detailed studies on this gene.
Another lncRNA involved in the angiogenesis process is LINC-ROR. Fan et al. demonstrated the role of LINC-ROR as an oncogene and found that this lncRNA inhibits a series of expression changes that lead to tumorigenesis (3). Qin et al. performed a functional study and showed that knockdown of LINC-ROR inhibited the growth, migration, and angiogenesis of HMCE-1 cells (32). LINC-ROR transcription was dysregulated in cancer of breast, pancreatic, hepatocellular, and endometrial. This lncRNA is also involved in many of the cell's natural regulatory functions. However, the exact mechanism of LINC-ROR involvement in various cancers is still unknown (29). In concordance with these data, the present study reported an 8-fold increase in the expression of LINC-ROR in tumoral tissue compared to ANCTs. But, there was no significant difference in expression levels of this gene between tumor tissue and BPH. According to our results, the increased expression of this gene was associated with a higher stage of cancer. The results were confirmed by the data previously presented by Zhai et al. in 2019 (33). They showed the increased expression of the LINC-ROR in PCa tissue compared to ANCTs; also, our study found an association between this overexpression and the higher stages of cancer. All these proposed a role for this gene in the progression of PCa cancer.
Due to the heterogeneity of PCa, there is a lack of a biomarker to identify and differentiate BPH from PCa and predict the clinical consequences of the disease and guide the best treatment strategy. Measurement of PSA serum level has been introduced as a well-established marker with excellent diagnostic value in various studies (34, 35). However, PCa still occurs in a wide range of PSA levels. In this study, expression levels of STAT3 had excellent diagnostic value for distinguishing tumor tissue from ANCT and BPH tissue. The results of the present study suggested that evaluating the expression of critical genes along with the PSA could be very helpful and lead to the enhanced predictive value of PSA.
The small size of the study population was a limitation of this study. Also, using probe-based Real-Time PCR and selecting a wider panel of genes predicted to be involved in the PCa development may result in more accurate data and finally lead us to a useful panel of genes expression that helps physicians to distinguish PCa accurately from BPH and predict the prognosis of each patient. It must be declared that these data need to be confirmed in future studies.
5.1. Conclusions
In conclusion, the present work showed that the STAT3 and LINC-ROR as angiogenesis-related genes were upregulated in patients with PCa. The STAT3 gene with a high AUC value could be suggested as an excellent biomarker in the diagnosis of PCa. Considering the correlation between the TNK2-AS1 and STAT3, evaluating a bigger sample size may be more informative. The present data may be useful in the path of the genetic biomarker identification and also finding mediators with a role in the key pathways of prostate tissue enlargement that would be helpful in the discrimination of PCa from BPH.
