1. Background
Hepatitis C virus (HCV) belongs to the genus Hepacivirus, family Flaviviridae is an encapsulated positively stranded RNA virus with a genomic size of 9.6 kilobases (kb), that frequently infects humans. Persistent HCV infection is one of the leading causes of liver disease worldwide and leads to liver cirrhosis and hepatocellular carcinoma (HCC) (1-3). Hepatitis C virus genotype 3 is the most common in India and Northeast India has a similar prevalence rate as with the rest of the country (4-6).
Small non-coding endogenous RNAs called microRNAs (miRNAs) control up to 60% of cellular mRNA expression. MicroRNAs mostly repress their targets by interaction with the 3’ untranslated region (UTR), however, miRNAs may cause upregulation of their targets through interaction in a non-3’ UTR region of the mRNA (7). The prospect of using miRNAs as prognostic markers is of interest and has been reported by various studies. MicroRNA changes in diseases such as HCC and liver fibrosis, their sensitive detection by quantitative PCR, and the non-invasive nature of their assessment make them attractive biomarkers for studying the modulation of hepatotropic virus infection (8). Also as miRNAs are not targeted by ribonucleases they remain extremely stable in clinical samples (9-11). The biological roles of the liver-specific miRNA, microRNA-122 (miR-122), which is scarcely expressed in other tissues, are to maintain liver homeostasis, cholesterol metabolism, and foetal liver development. The abundance of miR-122 in the liver helps HCV to promote replication and translation of its genome (2, 12, 13).
2. Objectives
Circulating miR-122 in serum has previously been identified as a biomarker for detecting HCV-induced liver injury (9, 14-16). Since the increasing trend of the disease burden of HCV can only be tackled with easy and early diagnosis before treatment, our study evaluated the diagnostic potential of serum miR-122 levels in HCV genotype 3 infected patients with chronic infection and cirrhosis from Northeast India.
3. Methods
3.1. Study Subjects
Serum was collected from 192 patients from the Outpatient Department of Gastroenterology, Gauhati Medical College and Hospital, Guwahati, India with informed consent. Patients with anti-HCV antibodies and HCV RNA-positive patients were included in this study. All patients were confirmed to have HCV genotype 3 infections. Patients with HIV or HBV co-infection, diabetes, alcoholic liver disease, autoimmune or hematological diseases, and abnormal liver ultrasounds were excluded from the study.
A total of 72 patients were categorized as chronic hepatitis C (CHC), while 64 had liver cirrhosis and 56 were diagnosed with HCC. The presence of liver cirrhosis was clinically determined by the occurrence of ascites, esophageal varices, splenomegaly, jaundice, imaging, and liver biopsies (when available). Hepatocellular carcinoma was diagnosed with a 4-phase multi-detector computed tomography (CT) scan, dynamic contrast-enhanced magnetic resonance imaging (MRI) as mentioned elsewhere (17).
Serums from n = 40 sex and age-matched healthy individuals were taken as controls. All of the controls were taken based on the absence of other viral indicators, autoimmune hepatitis, diabetes, abnormal liver ultrasounds, and liver function tests. All individuals taking part in the study gave their informed consent. The Gauhati Medical College and Hospital’s Institutional Ethics Committee gave the study permission for the study.
3.2. Hepatitis C Virus RNA Extraction, Quantification and Genotyping
QIAamp Viral RNA Mini Kit (Qiagen, Valencia, CA, USA) was used for extracting HCV RNA from the serum of HCV-infected patients according to the manufacturer’s protocol and stored at -80°C. Hepatitis C virus viral load was quantified using Artus HCV RG RT-PCR Kit (Qiagen, Valencia, CA, USA) on Rotor-Gene Q 5plex Platform (Qiagen, Valencia, CA, USA). For HCV genotyping 5’ UTR-core region was PCR amplified with specific primers and 173 bp product was sequenced to determine the HCV genotype (Table 1).
| S. no | Target-Region | Sense | Sequence | Amplicon Size (bp) |
|---|---|---|---|---|
| 1 | HCV 5’ UTR-Core | Forward | 5’-GCCTTGTGGTACTGCCTGAT-3’ | 173 |
| Reverse | 5’-ACTCCACCAACGATCTGACC-3’ |
3.3. MicroRNA Isolation
Total RNA was isolated from whole blood samples using the miRNeasy Minikit (Qiagen, Valencia, CA, USA) followed by miRNA enrichment. Briefly, 100 μL of patients’ serum was taken with 500 μL of QIAzol lysis reagent and it was kept at room temperature for 5 minutes. An amount of 140 μL of chloroform was added and vortex to mix for 15 s and it was subjected to 2 minutes of incubation in the room. Two separate phases were obtained by centrifuging at 12000 g at 4°C for 15 minutes. For purification of only miRNA upper aqueous phase was transferred into new sterile tubes and one volume of 70% ethanol was added and mixed by pipetting. Up to 700 μL of the mixture was added onto the RNeasy spin column that is placed in a clean 2 mL collection tube followed by centrifugation at 8000 g at room temperature for 15 s. We added 450 μL of absolute alcohol to the supernatant and mixed it thoroughly by the vortex. RNeasy MinElute Cleanup Kit (Qiagen, Valencia, CA, USA) was used for the purification of miRNA fraction from total RNA. Seven hundred μL of the mix was added onto the RNeasy MinElute spin column placed in a 2 mL collection tube and centrifuged at 8000 g at room temperature for 15 s. The flow-through was discarded and the process was repeated for the whole mix volume. An amount of 700 μL buffer RWT was added to the column and subjected to centrifugation at 8000 g for 15 s and 500 μL of buffer RPE was added onto the column, centrifuged at 8000 g at room temperature for 15 s, and the flow through discarded. Five hundred μL of 80% ethanol was added to the column, centrifuged at 8000 g at room temperature for 2 min, and flow through was discarded. A new 2 mL spin column was used and again centrifuged at 8000 g at room temperature for 5 min. Fourteen μL of RNase-free water was added onto the column and centrifuged at 8000 g to elute miRNA enriched fraction.
3.4. Reverse Transcription
We used 10 ng of miRNA in a total volume of 20 μL to carry out reverse transcription by incubating for 60 min at 37°C and 5min at 95°C using miScript PCR Starter Kit (Qiagen, Valencia, CA, USA) as per the manufacturer’s instructions.
3.5. Quantitative Real-time PCR
Mature miR-122 expression was carried out by quantitative real-time PCR using miScript PCR Starter Kit and miScript SYBR Green PCR Kit (Qiagen, Valencia, CA, USA) with Hs_miR-122a_1 miScript Primer Assay (Qiagen, Valencia, CA, USA) which targets hsa-miR-122-5p. Relative quantification was done using the 2-∆∆CT method using U6-snRNA as the internal reference.
3.6. Statistical Analysis
Statistical calculations were carried out using Statistical Package for the Social Sciences version 16.0 software (SPSS Inc., Chicago, IL) or GraphPad Prism-5.0 (GraphPad Software, CA, USA). A chi-square test or Fischer exact test was performed to compare categorical data. A comparison of independent samples from 2 groups was performed using the Mann-Whitney U-test. Spearman’s nonparametric rank test was used to determine nonparametric statistical significance. The correlation coefficients (r) were calculated using Spearman correlation. To assess the diagnostic and prognostic accuracy, receiver operating characteristic (ROC) analysis was performed, and the area under the curve (AUC) was computed. Area under the receiver operating characteristic curve (AUROC) less than 0.60 were considered unreliable for the ROC curve. P-value < 0.05 was considered to be statistically significant.
4. Results
4.1. Demographic and Laboratory Characteristics of the Hepatitis C Virus Patients and Control Group
The clinical and laboratory data of the patients are summarized in Table 2. The average age of cirrhosis and HCC patients was found higher than both healthy controls and CHC patients (P = 0.0001). A significant difference was observed for liver enzyme ALT and AST level between controls and all other groups of patients (P = 0.0001). ALT and AST were also significantly elevated in HCC patients than in CHC and cirrhosis patients (P = 0.0001). Similarly, a difference was observed for total bilirubin (P = 0.0001) and serum albumin level (P = 0.0001) in cirrhosis and HCC groups upon comparison with healthy control. However, no difference was observed while comparing healthy controls with CHC patients. Also, no significant variation was observed between the occurrence of Ascites but the Child-Pugh score was significantly different among the cirrhosis and HCC patients (P = 0.0112).
| Characteristics | Healthy Controls (n = 40) | Chronic Hepatitis C (n = 72) | Cirrhosis (n = 64) | Hepatocellular Carcinoma (n = 56) | P Value |
|---|---|---|---|---|---|
| Age (y) | 41.9 ± 13.2 | 39.7 ± 15.1 | 51.5 ± 9.3 b, c | 53.2 ± 12.4 b, c | 0.0001 |
| Male gender | 30 (75.0) | 48 (66.7) | 53 (82.8) c | 43 (76.8) | 0.0485 |
| Leucocytes (× 103/μL) | 8.1 ± 2.4 | 10.7 ± 5.3 b | 6.1 ± 4.1 b, c | 6.1 ± 4.6 b, c | 0.0062 |
| Haemoglobin (g%) | 13.2 ± 2.4 | 10.6 ± 1.2 b | 9.3 ± 2.6 b, c | 8.5 ± 3.5 b, c | 0.0001 |
| ALT (IU/L) | 43.2 ± 13.5 | 70.8 ± 15.6 b | 87.3 ± 24.1 b, c | 116.3 ± 18.6 b, c, d | 0.0001 |
| AST (IU/L) | 37.1 ± 17.8 | 72.8 ± 20.5 b | 96.6 ± 28.2 b, c | 109.7 ± 14.9 b, c, d | 0.0021 |
| ALP (IU/L) | - | 219.88 ± 102.39 | 317.62 ± 171.51 | 317.62 ± 171.51 | - |
| Total bilirubin (mg/dL) | 1.8 ± 1.2 | 2.2 ± 1.7 | 2.4 ± 1.6 b, c | 3.1 ± 1.8 b, c, d | 0.0001 |
| Serum albumin (g/dL) | 3.8 ± 1.8 | 2.9 ± 2.1b | 2.6 ± 1.2b | 2.2 ± 1.4 b, c, d | 0.0001 |
| Ascites | 0.3891 | ||||
| Yes | 0 | 0 | 46 | 38 | |
| No | 40 | 72 | 18 | 18 | |
| Child score | - | - | 0.0112 | ||
| A | 12 | 18 | |||
| B | 19 | 24 | |||
| C | 33 | 14 | |||
| Viral load | 0 | 0.1902 | |||
| < 4 × 10⁵ | 44 (61.1) | 37 (55.2) | 29 (51.8) | ||
| ≥ 4 × 10⁵ | 28 (38.9) | 27 (44.8) | 27 (42.2) |
a Data are expressed as mean ± standard deviation or No. (%).
b significant difference from controls
c significant difference from chronic hepatitis C
d significant difference from cirhossis
4.2. Serum Levels of MicroRNA-122
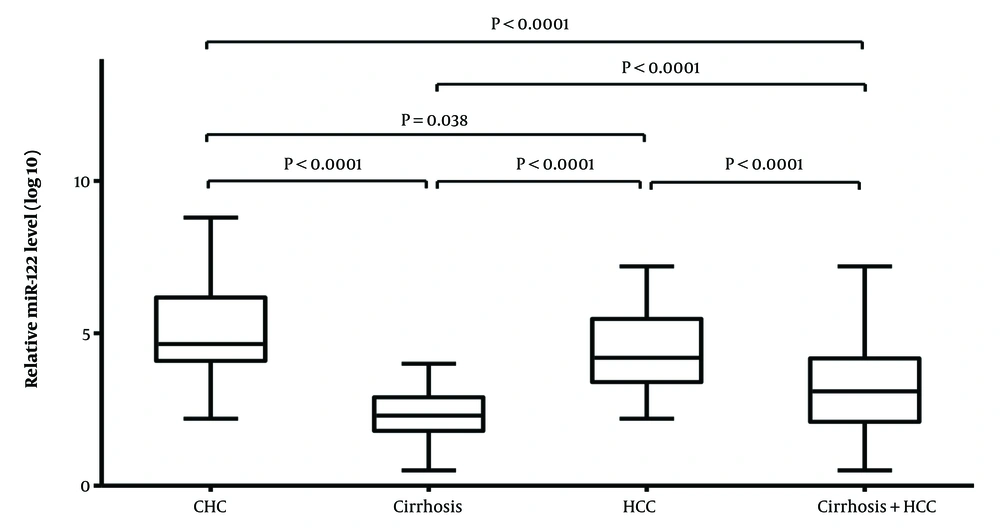
Relative quantification of serum microRNA-122 (miR-122) was carried out using U6 snRNA as a reference. The highest expression of miR-122 was found in CHC patients followed by HCC patients with mean fold changes of 5.02 ± 1.48 and 4.46 ± 1.26, respectively compared with controls. Patients with liver cirrhosis had a lesser miR-122 expression as evidenced by a fold change of 2.46 ± 0.84 in comparison to healthy controls. A significant difference in median levels (calculated using Mann-Whitney U-Test) of miR-122 expression was observed in CHC and HCC patients (P < 0.000) upon comparison with healthy control in contrast to cirrhosis patients (P = 0.511).
Mann-Whitney U-Test was also performed for serum miR-122 expression levels among different disease states in HCV-infected patients. A significant difference was found between CHC and liver cirrhosis patients (P < 0.0001) but not with HCC patients (P = 0.0446). Also, while comparing miR-122 expression for liver cirrhosis and HCC patients (P < 0.0001) a significant difference was observed. The Kruskal-Wallis test was used to evaluate the median levels of miR122 expression across the study groups, and it revealed substantial differences (P = 0.0001) between groups (Figure 1).
4.3. Receiver Operating Characteristic Curve Analysis
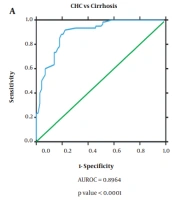
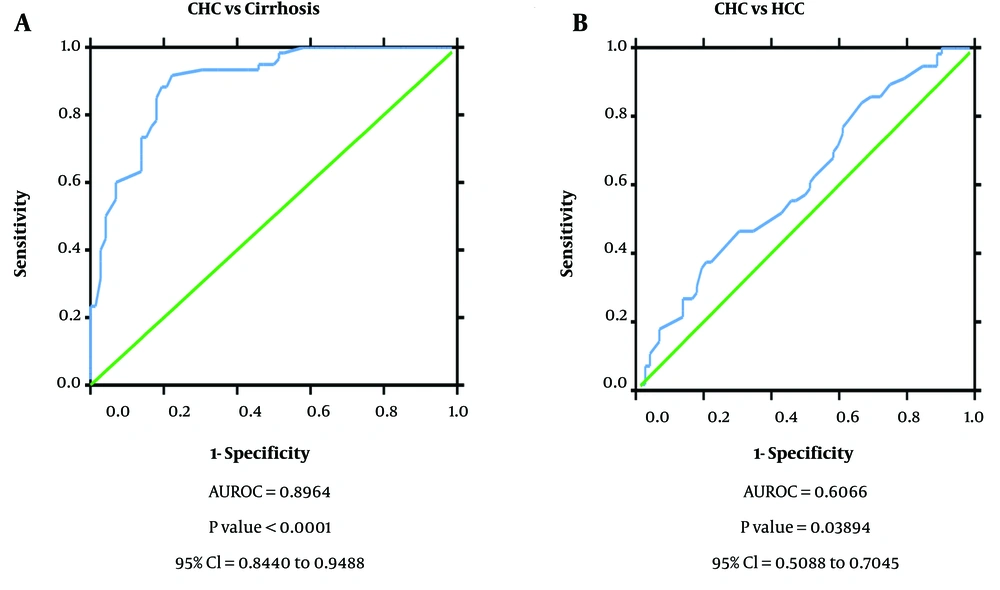
The diagnostic ability of miR-122 as a non-invasive diagnostic biomarker for HCC in HCV-infected patients was analyzed by generating ROC curves. Receiver operating characteristic analysis demonstrated that the miR-122 expression profile can efficiently distinguish CHC patients (AUROC = 0.978, P = 0.000, 95% confidence interval (CI) = 0.958 to 0.998) and HCC from healthy controls (AUROC = 0.971, P = 0.000, 95% CI = 0.944 to 0.997). However, miR-122 though had a reduced diagnostic ability to distinguish between cirrhosis and healthy controls (AUROC = 0.632, P = 0.024, 95% CI = 0.524 to 0.741). Further, ROC curve analysis also showed efficient discrimination of CHC patients from cirrhosis patients (AUROC = 0.955, P = 0.000, 95% CI = 0.925 to 0.986) but not CHC from HCC patients (AUROC = 0.584, P = 0.104, 95% CI = 0.485 to 0.684). Also, serum miR-122 level exhibits an important diagnostic value through its ability to distinguish cirrhosis patients from HCC patients (AUROC = 0.935, P = 0.000, 95% CI = 0.895 to 0.975) based on its altered expression profile in the different disease state (Figure 2).
Receiver operating characteristic curve to determine diagnostic ability of miR-122 expression to distinguish; A, chronic hepatitis C patients from cirrhosis (area under the receiver operating characteristic curve (AUROC) = 0.728, P value= 0.000, 95% confidence interval (CI) = 0.616 to 0.810); B, CLD cases from cirrhosis (AUROC = 0.931, P value= 0.000, 95% CI = 0.868 to 0.994).
4.4. MicroRNA-122 Expression and Its Association with Hepatitis C Virus Viral Load
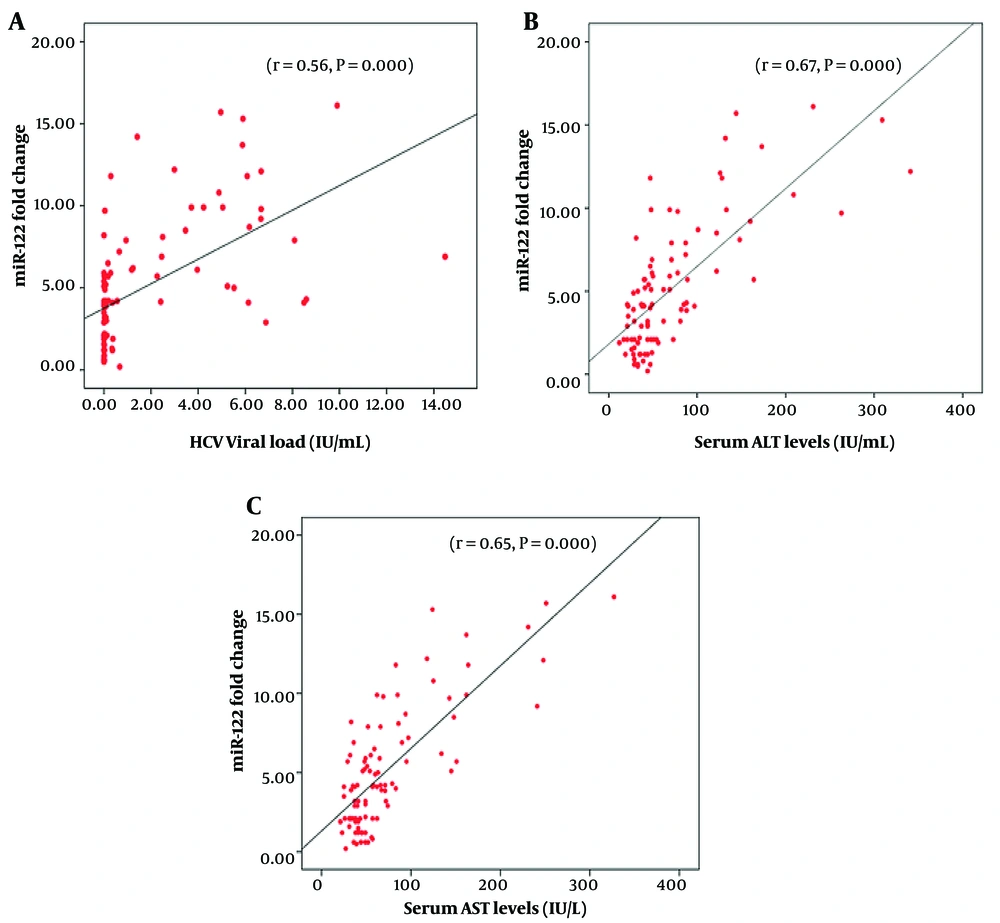
High HCV viral load was not significantly associated with the development of cirrhosis or HCC (P = 0.1908, Table 2). We analyzed the association of miR-122 expression with viral load in HCV-infected patients. Spearman rank correlation (r) analysis was used to determine the association of miR-122 expression with viral load in (r = 0.56, 95% CI = 0.400 to 0.737, P = 0.000). Viral load was plotted against miR-122 expression as shown in Figure 3A thus establishing the association of miR-122 with the aggressiveness of the disease in terms of viral load.
4.5. MicroRNA-122 Fold Change with Liver Function Tests in Hepatocellular Carcinoma Patients
To evaluate whether serum miR-122 levels correlate with serum necro-inflammatory markers ALT, AST, AST/ALT, bilirubin, and albumin in HCC patients, Spearman rank correlation (r) analysis was performed. MicroRNA-122 had significant positive correlation with serum ALT (r = 0.544, 95% CI = 0.321 to 0.709, P < 0.0001) and AST (r = 0.532, 95% CI = 0.306 to 0.701, P < 0.0001) (Figure 3A - C and Table 3).
| Parameters | Cirrhosis | Hepatocellular Carcinoma | ||
|---|---|---|---|---|
| r | P Value | r | P Value | |
| ALT (IU/L) | 0.04 | 0.74 | 0.55 | < 0.0001 |
| AST (IU/L) | 0.07 | 0.53 | 0.53 | < 0.0001 |
| Viral load | 0.14 | 0.212 | 0.21 | 0.120 |
5. Discussion
The role of miRNAs is ascertained to be vital in virus-host interactions, pathogenesis, and host resistance through the regulation of post-transcriptional or translational modification. The abundance of hepatic miR-122 has made it the most commonly targeted biomarker of liver disease including CHC infection. A non-invasive technique to recognize the severity of liver disease by circulating serum miR-122 assessment essentially can become a preferable choice of diagnosis (2, 10, 14, 18-20).
MicroRNA-122 expression levels of HCV patients are deregulated and distinct from healthy controls, thereby making miR-122 a possible biomarker (13, 15, 16, 21). Circulating miR-122 has been observed to be significantly high in the serum of CHC patients in comparison to healthy controls but most of the studies have not included HCV genotype 3 at a large scale (22). In a previous study by Chang et al. higher miR-122 was reported in PBMCs of HCV patients (23). Similar results were also reported in study conducted in HCV genotype 3 infected patients from North India, however, the number of patients analyzed was low (n = 25) (6). In contrast, hepatic and blood expression levels of miR-122 was not found to be positively correlated among HCV genotype 3 patients (24). Indeed, in the present study serum miR-122 was found two-fold higher in CHC patients compared to normal controls in the Northeast Indian population. Receiver operating characteristic curve analysis revealed miR-122 in the serum of HCV genotype 3 infected patients could be used as a diagnostic tool for HCV infection which is consistent with the previous research findings (25).
The association between hepatic miR-122 levels and the extent of liver fibrosis is not yet established. Patients with chronic HCV infection have dramatically lower levels of hepatic miR-122 expression with advancement in their liver fibrosis progresses (3, 26, 27). While in another study, liver fibrosis stage was not significantly correlated with miR-122 (2, 28). The serum miR-122 has also been previously reported as a potent diagnostic marker in determining liver injury and distinguishing viral and non-viral etiology (29, 30). In our study, ROC analysis showed that serum miR-122 can be an extremely sensitive diagnostic tool for determining the disease status in CHC patients. MicroRNA-122 has been widely implicated in the diagnosis of HCC, with higher miR-122 levels compared with controls (10, 11, 31). Recently Motawi et al. have reported non-significant differences in miR-122 expression in HCC patients with that in controls (19). In patients in the group of liver cirrhosis serum miR-122 levels were significantly reduced compared with that of CHC patients with almost a 3-fold reduction. This is in concurrence with previously reported studies and supports the notion that with hepatocyte destruction and replacement with fibrous tissue, miR-122 export from the liver decreases (10).
Several studies on HCV reported no correlation of miR-122 expression in serum with HCV viral load (3, 18, 23, 32). The expression of miR-122 in the liver and the level of HCV in the blood were inconsistent (33, 34). However, few contrasting results have been reported with the association of decreased hepatic miR-122 with increased viral load (26, 35). In HCV genotype 3 infections no correlation was found between both hepatic and serum miR-122 levels with viral load (24). Recently, Kumar et al. reported a strong correlation of miR-122 in serum with viral load in HCV genotype 3 infections (6). We also observed a significant positive correlation of miR-122 with serum HCV genotype 3 RNA levels.
Variations in miR-122 concentrations in serum or plasma have been established as more specific for liver diseases in comparison to serum transaminases, which potentially can originate from non-liver-based sources (23). Serum miR-122 concentrations were correlated with higher AST and ALT levels in Egyptian HCV genotype 4 patients and also in genotype 1 patients (10, 11). The correlation between serum miR-122 and ALT levels, however, was only present in individuals with acute hepatitis and not in those with CHC and genotype 1 infection (32). In another study the serum miR-122 and miR-21 reported a weak correlation with ALT and AST in chronic hepatitis B (CHB) and CHC patients of multiple genotypes (14). Previous studies focused on HCV genotype 3 have indicated that serum miR-122 levels were significantly higher with a strong correlation with elevated ALT, AST, and inflammatory scores (2, 6). Our study on HCV genotype 3 patients from Northeast India also followed a similar trend displaying a significant correlation of liver transaminases with serum miR-122 levels.
5.1. Conclusions
The present study may help to diagnose liver injury at an earlier stage in CHC patients. However, an elaborate study with a details analysis is highly suggested to confirm these findings. No study has previously reported on the predictive ability of serum miR-122 levels in HCV genotype 3 infected patients from Northeast India.


