1. Background
One of the effective approaches in the diagnosis and management of patients with several different cancer types is the detection of tissue or blood biomarkers. Tumor biomarkers identify the biological differences between cancer and normal conditions (1-3). For this purpose, a wide range of genes has always been studied. Recently, extensive studies have been conducted on the potential of regulatory non-coding RNAs (ncRNAs) with a length of more than 200 nucleotides to predict cancer because non-coding regions of the genome play important regulatory roles in various cellular processes, such as transcription, post-transcriptional settings, gene silencing, and DNA demethylation. Indeed, small and large ncRNAs are involved in regulating gene expression through the interaction of their specific sequences with regulatory regions. These ncRNAs fall into different categories depending on the number of nucleotides in their body (4). On the other hand, the analysis of cancer mutations throughout the genome reveals a wide range of functional mutations within the genome, both in coding and non-coding regions that have extensive effects on the expression level of genes. These mutations can be prognostic and diagnostic markers for many cancers (5, 6). Additionally, breast cancer (BC) is the most common global malignancy in women nowadays. Every year, the GLOBOCAN statistics show that approximately 1.7 million women are diagnosed with this cancer worldwide, with a related mortality rate of nearly 1 063 in Iran (7). Therefore, bioinformatics methods can help researchers worldwide to initially evaluate genes, their characteristics, and functional mechanisms. It can be said that this method plays a decisive role in facilitating the path of biological studies and ultimately leads to the identification of better molecular candidates for further studies. In this respect, based on the co-expression network of genes using the WGCNA method, this study aimed to survey a group of coding genes, especially non-coding genes involved in BC. Eventually, for the validation of those results, further laboratory tests were conducted (8-13). The selected module, based on the bioinformatics analysis, contains 103 genes, 3 of which are long ncRNAs named metastasis associated lung adenocarcinoma transcript 1 (MALAT1), nuclear enriched abundant transcript 1 (NEAT1), and X-inactive specific transcript (XIST), and 100 coding genes. One of the most critical coding genes in BC is estrogen receptor 1 (ESR1). Among those genes in the cyan module, NEAT1 as a long ncRNA, forkhead box A1 (FOXA1) as a coding gene, and RNA component of mitochondrial RNA processing endoribonuclease (RMRP) as a long ncRNA were selected for further laboratory tests due to their importance in BC based on previous studies.
2. Objectives
In other words, this study aimed at investigating the changes in the expression levels of those genes as well as their relationship with mutations in their promoter regions in a group of Iranian patients with BC so that the results can be used to confirm or reject previous hypotheses. The importance and role of the mentioned genes have been explained in detail in the discussion section.
3. Methods
3.1. Gene Expression Dataset and Pre-processing
The RNA-Seq read count data related to individuals with BC and normal samples were obtained from the UCSC Xena browser (https://xenabrowser.net/) (12). It consisted of 1 217 samples from the Cancer Genome Atlas (TCGA). In the normalization step, genes with an average expression lower than one, including genes with zero expression, were removed. Then, the edgeR package was used on the data with the trimmed mean of the M-values (TMM) method to normalize the data (9). Furthermore, the normalized data were transformed to a Log2 Scale after adding a value of one to avoid an undefined measure of log zero (10). Additionally, an outlier data detection analysis was performed.
3.2. Co-expression Network Construction and Module Extraction
The normalized gene expression matrix was filtered, using mean expression analysis, and genes with a threshold greater than 11 were selected. The weighted gene co-expression network analysis (WGCNA) R package was, then, used to reconstruct the co-expression network (11). Pairwise gene correlations were computed, using the biweight midcorrelation (bicor) measure. To create a scale-free network, the optimal power of β (R2 = 0.9) was selected. The co-expression network was reconstructed as a signed network. The min module parameter in WGCNA was set to 50, and the dynamic tree-cut method was implemented to cluster the modules. The remaining parameters in WGCNA were set to their default values. The first principal component of the expression matrix of each module was considered the module eigengene (ME), representing the gene expression profiles in the modules. The pairwise correlation of ME was calculated, and modules with correlations greater than 0.85 were merged. Finally, the modules were labeled with different colors, and the grey module contained genes that could not be placed in other modules.
3.3. Functional Enrichment Analysis
To understand the biological mechanism of genes in the extracted modules, all of the modules were enriched, using the gene ontology (GO) and Kyoto Encyclopedia of Genes and Genomes (KEGG) pathways analysis, performed with the gprofiler2 R package (12). Additionally, the DOSE package (13) was utilized for disease enrichment analysis in all modules. Finally, a module was chosen as the candidate module in BC.
3.4. Protein-protein Interaction Network Construction
The genes of the candidate module in BC were used to construct the protein-protein interaction network, using the online tool STRING v11 (https://string-db.org). Only the experimental interactions were considered, and genes without interactions were excluded. In this study, the minimum confidence score in STRING was set to 0.7, with the remaining parameters kept at their default values. The resulting gene network was visualized, using Cytoscape (version 3.9.1).
3.5. Sample Collecting
In this study, 30 formalin-fixed paraffin-embedded (FFPE) tumor tissues from patients with BC and 30 FFPE samples from adjacent normal tissues were selected for further laboratory evaluations. Informed consent was obtained from all participating subjects, including both patients and controls, and they were interviewed to gather demographic and clinical data.
The patients included in the study underwent surgical resection for BC at Imam Khomeini Hospital, Tehran University of Medical Sciences, Tehran, Iran. Only patients who had not received chemotherapy or radiotherapy were included. Clinical information, such as colonoscopy/pathology reports and follow-up data, was collected from medical records. All patients were followed up to confirm their clinical outcomes. The samples were classified based on average age, family history, tumor differentiation, progesterone/estrogen receptor (PR/ER), human epidermal growth factor receptor 2 (Her2) status, and metastasis.
The main focus of this study was to investigate the expression levels of FOXA1 and long non-coding RNAs (lncRNAs) NEAT1/RMRP in the tumor and control groups. After selecting the patients based on inclusion criteria, which included women with BC who had not undergone preoperative chemotherapy or radiotherapy, and confirming tumor histology through pathology reports, and excluding patients with prior cancers such as lymphoma or leukemia or those who received neoadjuvant chemotherapy or radiotherapy, FFPE tissue blocks were cut into 10 μm to 15 μm thick sections for mRNA extraction.
3.6. Extraction of DNA and RNA
DNA was extracted from paraffin-embedded tissues, using the Qiagen kit to determine the sequence of the gene promoter region. DNA and RNA extraction from FFPE tissues was performed, using the trizol technique, which is based on the phenol-chloroform method. To assess the quality of the extracted RNA and DNA, a 1.5% agarose gel was used. In eukaryotic samples, the observation of bands for 18s and 28s ribosomal RNA indicated the correct quality of RNA extraction. For quantification, concentration, and optical density (OD) measurement of the samples, a NanoDrop ND-1000 spectrophotometer (NanoDrop Technologies Inc., Rockland, DE, USA) was used. The A260/A280 ratio was employed to assess the purity of the DNA and RNA, and values within the range of 1.8-2.0 were considered acceptable.
3.7. Reverse Transcription
The synthesis of cDNAs was carried out, using the PrimeScript RT Reagent kit (Takara, Shiga, Japan), following the manufacturer's protocol. First, the RNA was incubated at 65 °C for 5 minutes, followed by rapid freezing for 3 minutes. For every 500 ng of RNA, 2 µL of buffer, 0.5 µL of random hexamers primer, 0.5 µL of RT enzyme, and 10 mL of RNase-free water were used.
The reaction was performed, using the Perkin–Elmer Gene Amp PCR System 2400. The reverse transcription reaction was conducted at 37 °C for 15 minutes, followed by a brief incubation at 85 °C for 5 seconds. The resulting cDNA was stored at -70 ºC for future use.
3.8. Real-time PCR Analysis
Quantitative real-time reverse transcription-PCR was performed, using an ABI Step One RT-PCR thermal cycler (ABI Stepone, NY, USA) and a SYBR premix Ex Taq II kit (TaKaRa Biotechnology). The primers for FOXA1, lncRNA RMRP, lncRNA NEAT1, and the housekeeping gene GAPDH were designed, using primer Express software version 3.0.1 (Applied Biosystems, CA) and the IDT primer Quest Tool (Table 1). The PCR reaction was carried out in a final volume of 20 mL, which included 0.8 mL of each primer, 2 mL of cDNA template, 10 mL of SYBR premix Ex Taq II (Tli RNaseH Plus) (2×), 0.4 mL of ROX Reference Dye (50×), and 6 mL of sterile distilled water. The thermal profile for the PCR consisted of an initial denaturation step at 95 ºC for 30 s, followed by 40 cycles of denaturation at 95 ºC for 5 s and annealing/extension at 60 ºC for 34 s. The relative expression levels of the target genes were determined by normalizing to GAPDH, using the 2 -ΔΔCT method. Each measurement was performed in triplicate to ensure the accuracy and reliability of the results. Also, it should be noted that in this project, the primers were specifically designed as exon junction primers to target the intended regions. In addition, DNase was also used in the extraction phase to prevent DNA contamination.
| Forkhead box A1 | |
| Forward | 5'- ACTGTGAAGATGGAAGGGCA-3' |
| Reverse | 5'- CCGCTCGTAGTCATGGTGTT-3' |
| Promoter region (forward) | 5'-GAAGAGGAAGCCCAGAGC-3' |
| Promoter region (reverse) | 5'-GTAGGTGCGAGCGTCTTT-3' |
| Forward | 5´- TGG AGG AGT CAG GAG GAA TAG -3´ |
| Nuclear enriched abundant transcript 1 | |
| Reverse | 5´- GGC ATG GAC AAG TTG AAG ATT AG -3´ |
| Promoter region (forward) | ATC GTC CCG TTG AGC AAT GA-3´-5´ |
| Promoter region (reverse) | CAT CCC TCC CTG TCG CTA AC-3´-´5 |
| Forward | CTACACACTGAGGACTCTGTTC-3´-5´ |
| RNA component of mitochondrial RNA processing endoribonuclease | |
| Reverse | CAGCGGGATACGCTTCTT-3´-5´ |
| Promoter region (forward) | ACTCTCTGCCCGAGGTC-3´ -5´ |
| Promoter region (reverse) | -TAGTCTTAGAAAGTTATGCCCGAAA- 3´ 5´ |
| Forward | 5´-ACAACTTTGGTATCGTGGAAGG-3´ |
| Reverse | 5´-GCCATCACGCCACAGTTTC-3´ |
3.9. DNA Sequencing
The promoter region sequencing method was employed to explore the relationship between mutations in the promoter region of these genes and changes in expression levels in the studied samples. DNA fragments of FOXA1, NEAT1, and RMRP measuring 245 bp, 96 bp, and 235 bp, respectively, were amplified, using the specific primers listed in Table 1. Two samples from the positive metastasis group, exhibiting the highest expression changes, were selected for this analysis. To visualize the digested fragments, the PCR products were separated on a 2% agarose gel and stained with ethidium bromide. Subsequently, direct sequencing was performed, using fluorescent dideoxy sequencing on an ABI sequencing 3130 XL instrument, following the manufacturer's instructions. The single-strand PCR products were subjected to direct sequencing, using the BigDyeTM Terminator v3.1 cycle sequencing kit and the ABI 3130XL genetic analyzer (Applied Biosystems). Finally, the resulting electropherograms were processed, using Lasergene software version 6 (DNASTAR) for analysis of the sequencing data.
3.10. Statistical Analysis
The mRNA expression levels of tumor tissues were reported as the mean ± standard deviation (SD). The differences in mRNA and lncRNA expression levels of FOXA1, RMRP, and NEAT1 genes among the established groups, including tumor differentiation grade, metastasis, and Her2 status were assessed, using One-way ANOVA and Mann-Whitney U analysis. All statistical analyses were conducted, using IBM SPSS Statistics software version 23 (IBM, SPSS, Chicago, IL, USA). Statistical significance was considered achieved when the P-value was less than 0.05 (P < 0.05).
4. Results
4.1. Gene Expression Dataset and Pre-processing
The read count data for BC samples was obtained from the Xena browser. This dataset consists of 1 104 primary solid tumor samples and 113 solid tissue normal samples. The demographic characteristics of the samples can be found in Table 2.
| Sample Type | No. of Samples | Sex (Male/Female) | Age | Age Range | Vital Status (Alive/ Dead) | Stage | Race |
|---|---|---|---|---|---|---|---|
| Primary tumor | 1104 | 13/1091 (1.18% - 98/02%) | 58.36 | 20 - 90 | 947/157 (85.78% - 14.22%) | I. 182 (16.49%); II. 628 (56.89%); III. 250 (22.64%); IV. 20 (1.81%); NA. 24 (2.17%) | Asian 61 (5.53%); Black 183 (16.58%); White 764 (69.19%); NA 96 (8.70%) |
| Solid tissue normal | 113 | 1/112 (0.88% - 99.12%) | 57.33 | 20 - 90 | 69/44 (61.06% - 38.94%) | _ | Asian 1 (0.88%); Black 6 (5.31%); White 105 (92.93%); NA 1 (0.88%) |
The downloaded dataset was normalized, using TMM. Then, the ensemble ids were converted into gene symbols. Finally, 28 638 genes were identified for further analysis. Also, a quality control analysis was performed, and no outlier sample was detected.
4.2. Co-expression Network Construction and Module Extraction
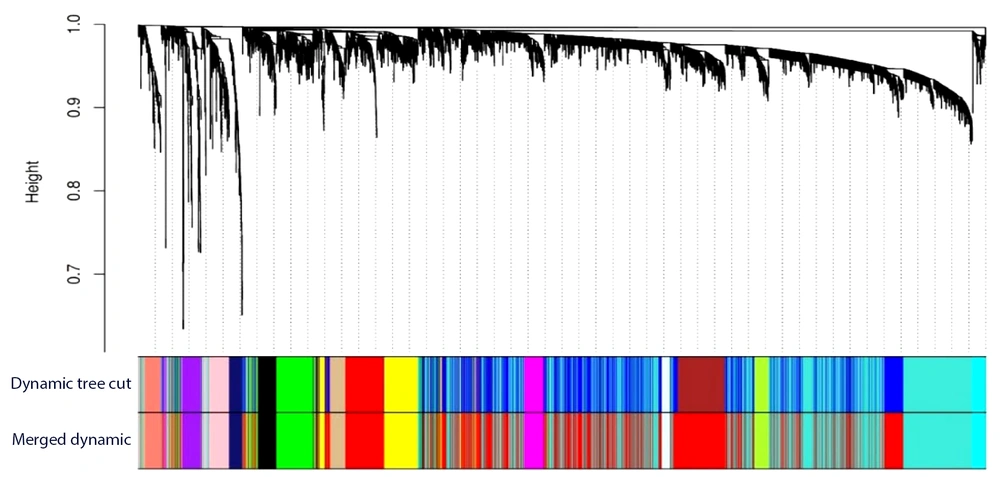
The genes with a mean expression lower than 11 were filtered out, resulting in a selection of 5 366 genes as the input data for the WGCNA. To ensure a scale-free network, the power β was set to 17. Subsequently, 15 modules were extracted, each containing a varying number of genes ranging from 57 to 1 870. The hierarchical clustering of the identified modules is depicted in Figure 1.
4.3. Functional Enrichment Analysis
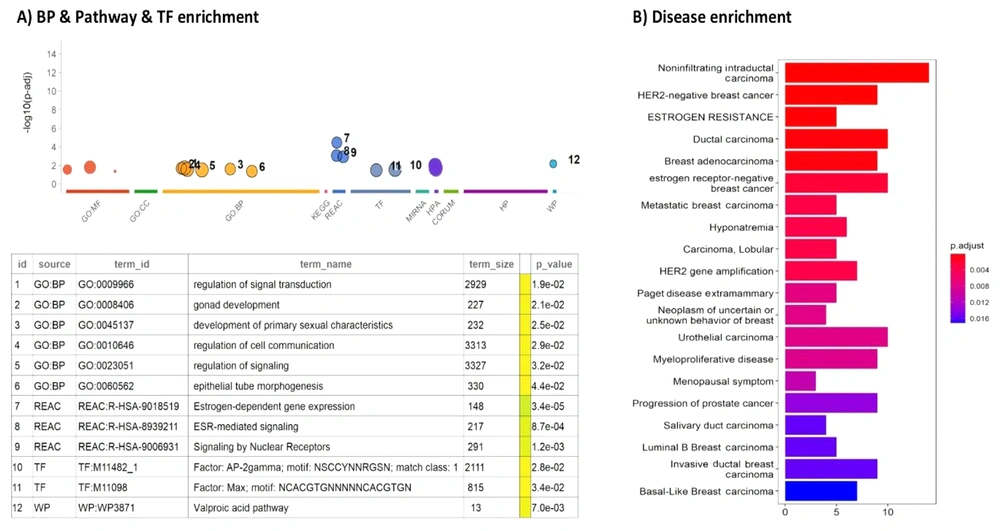
The identification of 15 modules in BC led to the selection of a specific module, the cyan module, as a potential candidate. To further evaluate the functional significance of the genes within this module, enrichment analysis was performed, using gprofiler2. This analysis aimed at assessing the enrichment of gene sets associated with various biological processes, pathways, and BC-related diseases within the genes of the cyan module.
The results of the gene enrichment analysis for the cyan module are presented in Figure 2. The cyan module consists of 103 genes, 100 of which are protein-coding genes, while 3 genes, namely MALAT1, NEAT1, and XIST, are ncRNAs. The cyan module exhibited significant enrichment in various biological processes and pathways relevant to BC.
For a comprehensive list of genes within the cyan module, please refer to Appendix 1 in the Supplementary File.
Enrichment analysis of genes in the cyan module. A, most prevalent enriched biological processes (BP), pathways (including KEGG and reactome), transcription factors (TF), and Wikipedia pathways (WP) associated with the genes in the cyan module; B, list of disease enrichment in the cyan module, with the color of bars indicating the degree of significance of enrichment items
4.4. Protein-protein Interaction Network Construction and Identification of Modules
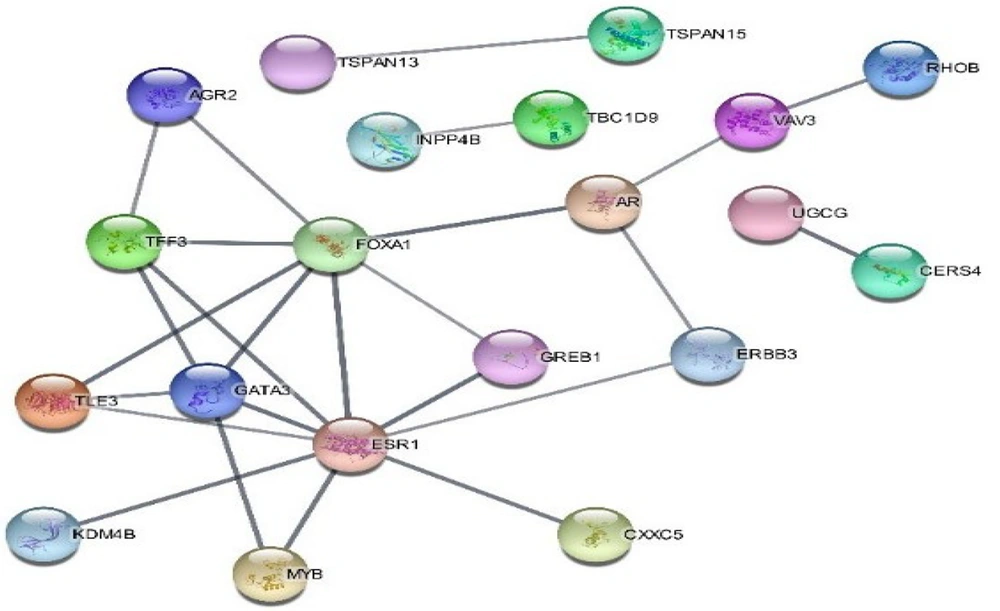
One hundred and three genes of the cyan module were inserted into the STRING database to extract the PPI network. The constructed network includes 20 and 25 nodes and edges, respectively. The average node degree in the network is 0.451, and the PPI enrichment P-value is 2.69e-07. The PPI network using Cytoscape was visualized, and the network is represented in Figure 3. Estrogen receptor 1 and FOXA1 are the most degrees in the PPI network with 9 and 7 links, respectively. So, among these genes, FOXA1 and two ncRNAs, one of which is in the cyan module, were validated and investigated in vitro step.
4.5. Clinical and Pathological Characteristics of Patients
Demographic and clinical characteristics of BC tissue samples is shown in Table 3.
| Sample Type | No. of Samples | Sex (Male/Female) | Range Age | Average Age | Vital Status (Alive/ Dead) | PR Status (+/-) | ER Status (+/-) | Human Epidermal Growth Factor Receptor 2 Status (+/-) | Metastasis Status (+/-) | Family History (+/-) | Tumor Differentiation Status (1,2,3,4) |
|---|---|---|---|---|---|---|---|---|---|---|---|
| Primary tumor/ solid tissue normal | 30/30 | 0/30 (0% - 100%) | 25 - 78 | 55.3 | 27/3(90% - 10%) | 9/21(30% - 70%) | 12/18(40% - 60%) | 8/22(26.6% - 73.3%) | 8/22(26.6% - 73.3%) | 17/13(56.6% - 43.3%) | 7(23.3%) - 11(36.6%) - 10(33.3%) - 2(6.6%) |
4.6. Gene Expression Analysis
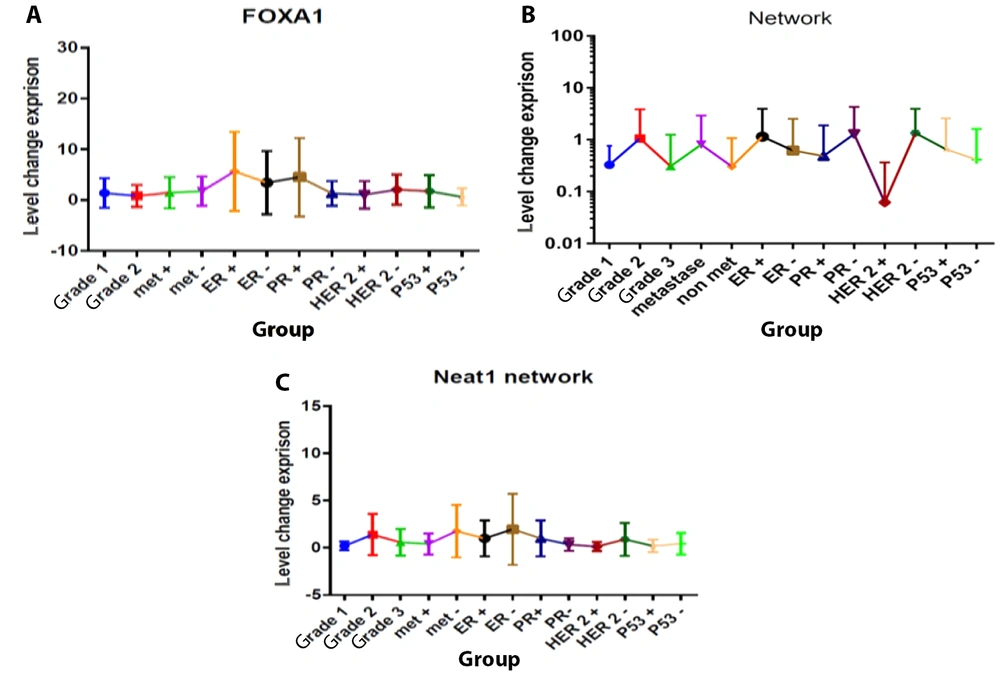
Based on the results obtained by the real-time PCR method, the expression levels of FOXA1 gene, RMRP, and NEAT1 lncRNAs were significantly upregulated in the tumor group compared to the control group (respectively, P = 0.044, P = 0.014, and P = 0.0004) (Figures 1 , 2, and 3).
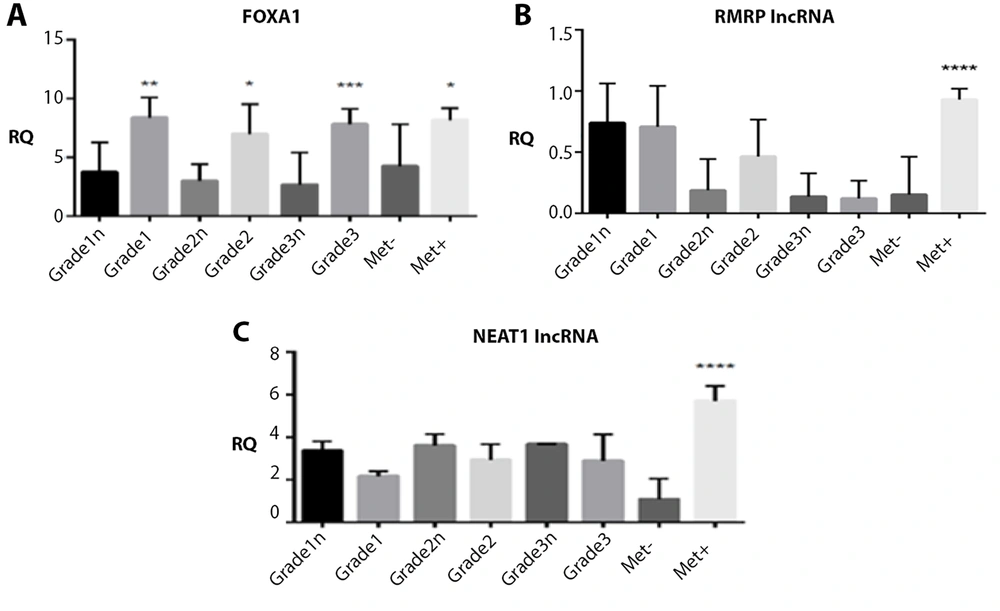
Details about the mean values of relative expressions of FOXA1, RMRP, and NEAT1 and their relationship with pathological factors including tumor differentiation and metastasis have been demonstrated in Figures 4 to 6.
Relative quantification (RQ) established by RT-qPCR analysis. Gene expression levels of forkhead box A1 (FOXA1) A, RNA component of mitochondrial RNA processing endoribonuclease (RMRP); B, and nuclear enriched abundant transcript 1 (NEAT1); C, genes differed significantly between patients with tumor samples and normal.
Forkhead box A1 (FOXA1) mRNA, RNA component of mitochondrial RNA processing endoribonuclease (RMRP), nuclear enriched abundant transcript 1 (NEAT1), relative quantification (RQ) established by RT-qPCR analysis according to tumor differentiation (histological grade) and metastasis status between tumor and normal samples.
Forkhead box A1 (FOXA1) mRNA A, RNA component of mitochondrial RNA processing endoribonuclease (RMRP); B, nuclear enriched abundant transcript 1 (NEAT1); C, relative quantification (RQ) established by RT-qPCR analysis compared to the expression level of other tumor markers in the total statistical population.
The expression levels of the FOXA1 gene showed a significant increase in patients with grades I, II, and III compared to normal samples, as well as in patients with positive metastases compared to those with negative metastases (P < 0.05, Figure 5). According to Figure 5, the gene expression levels of RMRP varied significantly between patients with and without metastasis. Tumors from patients with positive metastasis displayed higher levels of RMRP expression compared to those from negative metastasis samples (P < 0.05, Figure 5). Additionally, the NEAT1 gene was significantly upregulated in patients with metastasis compared to negative samples. Tumors from patients with positive metastasis exhibited approximately a 6-fold higher level of NEAT1 expression compared to those from negative metastasis samples (P < 0.05, Figure 5). No other statistically significant correlations were found between tumor differentiation grade and the expression levels of RMRP and NEAT1.
4.7. Sequencing Analysis for Mutation Status of the Patients
To investigate the mutation status in the promoter region of FOXA1, RMRP, and NEAT1, and its relationship with the expression levels of these genes in patients, direct sequencing was performed on genomic DNA extracted from FFPE samples in all cases, using the Deoxyfluorescent method. Our analysis revealed that none of the patients had mutations in the promoter region of these genes. As a result, no correlation was found between the expression levels of these genes and the presence of mutations in their promoter regions. However, to draw accurate conclusions, further studies with a larger sample size are required.
5. Discussion
As mentioned, this research focused on the in vitro evaluation and validation of three genes: Forkhead box A1 as a coding gene, NEAT1, and RMRP as long ncRNAs known to be involved in BC. These genes were selected based on previous research and their potential as diagnostic biomarkers, particularly for their relevance to BC. Additionally, it is worth noting that there are other important genes within the cyan module that are also associated with BC.
Approximately 75% of all BCs are hormone receptor-positive (HR+), specifically estrogen receptor-positive (ER+) (14). The ESR1 gene, located on chromosome 6, is a coding gene that encodes the estrogen receptor (ER) and functions as a transcription factor (15). Consequently, the rate of estrogen exposure can serve as a risk factor for ER+ BC. Higher levels of estrogen expression can lead to an increased number of ER receptors, which ultimately contributes to the excessive proliferation of breast epithelial cells. Therefore, based on the bioinformatics analysis conducted in this study, ESR1 is identified as a crucial gene for BC diagnosis (16).
Forkhead box A1 is a molecular candidate that can serve as a biomarker for assessing the degree of tumorigenesis in patients with BC. It is located on the long arm of chromosome 14 and is associated with the expression of ERα+, PR+, and GATA3 proteins, as well as endocrine signaling in BC (17, 18). This gene is recognized as an oncogenic factor in hormone ER cancers, and mutations in its promoter region result in increased expression by enhancing the binding of E2F, a transcription factor (19). Forkhead box A1 plays a role in enhancing luminal differentiation, gene methylation, and the overexpression of the ER gene in BC. Similar to our investigation, several studies have reported elevated levels of FOXA1 gene and protein expression in BC compared to normal mucosa, suggesting its potential as a diagnostic biomarker (20-25). Previous studies have also demonstrated a correlation between upregulated FOXA1 gene expression and metastatic status as well as increased dysplasia grade in BC (26, 27), which aligns with the findings of our study. Based on these results, FOXA1 gene expression contributes to BC progression through intricate mechanisms and holds promise as a potential diagnostic biomarker for the disease.
XIST is the first identified lncRNA known for its primary role in chromosome X inactivation. Over time, researchers have conducted numerous studies on this lncRNA, uncovering its crucial roles in various types of human cancers. Based on these studies, XIST has been found to have oncogenic roles in many cancers, including lung, gastric, glioma, pancreatic, and others. However, interestingly, in BC, certain osteosarcomas, and a specific type of hepatic cancer, XIST acts as a tumor suppressor (28). In a series of studies, the tumor suppressor function of XIST has been elucidated, primarily attributed to its role as a sponge for miR-155, which targets CDX1, a gene associated with angiogenesis. Through this mechanism, XIST inhibits cell growth (29). Given these findings, XIST is recognized as another member of the Cyan module and represents a promising candidate for further validation through laboratory studies.
RNA component of mitochondrial RNA processing endoribonuclease is a lncRNA that encodes a component of mitochondrial RNA-processing endoribonuclease RNA. It can be isolated from mitochondrial RNA at a primary site of mitochondrial DNA replication and is also activated in the nucleolus during the final stage of 5.8S rRNA processing. The mutation of RMRP was first discovered in cartilage-hair hypoplasia (CHH), which led to the down-regulation of this lncRNA in CHH. RNA component of mitochondrial RNA processing endoribonuclease also interacts with the telomerase reverse transcriptase catalytic subunit to form a ribonucleoprotein complex that produces double-stranded RNAs and acts as a small intervention RNA (30, 31).
The lncRNA RMRP is a tumor promoter, and its upregulation has been observed in many cancers, such as breast, gastric, and bladder cancers (32-34). Previous studies have shown that the upregulation of the RMRP gene can increase cell growth and invasion by targeting miR-1-3p in non-small-cell lung cancer and induce the overexpression of c-MYC by sponging miR-34a-5p to promote cell growth and inhibit apoptosis in multiple myeloma (35, 36). Qi et al. indicated that the RMRP gene increases the proliferation, migration, and invasion of triple-negative BC via the miR-766-5p/YAP1 axis and suggested the RMRP gene as a novel target for BC treatment (37). In line with previous studies, our present study showed the overexpression of the RMRP gene in BC (32). Additionally, a significant difference in the expression of the RMRP gene between HER2+ and HER2- tumors was found. These findings suggest that the overexpression of the RMRP gene is an important factor in breast carcinogenesis.
Nuclear enriched abundant transcript 1 is a lncRNAs located in the nucleus and associated with Paraspeckles and nuclear domains. It plays a role in the maintenance of nuclear mRNA. This gene is a transcript of the multiple endocrine neoplasia locus, located on chromosome 11, and is expressed structurally in many non-neural tissues and cells (33). Nuclear enriched abundant transcript 1 is a key regulator of gene expression through the conservation of nuclear mRNA and transcription factors. It also serves as a regulatory biomarker in breast morphogenesis (34). The pivotal role of the BRCA1/lncRNA NEAT1 signaling pathway has also been identified in tumorigenesis and carcinogenesis (35). Long non-coding RNAs NEAT1 can enhance cell proliferation and growth in several cancers, including colorectal, pancreatic, and BC (36-39). It has been reported that LncRNA NEAT1 can promote epithelial-mesenchymal transition (EMT) in BC by regulating cell proliferation, migration, and invasion (39). Yan et al. found that the upregulation of the NEAT1 gene was correlated with advanced-stage and lymph node metastasis. Additionally, they considered the NEAT1 gene as a biomarker for the detection of BC (34, 40, 41). In the present investigation, a significant overexpression of the NEAT1 gene in breast tumors compared to normal tissues and in metastatic tumors was observed. In conclusion, the findings from our study suggest that the NEAT1 gene may play a crucial role in BC progression. Additionally, our results indicate that the NEAT1 gene has the potential to serve as a diagnostic biomarker for BC. Further investigations are necessary to elucidate the underlying mechanisms, by which NEAT1 influences BC development and to evaluate its potential clinical utility as a diagnostic marker.
Metastasis associated lung adenocarcinoma transcript 1, also known as nuclear-enriched abundant transcript 2 (NEAT2), is a highly abundant lncRNAs found on human chromosome 11, primarily located in the nucleus. It has been observed that MALAT1 interacts with the spliceosome protein complex, influencing splicing processes (42-44). However, previous investigations have produced divergent results regarding the role of MALAT1 in cancer. Some studies have shown that MALAT1 is upregulated in various cancers, promoting tumor metastasis (45). On the other hand, another group of studies has indicated that MALAT1 acts as a tumor suppressor in BC, inhibiting cell migration and metastasis. Considering these contradictory findings, further research is needed to evaluate the potential of MALAT1 as a diagnostic biomarker for BC (46, 47).
Breast cancer at advanced stages, particularly stage IV, is often accompanied by metastasis, where cancer spreads to distant organs. In contrast, at earlier stages (I and II), the cancer primarily affects the breast tissue and neighboring areas. Accurate staging of the disease is crucial for effective disease management. Identifying genes that act as prognostic markers for each stage can greatly assist in patient care (48). In this study, it was observed that the expression levels of all three genes were elevated in the metastatic group compared to patients at other stages, suggesting their potential as promising metastasis markers. However, due to the limited sample size in this experiment, further investigations are needed to determine their prognostic value. Conducting larger-scale studies is essential to thoroughly investigate their potential as prognostic markers for BC.
5.1. Conclusions
Previous studies have established the significance of certain lncRNAs in BC progression. In the present investigation, the overexpression of the FOXA1 gene and lncRNAs RMRP and NEAT1 was observed in BC tumors with high-grade dysplasia and metastasis, as demonstrated in laboratory experiments. These findings suggest that the FOXA1, RMRP, and NEAT1 genes may serve as potential biomarkers for detecting BC progression. However, further research is required to validate this concept and determine the clinical utility of these genes as biomarkers for BC detection and monitoring.
