1. Background
Cancer is the second most common cause of mortality worldwide, accounting for approximately 10 million deaths in 2020 (1). Meanwhile, kidney cancer is the 14th most prevalent cancer globally, with over 431 000 newly diagnosed cases and 179 000 deaths in 2020, accounting for 2.4% of all cancers. The age-standardized incidence and mortality rates of kidney cancer worldwide are 4.6 and 1.8 per 100 000, respectively (2). The incidence of kidney and ureter cancers differs across the world (3-5). Developed countries have a higher incidence of kidney cancer than less developed countries (6), with the highest incidence rate in North American countries (age-standardized incidence rate: 12.2 per 100 000), Northern Europe, Australia, and New Zealand (10.3 per 100 000), and lowest in Central Africa (1.0 per 100 000) and Southern Central Asia (1.4 per 100 000) (7). Although the incidence of kidney and ureter cancer is on the rise, especially in developed countries (5), the relative survival rate of kidney cancer has remarkably increased in the past 3 decades (8, 9). Half of the cases of kidney cancer worldwide are diagnosed before the age of 65 years. The incidence of kidney cancer continuously increases with age, peaking at 75 years (10, 11). Several lifestyle-related risk factors, such as obesity, smoking, low consumption of fruits and vegetables, and sedentary lifestyle, increase the risk of kidney cancer (10-12).
Although few epidemiological studies have been conducted on kidney cancer in Iran, it is one of the most prevalent urological cancers with a rising trend among Iranian men and women (13-15). Kidney cancer is the 17th most prevalent cancer in Iran, accounting for 1.2% of all cancers and 1% of cancer-related deaths (16). The age-standardized incidence rate in Iran has been estimated at 1.94 and 1.36 in men and women, respectively (14). Kidney cancer is one of the 10 cancers with a high incidence rate among the southern Iranian population (17). Studies in Isfahan (Iran) reported the prevalence of kidney and ureteral cancers to be 8.1 and 0.4 per 100 00, respectively (18), and showed that urinary and kidney cancers had a rising trend of incidence, mortality, and prevalence in this region (19). In a study conducted in northern Iran, the standardized incidence of kidney and ureter cancer among women was 0.14 and 0.39, respectively (20). According to a meta-analysis, kidney cancer incidence in Iranians is comparatively lower than in several other Asian nations, including South Korea, Turkey, and Mongolia. However, it is higher compared to countries such as Indonesia, Turkmenistan, and Kyrgyzstan (14).
Assessing and monitoring the incidence of cancers within a population is crucial to effectively track the burden of this disease and plan resources accordingly. By observing shifts in cancer rates over time, we can gain valuable insights into its historical progression, identify potential social and environmental risk factors contributing to its development, and evaluate the effectiveness of interventions and policies to reduce its impact (21). Studies examining the epidemiology and incidence of kidney and ureter cancers in Iran are mainly regional and focus on specific periods. Besides, few Iranian studies have reported the incidence and trend of variations in these cancers. With regard to these gaps in the literature, this study was conducted to investigate the trend of the incidence rate of kidney and ureter cancer in Iran from 2004 to 2016.
2. Objectives
In the present study, we aimed at investigating the trend of the incidence rate of kidney and ureter cancer in Iran from 2004 to 2016.
3. Methods
In this study, information on kidney and ureter cancer incidence (19 659 patients), which included variables such as name, age, grading, year of diagnosis, and province, was extracted from the Iran National Cancer Registry System (INCRS); the data cover a period of 13 years (2004 - 2016). The International Classification of Diseases for Oncology-Third Edition (ICD-O 3rd) codes C64.9 and C65.9 were assigned for kidney cancer and C66.9 for ureter cancer. Tumor grade was categorized into I (well-differentiated), II (moderately-differentiated), III (poorly-differentiated), IV (un-differentiated), and unknown. Based on neighborhood and socio-demographic status, the provinces of Iran were categorized into 12 regions, including Tehran (Tehran, Ghazvin, and Alborz), Mashhad (North Khorasan, Razavi Khorasan, and South Khorasan), Kermanshah (Kermanshah, Kurdistan, and Ilam), Hamadan (Hamadan and Lorestan), Ahvaz (Khuzestan), Kerman (Kerman and Sistan & Baluchestan), Rasht (Gilan), Sari (Mazandaran, Golestan, and Semnan), Isfahan (Isfahan, Yazd, Chaharmahal & Bakhtiari), Tabriz (East Azerbaijan, West Azerbaijan, Ardabil, and Zanjan), Qom (Qom and Markazi), and Shiraz (Fars, Bushehr, Hormozgan and Kohgiluyeh & Boyer-Ahmad). After cleaning the data, kidney cancer and ureter cancer incidence rates were calculated for each year according to age groups, tumor grades, and regional centers.
3.1. Data Source and Preparation
All kidney and ureter cancer cases were pathologically confirmed and registered in the NCR database (the data were collected from pathology centers, hospitals, and death registries).
This study used NCR data to investigate the trend of the incidence rate of kidney and ureter cancer in Iran from 2004 to 2016. The Iranian NCR, which is overseen by the Ministry of Health, is responsible for collecting data from all provinces in the country.
Due to the high volume of cancer cases reported by these centers, there is a significant risk of errors during data entry. As a result, all data undergo thorough checking, correcting, and cleaning procedures. These procedures typically span 5 to 6 years before the data are deemed fit for publication. In this study, the dataset was subjected to additional quality control measures in addition to the standard checking procedures performed by the NCR. Before analysis, thorough checks were conducted to identify any duplicate cases or errors within the dataset.
3.2. Statistical Analysis
To calculate the incidence rate, the mid-year populations for each age group of the Iranian population in different years from 2004 to 2016 were provided by the Iran National Statistics Center. The population count for different years was estimated based on the 2006 and 2011 national censuses. After factoring in the average annual growth rate of the country and provinces, census data were used to estimate the population for other years as follows: 2006 (2004 - 2010) and 2011 (2012 - 2016).
The crude and age-specific incidence rates (ASIR) were calculated and, then, the age-standardized rate (ASR) was measured by the World Health Organization (WHO) standard population. Age groups were < 20, 20 to 29, 30 to 39, 40 to 49, 50 to 59, 60 to 69, 70 to 79, and ≥ 80 years. The Joinpoint Regression based on the Log-linear Model examined the trend for different years, and Annual Percent Change described the results (APC). The analysis for the trend was performed by the Joinpoint Regression Program 4.9.0.1.
4. Results
This cross-sectional study was conducted on 19 474 patients with kidney cancer, and 625 patients with ureter cancer were diagnosed between 2004 and 2016. This study shows that both cancers have the highest number of cases in the 60 to 69 age group. Most cases of both cancers were registered in 2016, with 2 443 cases of kidney cancer and 70 cases of ureter cancer (Table 1).
| Variables | No. (%) | |
|---|---|---|
| Kidney Cancer | Ureter Cancer | |
| Age groups | ||
| < 20 | 1380 (7.1) | 4 (0.6) |
| 20 - 29 | 442 (2.3) | 8 (1.3) |
| 30 - 39 | 1242 (6.4) | 13 (2.1) |
| 40 - 49 | 2784 (14.3) | 43 (6.9) |
| 50 - 59 | 4694 (24) | 113 (18.1) |
| 60 - 69 | 7094 (36.4) | 327 (52.3) |
| 70 - 79 | 1183 (6.1) | 74 (11.8) |
| ≥ 80 | 114 (0.6) | 9 (1.4) |
| Missing | 541 (2.8) | 34 (5.5) |
| Total | 19474 (100) | 625 (100) |
| Year of diagnosis | ||
| 2004 | 703 (3.6) | 30 (4.8) |
| 2005 | 903 (4.6) | 37 (5.9) |
| 2006 | 1044 (5.4) | 37 (5.9) |
| 2007 | 1112 (5.7) | 22 (3.5) |
| 2008 | 1178 (6) | 32 (5.1) |
| 2009 | 1350 (6.9) | 41 (6.6) |
| 2010 | 1320 (6.8) | 38 (6.1) |
| 2011 | 1707 (8.8) | 45 (7.2) |
| 2012 | 1571 (8.1) | 62 (9.9) |
| 2013 | 1732 (8.9) | 68 (10.9) |
| 2014 | 1978 (10.2) | 33 (5.3) |
| 2015 | 2020 (10.4) | 61 (9.8) |
| 2016 | 2443 (12.5) | 70 (11.2) |
| Missing | 413 (2.1) | 49 (7.8) |
| Total | 19474 (100) | 625 (100) |
| Tumor grades | ||
| I | 1760 (9) | 140 (22.4) |
| II | 3266 (16.8) | 108 (17.3) |
| III | 1950 (10) | 182 (29.1) |
| IV | 386 (2) | 17 (2.7) |
| Unknown | 12112 (62.2) | 178 (28.5) |
| Total | 19474 (100) | 625 (100) |
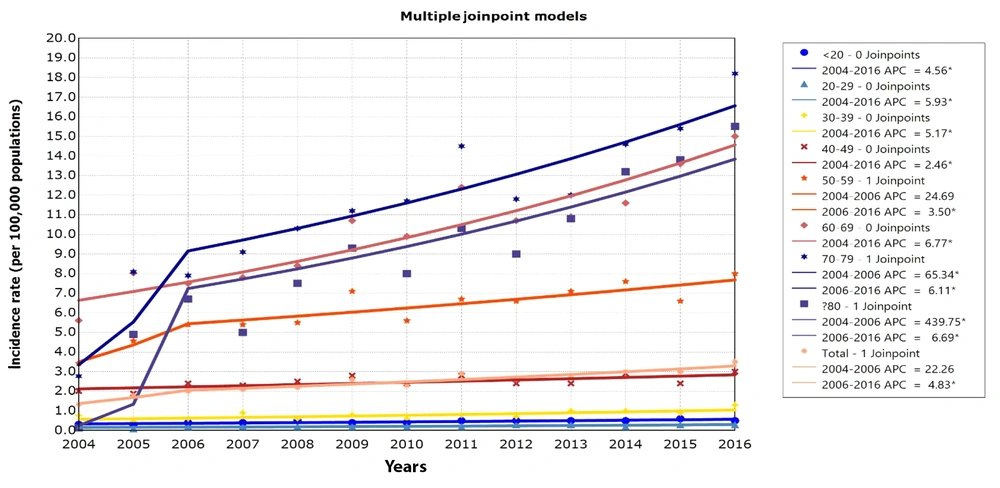
The crude and ASR of kidney cancer increased from 0.98 and 1.33 per 100 000 population in 2004 to 3.1 and 3.5 per 100 000 population in 2016, respectively (Table 2). The national ASR of kidney cancer APC was 22.26% (P > 0.05, Figure 1) from 2004 to 2006 and 4.83% (P < 0.05, Figure 1) from 2006 to 2016. The highest ASR of kidney cancer was observed in the age group of 70 to 79 years. The ASR in this age group increased from 2.78 per 100 000 in 2004 to 18.2 per 100 000 in 2016 (APC 2004 - 2006, 65.34%, P < 0.05; and APC 2006 - 2016, 6.11%, P < 0.05; Figure 1).
| Age Groups | 2004 | 2005 | 2006 | 2007 | 2008 | 2009 | 2010 | |||||||
|---|---|---|---|---|---|---|---|---|---|---|---|---|---|---|
| Crude Rate | ASR a | Crude Rate | ASR | Crude Rate | ASR | Crude Rate | ASR | Crude Rate | ASR | Crude Rate | ASR | Crude Rate | ASR | |
| < 20 | 0.26 | 0.31 | 0.25 | 0.3 | 0.4 | 0.4 | 0.4 | 0.4 | 0.4 | 0.5 | 0.4 | 0.4 | 0.3 | 0.4 |
| 20 - 29 | 0.2 | 0.2 | 0.09 | 0.09 | 0.2 | 0.2 | 0.2 | 0.2 | 0.2 | 0.2 | 0.2 | 0.2 | 0.2 | 0.2 |
| 30 - 39 | 0.76 | 0.77 | 0.45 | 0.46 | 0.6 | 0.6 | 0.9 | 0.9 | 0.6 | 0.6 | 0.8 | 0.8 | 0.6 | 0.6 |
| 40 - 49 | 2 | 2.01 | 1.87 | 1.88 | 2.4 | 2.4 | 2.3 | 2.3 | 2.4 | 2.5 | 2.8 | 2.8 | 2.3 | 2.4 |
| 50 - 59 | 3.35 | 3.42 | 4.57 | 4.57 | 5.4 | 5.4 | 5.3 | 5.4 | 5.4 | 5.5 | 7.0 | 7.1 | 5.5 | 5.6 |
| 60 - 69 | 5.61 | 5.61 | 8.12 | 8.03 | 7.5 | 7.5 | 7.8 | 7.8 | 8.4 | 8.4 | 10.7 | 10.7 | 9.8 | 9.9 |
| 70 - 79 | 2.78 | 2.77 | 8.18 | 8.09 | 7.9 | 7.9 | 9.1 | 9.1 | 10.3 | 10.3 | 11.2 | 11.2 | 11.7 | 11.7 |
| ≥ 80 | 0.16 | 0.13 | 5.47 | 4.9 | 12.5 | 6.7 | 9.3 | 5.0 | 7.7 | 7.5 | 9.3 | 9.3 | 8.0 | 8.0 |
| Total | 0.98 | 1.33 | 1.25 | 1.79 | 1.5 | 2.0 | 1.6 | 2.1 | 1.6 | 2.2 | 1.9 | 2.6 | 1.8 | 2.3 |
| Age Groups | 2011 | 2012 | 2013 | 2014 | 2015 | 2016 | - | |||||||
| Crude Rate | ASR | Crude Rate | ASR | Crude Rate | ASR | Crude Rate | ASR | Crude Rate | ASR | Crude Rate | ASR | - | - | |
| 20 - 29 | 0.5 | 0.5 | 0.5 | 0.5 | 0.5 | 0.5 | 0.5 | 0.5 | 0.6 | 0.6 | 0.5 | 0.5 | - | - |
| 30 - 39 | 0.2 | 0.2 | 0.3 | 0.3 | 0.3 | 0.3 | 0.2 | 0.2 | 0.3 | 0.3 | 0.3 | 0.3 | - | - |
| 40 - 49 | 0.8 | 0.8 | 0.6 | 0.7 | 1.0 | 1.0 | 1.0 | 1.0 | 0.9 | 0.9 | 1.3 | 1.3 | - | - |
| 50 - 59 | 2.8 | 2.8 | 2.4 | 2.4 | 2.4 | 2.4 | 2.9 | 2.9 | 2.3 | 2.4 | 3.0 | 3.0 | - | - |
| 60 - 69 | 6.6 | 6.7 | 6.5 | 6.6 | 7.1 | 7.1 | 7.6 | 7.6 | 6.6 | 6.6 | 8.0 | 8.0 | - | - |
| 70 - 79 | 12.3 | 12.4 | 10.6 | 10.7 | 10.9 | 10.9 | 11.6 | 11.6 | 13.4 | 13.6 | 14.9 | 15.0 | - | - |
| ≥ 80 | 14.5 | 14.5 | 11.8 | 11.8 | 12.0 | 12.0 | 14.6 | 14.6 | 15.5 | 15.4 | 18.2 | 18.2 | - | - |
| 20 - 29 | 10.3 | 10.3 | 9.0 | 9.0 | 10.8 | 10.8 | 13.3 | 13.2 | 13.8 | 13.8 | 15.5 | 15.5 | - | - |
| Total | 2.3 | 2.9 | 2.1 | 2.6 | 2.3 | 2.7 | 2.5 | 3.0 | 2.6 | 3.0 | 3.1 | 3.5 | - | - |
a Age-standardized incidence rate using the WHO world standard population (in 100 000 people).
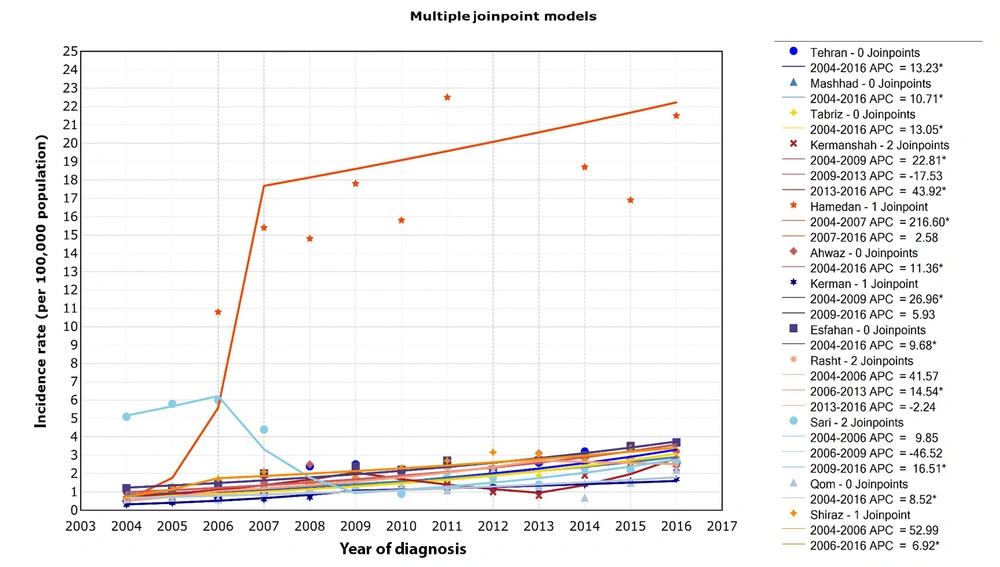
In general, the ASR of kidney cancer has been increasing over 13 years (Appendix 1). Among the different regional centers of Iran, the highest incidence rate of kidney cancer was observed in Hamedan, northwest Iran. The incidence rate in Hamedan increased from 0.7 per 100 000 in 2004 to 21.5 per 100 000 in 2016 (APC 2004 - 2007, 216.60%, P < 0.05; and APC 2007 - 2016, 2.58%, P > 0.05; Figure 2).
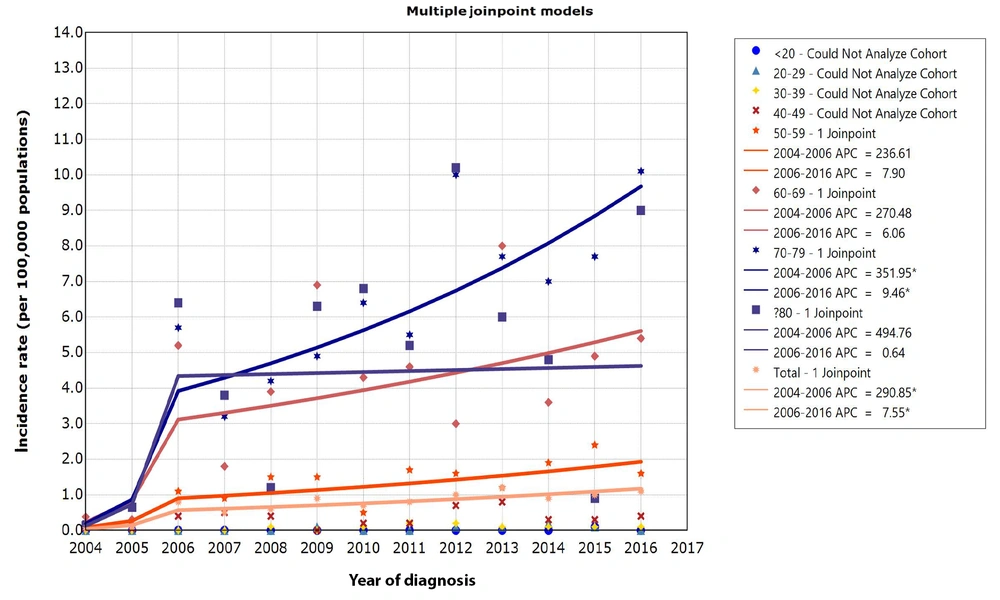
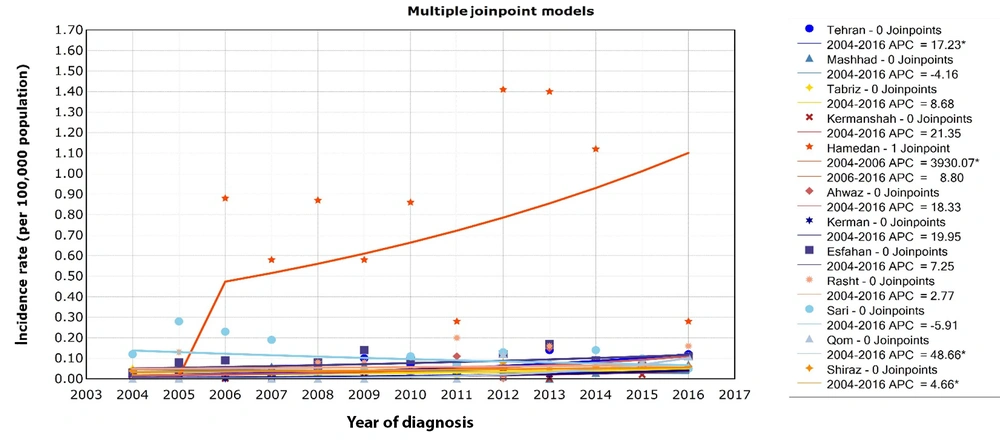
The crude and ASR of ureter cancer increased from 0.04 and 0.05 per 100 000 population in 2004 to 0.9 and 1.1 per 100 000 population in 2016, respectively (Table 3). The national ASR of ureter cancer APC was 290.85% (P < 0.05, Figure 3) from 2004 to 2006 and 7.55% (P < 0.05, Figure 3) from 2006 to 2016. The highest incidence of ureter cancer in 2016 belongs to the age group of 70 to 79. The incidence rate of ureter cancer in the age group of 70 to 79 years increased from 0.22 in 2004 to 10.1 per 100 000 population in 2016 (APC 2004 - 2006, 351.95%, P < 0.05; and APC 2006 - 2016, 9.46%, P < 0.05; Figure 3). Figure 4 shows the 13-year ureter cancer incidence rate (per 100 000 population) by regional centers in Iran from 2004 to 2016. The highest incidence of ureter cancer was observed in Hamedan Province (APC 2004 - 2006, 3930.07%, P < 0.05; and APC 2006 - 2016, 8.80%, P > 0.05; Figure 4).
| Age Groups | 2004 | 2005 | 2006 | 2007 | 2008 | 2009 | 2010 | |||||||
|---|---|---|---|---|---|---|---|---|---|---|---|---|---|---|
| Crude Rate | ASR a | Crude Rate | ASR | Crude Rate | ASR | Crude Rate | ASR | Crude Rate | ASR | Crude Rate | ASR | Crude Rate | ASR | |
| < 20 | 0 | 0 | 0 | 0 | 0 | 0 | 0 | 0 | 0 | 0 | 0 | 0 | 0 | 0 |
| 20 - 29 | 0 | 0 | 0 | 0 | 0 | 0 | 0 | 0 | 0 | 0 | 0.1 | 0.1 | 0 | 0 |
| 30 - 39 | 0 | 0 | 0 | 0 | 0 | 0 | 0 | 0 | 0.1 | 0.1 | 0 | 0 | 0.1 | 0.1 |
| 40 - 49 | 0.07 | 0.07 | 0.05 | 0.05 | 0.4 | 0.4 | 0.5 | 0.5 | 0.4 | 0.4 | 0 | 0 | 0.2 | 0.2 |
| 50 - 59 | 0.11 | 0.1 | 0.17 | 0.17 | 1.1 | 1.1 | 0.8 | 0.9 | 1.5 | 1.5 | 1.4 | 1.5 | 0.5 | 0.5 |
| 60 - 69 | 0.38 | 0.38 | 0.3 | 0.3 | 5.3 | 5.2 | 1.8 | 1.8 | 3.8 | 3.9 | 6.9 | 6.9 | 4.2 | 4.3 |
| 70 - 79 | 0.22 | 0.22 | 0.67 | 0.66 | 5.5 | 5.7 | 3.2 | 3.2 | 4.2 | 4.2 | 4.9 | 4.9 | 6.6 | 6.4 |
| ≥ 80 | 0.16 | 0.13 | 0.63 | 0.65 | 7.7 | 6.4 | 4.4 | 3.8 | 1.4 | 1.2 | 7.3 | 6.3 | 7.1 | 6.8 |
| Total | 0.04 | 0.05 | 0.05 | 0.08 | 0.5 | 0.8 | 0.3 | 0.5 | 0.4 | 0.6 | 0.6 | 0.9 | 0.5 | 0.7 |
| Age Groups | 2011 | 2012 | 2013 | 2014 | 2015 | 2016 | - | |||||||
| Crude Rate | ASR | Crude Rate | ASR | Crude Rate | ASR | Crude Rate | ASR | Crude Rate | ASR | Crude Rate | ASR | - | - | |
| 20 - 29 | 0 a | 0 | 0 | 0 | 0 | 0 | 0 | 0 | 0.1 | 0.1 | 0 | 0 | - | - |
| 30 - 39 | 0 | 0 | 0.1 | 0.1 | 0.1 | 0.1 | 0.2 | 0.2 | 0.1 | 0.1 | 0 | 0 | - | - |
| 40 - 49 | 0.2 | 0.2 | 0.2 | 0.2 | 0.1 | 0.1 | 0.1 | 0.1 | 0.1 | 0.1 | 0.1 | 0.1 | - | - |
| 50 - 59 | 0.2 | 0.2 | 0.7 | 0.7 | 0.8 | 0.8 | 0.3 | 0.3 | 0.3 | 0.3 | 0.4 | 0.4 | - | - |
| 60 - 69 | 1.6 | 1.7 | 1.6 | 1.6 | 1.2 | 1.2 | 1.9 | 1.9 | 2.4 | 2.4 | 1.6 | 1.6 | - | - |
| 70 - 79 | 4.7 | 4.6 | 2.9 | 3 | 7.8 | 8 | 3.7 | 3.6 | 4.8 | 4.9 | 5.2 | 5.4 | - | - |
| ≥ 80 | 5.4 | 5.5 | 9.8 | 10 | 7.8 | 7.7 | 6.8 | 7 | 7.8 | 7.7 | 10.2 | 10.1 | - | - |
| 20 - 29 | 5.4 | 5.2 | 10.5 | 10.2 | 6.1 | 6 | 4.9 | 4.8 | 1 | 0.9 | 9.1 | 9 | - | - |
| Total | 0.6 | 0.8 | 0.8 | 1 | 0.9 | 1.2 | 0.7 | 0.9 | 0.8 | 1 | 0.9 | 1.1 | - | - |
a Age-standardized incidence rate using the WHO world standard population (in 100 000 people).
The 13-year trends of ureter cancer age-standardized incidence rate (per 100 000 population) by age group in Iran from 2004 to 2016. APC: Annual Percent Change. * Indicates that the Annual Percent Change (APC) is significantly different from zero at the alpha = 0.05 level. #in age groups < 20, 20 - 29, 30 - 39, and 40 - 49 most of the records for a cohort have zero counts, then the cohort is NOT processed.
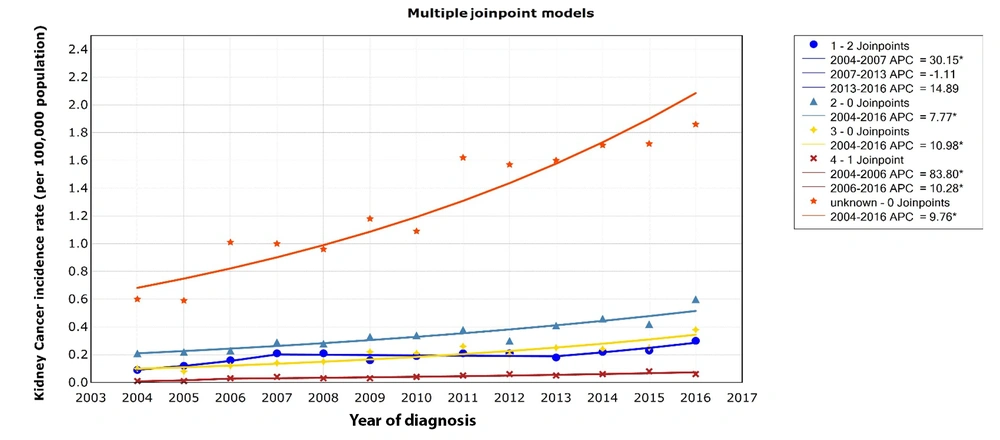
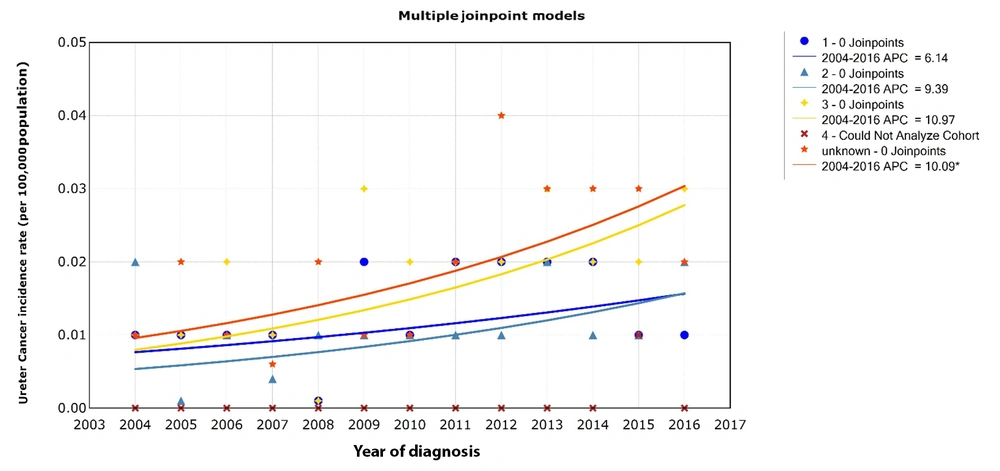
Figures 5 and 6 show the 13-year trends of kidney and ureter cancer incidence rates (per 100 000 population) by tumor grade in Iran from 2004 to 2016. The highest incidence rate (per 100 000 population) of both cancers belongs to the unknown grade (Appendix 2) (APC of kidney cancer 2004 - 2016, 9.76%, P < 0.05; Figure 5 and APC of ureter cancer 2004 - 2016, 10.09%, P < 0.05; Figure 6).
The 13-year trends of kidney cancer incidence rate (per 100 000 population) by tumor grades in Iran from 2004 to 2016. APC: Annual Percent Change. * Indicates that the Annual Percent Change (APC) is significantly different from zero at the alpha = 0.05 level. #in tumor grade 4, most of the records for a cohort have zero counts, then the cohort is NOT processed.
5. Discussion
This study presented an updated incidence rate profile of kidney and ureter cancers in Iran and its provinces over 13 years. According to the findings of this research, firstly, the ASR of kidney and ureter cancers has generally been increasing over the past 13 years. Secondly, the age range of 70 to 79 years showed the largest ASR of kidney and ureter cancers. Thirdly, Hamedan Province reported the greatest incidence of kidney and ureter cancers.
The results of this study indicated that the incidence rate of kidney and ureter cancers had an increasing trend over 13 years, which is similar to the results of other studies conducted in Iran (15, 18). Xu et al. showed that over the past 30 years, the ASIR of kidney cancer has tripled in China (22). The studies indicated an increasing trend for kidney cancer incidence globally, particularly in European countries (23, 24). Several studies have indicated that the increasing incidence of kidney cancer in recent decades is related to the improvement of diagnostic tools, smoking, high body mass index, occupational exposure to trichloroethylene, and the aging population (22-26). An increasing trend in both cancers in this study may be due to the age growth of the population, improving the cancer registration system, earlier diagnosis of the disease, and increasing the frequency of cancer risk factors such as obesity and smoking (27).
In this study, similar to other studies conducted in Iran and some other countries, the highest incidence rate was observed in the age group over 60 years (6, 15, 28). This result is in line with the study that shows the highest incidence of urologic cancers in the north of Iran and is among the age group over 60 years (20). Goodarzi et al. also indicated that the highest incidence rates of kidney cancer are in patients aged 75 years and older (29). Iran is classified as a developing country and has an aging population. Age is a key risk factor for cancer, as there are multiple biological changes associated with the natural aging process that can contribute to this disease. Due to the continuously aging population of Iran, the number of older individuals diagnosed with cancer is rising significantly (30).
The results of the meta-analysis study showed that among the provinces of Iran, Fars and Ardabil provinces have the highest incidence of kidney cancer, and Kerman Province has the lowest incidence of kidney cancer in both genders (14). In the current study, the Hamedan region had the highest incidence of kidney and ureter cancers, and the Kerman region had the lowest incidence of both cancers over 13 years. This difference may be related to the prevalence of risk factors, such as smoking, high BMI, low physical activity, hypertension, environmental and occupational risk factors, population’s socioeconomic status, lifestyle, and the existence of other illnesses and malignancies (6, 31); however, this claim requires further investigation.
5.1. Conclusions
The results of this study showed that the incidence rate of kidney and ureter cancer in Iran from 2004 to 2016 has an increasing trend. Hence, the implementation of epidemiological studies in various regions and provinces is crucial for gaining a comprehensive and precise understanding of the underlying causes influencing the incidence of kidney and ureter cancers. This will ultimately facilitate targeted and measurable interventions to effectively address this health concern.

