


1. Background
Renal cell carcinoma (RCC) is an aggressive cancer prevalent worldwide, constituting 2% to 3% of all cancers (1, 2). It predominantly affects men in the range of 60 and 70 years of age (1). Typically, surgery in the form of partial or radical nephrectomy is the preferred treatment for localized RCC. After surgical treatment, disease recurrence is observed in 10% to 50% of patients with a poor prognosis (3). It is crucial to identify novel preoperative markers that can help predict tumor behavior, thereby playing an important role in the prognostication of renal tumors. Also, it is crucial to consider the prognostic factors for RCC, such as age, performance status, tumor stage, histological subtypes, tumor necrosis, and WHO-ISUP grade to make informed treatment decisions (4).
It is known that the development and progression of cancer are often influenced by systemic inflammation, which is also a predictor of oncological prognosis. Certain inflammatory markers obtained from blood samples, including neutrophil to lymphocyte ratio (NLR), PLR, and LMR have been identified as prognostic markers for RCC (5, 6).
Platelets are essential in hemostasis and maintaining blood vessel integrity. The MPV, or mean platelet volume, is commonly used as a measure of platelet activation and is frequently associated with inflammatory disorders and advanced cancer stages. This value is a routine component of a complete blood count (CBC) and is readily available for analysis (7). Prokopowicz et al. concluded that out of the several parameters analyzed as potential prognostic factors, only MPV and platelet count (PC) could predict the prognosis in non-metastatic RCC (8). Plateletcrit (PCT) represents the volume occupied by platelets in the blood and is derived using the formula plateletcrit (PCT) = platelet count (PC) × mean platelet volume (MPV)/10 000. The typical range for PCT is between 0.22% and 0.24% (9). PCT is closely linked to platelet count and has significant clinical implications. Previous studies have examined its role in Crohn’s disease, and acute cholecystitis, as well as its relationship with varicocele (10-12). It has already been used as a biomarker for predicting survival in patients with non-small cell lung cancer and papillary thyroid carcinoma (13, 14). However, there is limited research on the PCT’s relationship with RCC.
2. Objectives
Our study aimed at determining the predictive abilities of PCT and NLR in patients with RCC, who underwent partial or radical nephrectomy, specifically in predicting tumor stage and pathological grade.
3. Methods
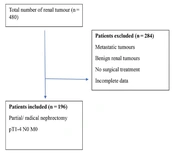
A retrospective data analysis of T1-4, N0, and M0 RCC who underwent partial or radical nephrectomy between January 2016 and December 2022 was conducted. Individuals with severe inflammatory conditions, hematologic disease, and distant metastasis were excluded (Figure 1). CBC analysis reports of the study group and tumor pathological details were obtained from the medical records department. Then, the NLR and PCT values were calculated, using the formula: Absolute neutrophil count divided by absolute lymphocyte count and platelet count × MPV / 10 000, respectively. The patients were separated into two categories depending on their T-stage (T1 - T2 and T3 - T4) and pathological grade (G1 - 2 and G3 - 4). The NLR and PCT were compared between the groups. The study compared the NLR, PCT, and their combined values to determine their role in predicting aggressiveness based on pathological stage and grade of tumors.

Flowchart of patients who met the inclusion criteria.
3.1. Statistical Analysis
In this study, quantitative variables were summarized, using the median (range), while categorical variables were described in terms of frequency and percentages. The diagnostic efficacy of NLR and PCT for advanced stage and high grade was assessed by analyzing the receiver operating characteristic (ROC) curves. Also, binary logistic regression was used to combine inflammatory markers and calculate the AUC, sensitivity, specificity, negative predictive value (NPV), and positive predictive value (PPV). Youden index was utilized to calculate the cut-off values to categorize the parameters. Additionally, the relationship between NLR and PCT with other clinical variables such as age, sex, stage, grade, size, tumor necrosis, type of nephrectomy (radical or partial), and histological subtype were analyzed. Normal distribution variables were compared by independent t test and percentage variables and the chi-square test. A P-value of < 0.05 was considered statistically significant. The study utilized jamovi 2.3.28 software for conducting statistical analyses.
4. Results
A total of 196 cases of RCC, confirmed through a histopathological analysis meeting the inclusion criteria, were studied. Table 1 displays the demographic details of the patients and their histopathology results. Out of the total patients, 128 (65.30%) were in the G1 - 2 group, while 68 (34.69%) were in the G3 - 4 group. Furthermore, 108 (55.10%) patients had a T1 - T2 tumor, while 88 (44.89%) patients had a T3 - T4 tumor.
| Parameters | Values |
|---|---|
| Number of patients | 196 |
| Mean age (y) | 57.6 ± 11.4 |
| Median tumor size (cm) | 6.50 ± 2.80 |
| Sex | |
| Male | 130 (66.32) |
| Female | 66 (33.67) |
| Laterality | |
| Right | 106 (54.08) |
| Left | 90 (45.91) |
| Histology | |
| Clear cell RCCs | 174 (88.78) |
| Nonclear cell RCCs (papillary, medullary, rhabdoid, and sarcomatoid) | 22 (11.22) |
| Operation type | |
| Radical | 172 (87.75) |
| Partial | 24 (12.24) |
| Median NLR | 3.405 |
| Median PCT | 0.217 |
| Pathological tumour stage | |
| T1 - T2 | 108 (55.10) |
| T3 - T4 | 88 (44.89) |
| WHO-ISUP grade | |
| G1 - G2 | 128 (65.30) |
| G3 - G4 | 68 (34.69) |
Demographic Details of the Patients and Their Histopathology Results a
The mean NLR and PCT cut-off values for the T stage were 2.108 and 0.273, respectively, while for the G group, they were 2.237 and 0.252. Tables 2 and 3 provide the tumor stages and pathological grades sensitivity, specificity, PPV, and NPV values associated with NLR and PCT values and their combined values. The study found that NLR values greater than 2.108 and PCT ratios greater than 0.273 were significant predictors of a high pathological T stage. Additionally, a PCT ratio greater than 0.252 was a statistically significant predictor of high grade. However, an NLR value greater than 2.237 was not found to be a significant predictor of high grade. Table 4 shows the relationship between NLR and PCT between clinicopathological characteristics of patients.
| Stage Group | AUC | Sensitivity, % | Specificity, % | PPV, % | NPV, % | Youden's Index | Cut-Point | P- Value |
|---|---|---|---|---|---|---|---|---|
| PCT | 0.577 | 29.55 | 88.89 | 68.42 | 60.76 | 0.184 | 0.273 | 0.031 |
| NLR | 0.603 | 90.91 | 37.04 | 54.05 | 83.33 | 0.279 | 2.108 | 0.006 |
| Combined | 0.636 | 88.9 | 29.5 | 60.8 | 68.4 | - | 0.5 | 0.015 |
| Stage Group | AUC Difference | CI (Lower) | CI (Upper) | P-Value | ||||
| PCT vs NLR | 0.026 | -0.088 | 0.139 | 0.657 | ||||
Best Cut-Off Values, In Which PCT and NLR Can Predict Tumor Stage, Sensitivity, Specificity, PPV, and NPV
| Grade Group | AUC | Sensitivity, % | Specificity, % | PPV, % | NPV, % | Youden's Index | Cut-Point | P-Value |
|---|---|---|---|---|---|---|---|---|
| PCT | 0.592 | 44.12 | 81.25 | 55.56 | 73.24 | 0.254 | 0.252 | 0.022 |
| NLR | 0.555 | 82.35 | 39.06 | 41.79 | 80.65 | 0.214 | 2.237 | 0.098 |
| Combined | 0.597 | 93.8 | 5.8 | 65.2 | 33.3 | - | 0.5 | < 0.001 |
| Grade Group | AUC Difference | CI (Lower) | CI (Upper) | P-Value | ||||
| PCT vs NLR | -0.037 | -0.152 | 0.077 | 0.524 | ||||
Best Cut-Off Values, in Which PCT and NLR Can Predict WHO-ISUP Grade, Sensitivity, Specificity, PPV, and NPV
| Variables | N | NLR | P-Value | PCT | P-Value |
|---|---|---|---|---|---|
| Age (y) | 0.031 | 0.503 | |||
| < 60 | 112 | 4.714 ± 0.413 | 0.227 ± 0.005 | ||
| > 60 | 84 | 6.486 ± 0.765 | 0.234 ± 0.008 | ||
| Gender | 0.053 | 0.105 | |||
| Female | 66 | 4.365 ± 0.422 | 0.241 ± 0.007 | ||
| Male | 130 | 6.036 ± 0.571 | 0.224 ± 0.006 | ||
| Type of nephrectomy | 0.297 | 0.024 | |||
| Partial | 24 | 6.616 ± 1.058 | 0.200 ± 0.009 | ||
| Radical | 172 | 5.314 ± 0.44 | 0.234 ± 0.005 | ||
| Size (cm) | 0.357 | 0.843 | |||
| < 7 | 122 | 5.767 ± 0.553 | 0.231 ± 0.007 | ||
| > 7 | 74 | 4.990 ± 0.578 | 0.229 ± 0.006 | ||
| Stage | 0.063 | 0.058 | |||
| T1 - T2 | 108 | 4.788 ± 0.495 | 0.221 ± 0.006 | ||
| T3 - T4 | 88 | 6.315 ± 0.667 | 0.240 ± 0.007 | ||
| Grade | 0.454 | 0.023 | |||
| G1 - G2 | 128 | 5.250 ± 0.475 | 0.222 ± 0.005 | ||
| G3 - G4 | 68 | 5.894 ± 0.765 | 0.245 ± 0.010 | ||
| Histopathology subtype | 0.052 | 0.290 | |||
| Non-clear cell | 22 | 7.705 ± 1.836 | 0.215 ± 0.006 | ||
| Clear cell | 174 | 5.191 ± 0.394 | 0.232 ± 0.005 | ||
| Tumor necrosis | 0.029 | 0.044 | |||
| No | 62 | 4.170 ± 0.418 | 0.215 ± 0.007 | ||
| Yes | 134 | 6.077 ± 0.558 | 0.237 ± 0.006 |
Relationship Between NLR and PCT Between Clinicopathological Characteristics of Patients a
5. Discussion
The purpose of this research was to investigate the relationship between PCT and the clinicopathological features in patients with non-metastatic RCC, who underwent surgery. Furthermore, this study aimed at comparing these findings with those of the commonly employed inflammatory marker NLR.
The literature has shown a correlation between the pathological grade and tumor stages of patients diagnosed with RCC after radical or partial nephrectomy and their NLR and PLR values (15, 16). The results of our study indicate that preoperative PCT may be used as a biomarker to predict higher stages and grades of RCC in patients, who undergo curative resections. There was no correlation between PCT and NLR, indicating them to be independent inflammatory response markers. We found that combining the scores of PCT and NLR has enhanced the prognostic ability of each parameter, especially in identifying high grades. As far as we know, this study is one of the earliest to examine the link between PCT and clinicopathological features in individuals with RCC.
It is recognized that platelets have a crucial role in the progression and dissemination of malignancies (17). Platelet indices are cost-effective, reproducible, and easily accessible in clinical settings. There is increasing evidence that platelet indices could be used as markers to diagnose and predict the behavior of various types of cancer (18).
Platelets in the bloodstream can clump together and adhere to the walls of blood vessels and tumor cells. This facilitates the evasion of tumors from the immune system of the body. Upon activation, platelets release microparticles that contain growth factors that can promote the growth of tumors (19). Furthermore, the endothelial lining of tumor blood vessels can promote platelet adherence, and when stimulated, these cells can accelerate neovascularization. Cytokines directly impact the production and size of platelets, as well as the maturation of bone marrow cells, megakaryopoiesis, and thrombopoiesis. However, platelets are consumed at a higher rate in cases of inflammation or cancer, leading to fluctuations in platelet count. Therefore, platelet count alone may not always be a reliable indicator of disease progression (20).
Larger platelets can be easily stimulated and depleted in the tumor microenvironment, leading to a change in the MPV of circulating platelets. MPV levels act as an early indicator of platelet activation, and reductions in MPV have been observed in a few cases of neoplasm or tissue proliferation (21). While higher MPV levels are typically associated with infectious diseases, diabetes, or obesity, it is important to note that MPV changes can also indicate serious health conditions (22). Studies have shown that analyzing each parameter separately is not as effective as using it together, which takes into account both the quantity and morphology of platelets (22).
In ROC curve analysis, a larger AUC indicates a better diagnostic efficiency. Kisa E et al. found that PCT had a significant association with a high stage of RCC, whereas it was not associated with a high grade of tumor (23). Concordantly, when we used ROC curves to analyze the performance of PCT and NLR for distinguishing higher stage and grade of tumor, we found that high PCT was significantly associated with high stage and grade. For the stage group, even though the AUC of NLR was higher, along with better sensitivity and specificity, the comparison between NLR and PCT was statistically insignificant. On combining NLR and PCT values, AUC was higher but with poor sensitivity compared to NLR alone. For the grade group, the AUC of PCT was higher and was statistically significant, unlike that of NLR. Also, we found out that on combining NLR with PCT, AUC increased with better sensitivity. There was no significant difference in the predictive ability between NLR and PCT in predicting grade group, though. Therefore, we believe that PCT may be a useful marker for the prognostication of RCC. Patients with high grade and stage of cancer showed significantly higher PCT values, which is evident by higher PCT values linked to radical nephrectomy rather than partial nephrectomy and were also associated with tumor necrosis, indicating a more aggressive tumor biology. It is currently unclear why elevated levels of PCT are associated with aggressive tumor biology. One possibility is that this association could be due to PCT's relationship with platelet activation (24). These results suggest that assessing clinicopathological characteristics of RCC with platelet index has potential prognostic importance. Accordingly, we believe that utilizing PCT as a biomarker for RCC could be a promising approach. It is a simple and cost-effective parameter that has the potential to be used in a prognostic system for RCC.
5.1. Limitations
This study is limited by its retrospective design, which may not fully address certain confounding factors and could lead to a degree of deviation. Moreover, pathology results were evaluated by multiple uropathologists; so, conclusions must be validated by large-scale multicenter clinical studies. Finally, we were unable to conduct follow-ups with patients, who had RCC and assess their disease recurrence or post-surgery status.
5.2. Conclusions
This research establishes the pivotal role of inflammation in the development of RCC. Combining the PCT and NLR scores has enhanced each parameter's prognostic ability, specifically for identifying high grades. It is recommended that PCT values be included in prognostic models for future studies.
