1. Background
Glioma, a type of cancer that affects the brain and is characterized by the formation of malignant tumors, continues to be a major public health challenge (1-3). Among all the forms of glioma, the high-grade form, glioblastoma (GBM), is considered to be particularly challenging to treat and has a low five-year survival rate of just 5.8% (4-6). Despite the existing therapeutic interventions, the median survival rate for patients diagnosed with GBM remains limited to approximately 14 months, which underscores the exigency for the development of novel and efficacious treatment modalities (5, 7, 8).
To develop new treatments for GBM, it is essential to understand the underlying mechanisms that contribute to its progression. In recent years, redox regulation has been identified as a critical factor in the growth and proliferation of GBM cells (9-11). The redox status within tumors fluctuates in response to diverse intracellular physiological mechanisms (9, 12-14). Proliferating cells necessitate a predominantly reduced state compared to differentiated cells. Alterations in the intracellular redox milieu play pivotal roles in regulating cellular processes such as the cell cycle and apoptosis. The intracellular redox balance is primarily modulated by redox coenzymes, notably NAD(P)H/NAD(P) and the concentrations of reduced glutathione (GSH) and oxidized glutathione (GSSG) (15-17). Furthermore, thioredoxin and its associated proteins serve as disulfide-bonded reductases responsible for preserving the intracellular redox equilibrium (18).
Thioredoxin domain containing 12 (TXNDC12), a member of the thioredoxin superfamily and an oxidase-encoding gene, has previously been shown to play a role in the development of hepatocellular and gastric cancers, but its role in GBM has not been fully explored until now (19, 20). The aim of this study was to provide new insights into the function of TXNDC12 in GBM by conducting a comprehensive analysis of multiple datasets. The results of the study indicate that high expression of TXNDC12 is significantly correlated with the malignant progression of tumors in GBM.
2. Objectives
Furthermore, the study found that inhibition of TXNDC12 leads to an increase in intracellular reactive oxygen species, which, in turn, slows down the proliferation of the tumor. These findings were confirmed in vivo experiments, further solidifying the validity of the results.
3. Methods
3.1. Bioinformatics
The Chinese Glioma Genome Atlas (CGGA), American Brain Tumor Molecular Database (Rembrandt), and The Cancer Genome Atlas (TCGA) were employed to investigate TXNDC12 expression and prognostic variances. Additionally, the TCGA database was further scrutinized to elucidate TXNDC12-related signaling pathways.
3.2. Pathological Samples
A total of 60 patients who underwent cerebral lesion resection at the Department of Neurosurgery, Haiyang People's Hospital from January 2017 to January 2020 were included in this study. This cohort comprised 18 patients with a pathological diagnosis of WHO grade II, 18 patients with WHO grade III, and 18 patients with WHO grade IV gliomas. Additionally, six normal brain tissue samples were obtained from patients who underwent decompression surgery due to cerebral hemorrhage or traumatic brain injury, with postoperative pathology confirming normal brain tissue. All patients provided informed consent; this study is approved under the ethical approval code of 201700162.
3.3. Cells and Reagents
The glioma cell lines U251 and A172 were procured from the Cell Resource Center, Shanghai Institutes for Biological Sciences, Chinese Academy of Sciences. Immunohistochemical secondary antibody SP reagent (SP-9001), goat anti-rabbit secondary antibody (ZB-2301), and DAB color development reagent (Zli-9032) were obtained from Beijing Zhongsun Jinqiao Biotechnology Co. Ltd. SiRNA was sourced from Shanghai Jima Pharmaceutical Technology Co. The CCK-8 kit was purchased from Dongren Chemical Technology (Shanghai) Co., while the Cell proliferation imaging kit (EdU method) was obtained from Guangzhou Ribo Biotechnology Co. Crystalline violet was procured from Shanghai Biyuntian Biotechnology Co.
3.4. Cell Culture and Transfection
Glioma cells were cultured in DMEM medium supplemented with 10% fetal bovine serum and maintained in a constant temperature incubator at 37℃ with 5% CO2 for routine passaging. Cells were detached and passaged using 0.05% trypsin solution. Well-established U251 and A172 cells were selected to generate cell suspensions for cell counting and subsequently seeded into six-well plates. Upon reaching 60% confluency, 1 mL of fresh medium was added to each well, and both the blank control group and experimental group were established simultaneously. Transfection of the cells was conducted using the lipofectamine 2000 transfection kit according to the manufacturer's instructions.
3.5. Western Blotting
After transfection for 48 hours, the cells were harvested and lysed using an appropriate volume of RIPA lysis solution. The cell lysates were incubated on ice for 30 minutes and then centrifuged at 12,000 rpm for 5 minutes at 4°C. The supernatant (containing protein) was transferred to a centrifuge tube and stored at -20°C. Protein concentration was determined using the BCA method, and 5× protein loading buffer was added to each sample. The protein samples were denatured by boiling in a water bath for 10 minutes. Approximately 40 µg of protein from each group was separated by SDS-PAGE electrophoresis and transferred to PVDF membranes at 4°C. After blocking with 5% skimmed milk powder, primary antibodies (diluted at 1:1000 for β-actin and TXNDC12 antibodies) were added separately and incubated overnight at 4°C. Following washing with TBST (Tris-buffered saline with Tween) three times for 5 minutes each, the membranes were incubated with secondary antibodies coupled with horseradish peroxidase (diluted at 1:5000) at room temperature for 1 hour. After additional TBST washing, ECL (enhanced chemiluminescence) substrate was added, and the membranes were developed. Finally, the grayscale values of each band were analyzed using Image J software.
3.6. Cell Viability and Proliferation Assays
Cell viability was evaluated using the CCK-8 assay. U251 and A172 cells in a healthy state were seeded into 96-well plates at a density of 3000 cells/100 µL, and transfection was conducted 24 hours later. Each group was set up with three replicates, and four 96-well plates were inoculated and then incubated in a 37°C, 5% CO2 incubator. At 24- and 48-hours post-transfection, the 96-well plates were removed, and 10 µL of CCK-8 solution was added to each well. Following a 60-minute incubation at 37°C, the absorbance at 450 nm was measured using a microplate reader. Proliferation was assessed using the EdU incorporation assay. U251 and A172 cells in optimal condition were seeded into 24-well plates at a density of 10,000 cells/500 µL, and transfection was performed 24 hours later. Each group was set up with two replicates and then incubated in a 37°C, 5% CO2 incubator. After 48 hours of incubation, fixation and staining were carried out according to the instructions provided with the EdU kit. Fluorescence microscopy was employed to capture images.
3.7. Statistical Analysis
Statistical analysis was performed using SPSS 22.0 software. Normal distribution of all measures was assessed using the Shapiro-Wilk (S-W) method. Data conforming to normal distribution were expressed as mean ± standard deviation (x ± s). One-way analysis of variance (ANOVA) was utilized for comparing means among groups, and the LSD (Least Significant Difference) or SNK (Student-Newman-Keuls) methods were employed for post-hoc pairwise comparisons. A P-value less than 0.05 was considered indicative of statistical significance (two-tailed).
4. Results
4.1. Association of Thioredoxin Domain Containing 12 Over-expression with Poor Prognosis in Human Tumors
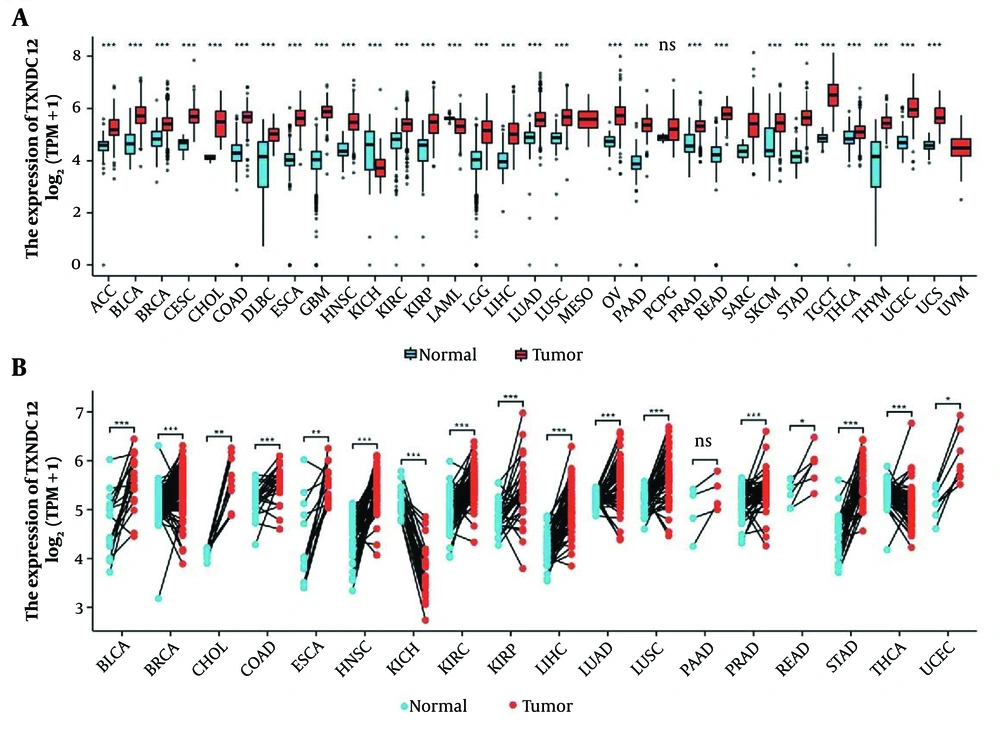
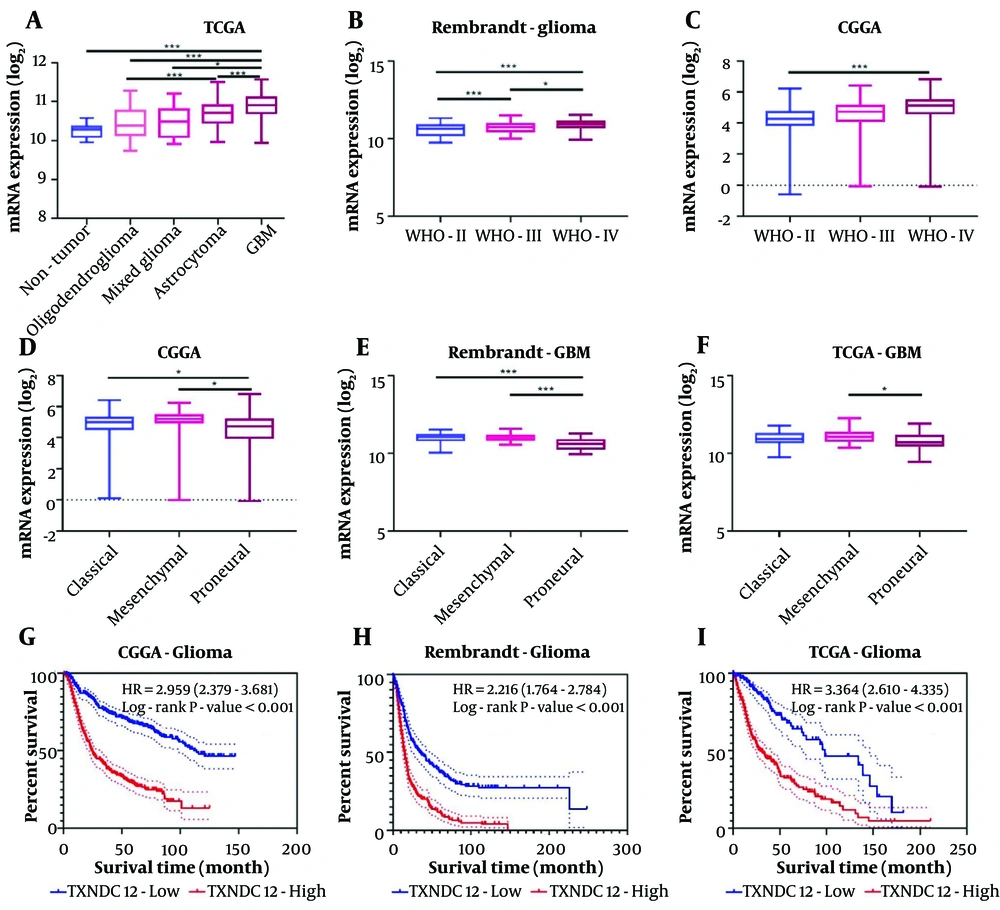
In order to study the expression level of TXNDC12 in the development of human tumors, we conducted an analysis of the mRNA expression levels of this gene in human glioma samples by utilizing publicly available datasets from the TCGA database. The results showed that TXNDC12 is highly expressed in various tumors, with the exception of Kidney Chromophobe Cancer (KICH) (Figure 1A and B). Further examination of glioma samples revealed a significant upregulation in the mRNA expression of TXNDC12 in both low-grade (WHO II; n = 226) and high-grade gliomas (WHO IV, n = 150; P < 0.0001) when compared to non-tumor samples (n = 4, as illustrated in Figure 2A). Specifically, TXNDC12 expression exhibited a notable increase in oligodendroglioma, mixed glioma, astrocytoma, and GBM compared to non-tumor tissues.
A, analysis of Thioredoxin domain containing 12 (TXNDC12) expression levels across various types of human cancers compared to normal tissues was conducted using data from The Cancer Genome Atlas (TCGA) database. B, the mRNA expression of TXNDC12 in cancer tissues and matched para-cancerous tissues was assessed using paired samples from TCGA. ns, no significance; * P < 0.05; ** P < 0.01; *** P < 0.001.
Thioredoxin domain containing 12 (TXNDC12) expression is elevated in various databases. A, TXNDC12 mRNA expression levels (log2) extracted from the TCGA database; B, TXNDC12 mRNA expression levels (log2) retrieved from the Rembrandt database; C, TXNDC12 mRNA expression levels (log2) sourced from the CGGA database; D, TXNDC12 mRNA expression levels (log2) stratified by pathological types in the CGGA database; E, TXNDC12 mRNA expression levels (log2) categorized by pathological types in the Rembrandt database; F, TXNDC12 mRNA expression levels (log2) classified by pathological types in the TCGA database; G, Kaplan-Meier survival analysis depicting patient overall survival based on high versus low TXNDC12 expression levels in the CGGA dataset; H, Kaplan-Meier survival analysis illustrating patient overall survival based on high versus low TXNDC12 expression levels in the Rembrandt dataset; I, Kaplan-Meier survival analysis showing patient overall survival based on high versus low TXNDC12 expression levels in the TCGA dataset. * P < 0.05; *** P < 0.001.
Analysis of the Rembrandt database corroborated these findings, demonstrating a significant disparity in TXNDC12 expression across WHO grades II, III, and IV, with a discernible escalation in expression corresponding to increasing pathological grading (Figure 2B). Moreover, the CGGA database also indicated a heightened mRNA level of TXNDC12 in high-grade gliomas (Figure 2C). The findings demonstrate that TXNDC12 is positively correlated with the malignancy of the tumor and is an oncogenic gene related to the tumor.
4.2. Thioredoxin Domain Containing 12 is Associated with Poor Prognosis in Glioblastoma
Glioblastoma is considered the most malignant among all pathological types and has the worst prognosis. Prior investigations have proposed that the extent of infiltration by tumor microenvironment cells, immune cells, and stromal cells could profoundly influence the prognosis of glioblastoma multiforme. Consequently, we assessed disparities in TXNDC12 expression across classical, mesenchymal, and proneural subtypes. Analysis of the CGGA database revealed that TXNDC12 exhibited the highest expression in classical GBM, followed by the mesenchymal subtype, with the proneural subtype displaying the lowest expression levels (depicted in Figure 2D). The analysis of the Rembrandt database showed no obvious differences compared to CGGA analysis, while changes between different pathological types were more evident (Figure 2E). The TCGA database indicated no statistically significant differences between classical, mesenchymal, and proneural subtypes, but TXNDC12 was expressed higher in mesenchymal type and showed a statistically significant difference compared to proneural subtype (Figure 2F). Therefore, the overexpression of TXNDC12 was indicative of a poor prognosis in GBM, pointing to its significance in tumor biology and the potential benefits of targeting TXNDC12 in therapeutic approaches to mitigate disease progression.
In accordance with the survival data from the CGGA database, Rembrandt database and TCGA database, we generated Kaplan-Meier survival curves to investigate the potential role of TXNDC12 expression in glioma patient survival. A notable contrast was evident between the high and low expression cohorts of TXNDC12, whereby individuals with low TXNDC12 expression exhibited prolonged survival durations compared to those with high TXNDC12 expression levels (Figure 2H and I, P < 0.001).
4.3. Thioredoxin Domain Containing 12 is Highly Expressed in Clinical Specimens and Cell Lines
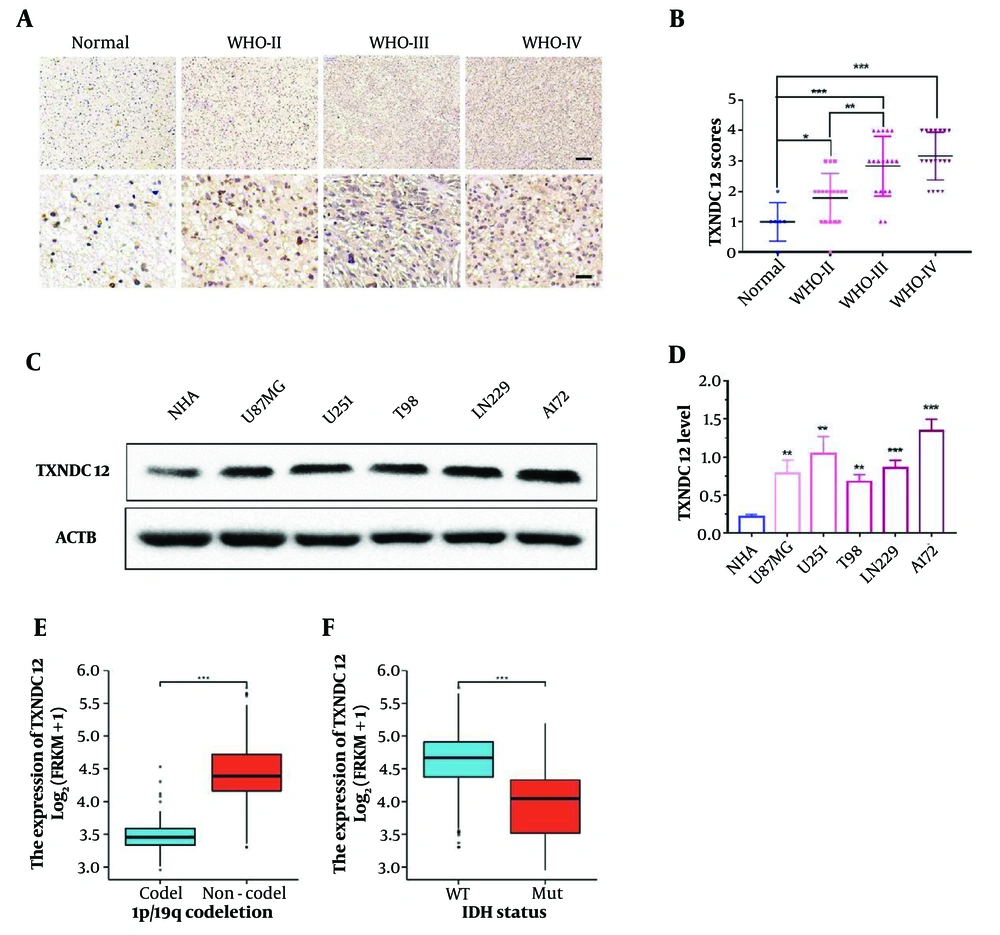
In this investigation, 60 clinical glioma specimens, encompassing 18 grade II, 18 grade III, and 18 grade IV tumors, alongside 6 non-tumor brain tissue specimens, were subjected to immunohistochemical (IHC) staining. The results demonstrated a discernible elevation in TXNDC12 expression corresponding to tumor grade progression (as illustrated in Figure 3A and B). Furthermore, various tumor-associated parameters, including age, gender, tumor size, liquefaction necrosis, preoperative tumor edema, and tumor grade were evaluated. The analysis revealed a positive correlation between TXNDC12 expression levels and tumor grade, as well as liquefaction necrosis, while no significant correlation was observed with age, gender, tumor size, or edema. These findings suggest that TXNDC12 holds promise as a potential diagnostic biomarker for glioma patients, as depicted in Table 1 (P < 0.001).
Thioredoxin domain containing 12 (TXNDC12) expression is elevated in patient-derived glioma samples and GBM cell lines. A, representative images of immunohistochemical (IHC) staining for TXNDC12 in human brain tissue samples (Normal, n = 6; WHO II, n = 18; WHO III, n = 18; WHO IV, n = 18). Scale bar for the upper images: Fifty µm and for the lower images: One-hundred µm; B, statistical results of IHC staining; C, western blot showing TXNDC12 protein levels in normal human astrocytes (NHA) and human glioblastoma (GBM) cell lines; D, quantification of western blot results depicted in C, by pixel gray value; E, relationship between TXNDC12 expression and GBM1p/19q co-deletion in GBM; F, relationship between TXNDC12 expression and IDH mutations in GBM. * P < 0.05; ** P < 0.01; *** P < 0.001.
| Variables | n | TXNDC12 Expression | P-Value | |
|---|---|---|---|---|
| Low | High | |||
| Age (y) | ||||
| < 60 | 37 | 16 | 21 | 0.887 |
| ≥ 60 | 17 | 7 | 10 | |
| Gender | ||||
| Male | 29 | 13 | 16 | 0.951 |
| Female | 25 | 11 | 14 | |
| Tumor size (cm) | ||||
| < 4 | 18 | 7 | 11 | 0.697 |
| ≥ 4 | 36 | 16 | 20 | |
| Liquefactive necrosis | ||||
| Negative | 35 | 18 | 17 | 0.305 |
| Positive | 19 | 7 | 12 | |
| Edema | ||||
| None to mild | 16 | 8 | 8 | 0.369 |
| Moderate to severe | 38 | 14 | 24 | |
| WHO grade | ||||
| II | 18 | 15 | 3 | < 0.001 |
| III | 18 | 5 | 13 | |
| IV | 18 | 2 | 16 | |
Additionally, immunoblot analysis revealed elevated levels of TXNDC12 protein in human glioma cell lines, namely U87MG, U251, T98, LN229, and A172, compared to human astrocytes (NHA), as depicted in Figure 3C and D. Collectively, these findings suggest that TXNDC12 may exert a pivotal role in the development and progression of glioma, thereby indicating its potential utility as a novel diagnostic protein marker.
To further explore the role of TXNDC12, database analysis showed a significant correlation between TXNDC12 and common mutations in GBM. Co-deletion of 1p19q was negatively correlated with high expression of TXNDC12 in patients (Figure 3E). However, IDH in GBM patients was found to be wild type, with a positive correlation between high expression of TXNDC12 and patients (Figure 3F). These results further confirm that TXNDC12 mediates the malignant progression of glioma.
4.4. Knockdown of Thioredoxin Domain Containing 12 Inhibits the Viability of Glioblastoma Cells
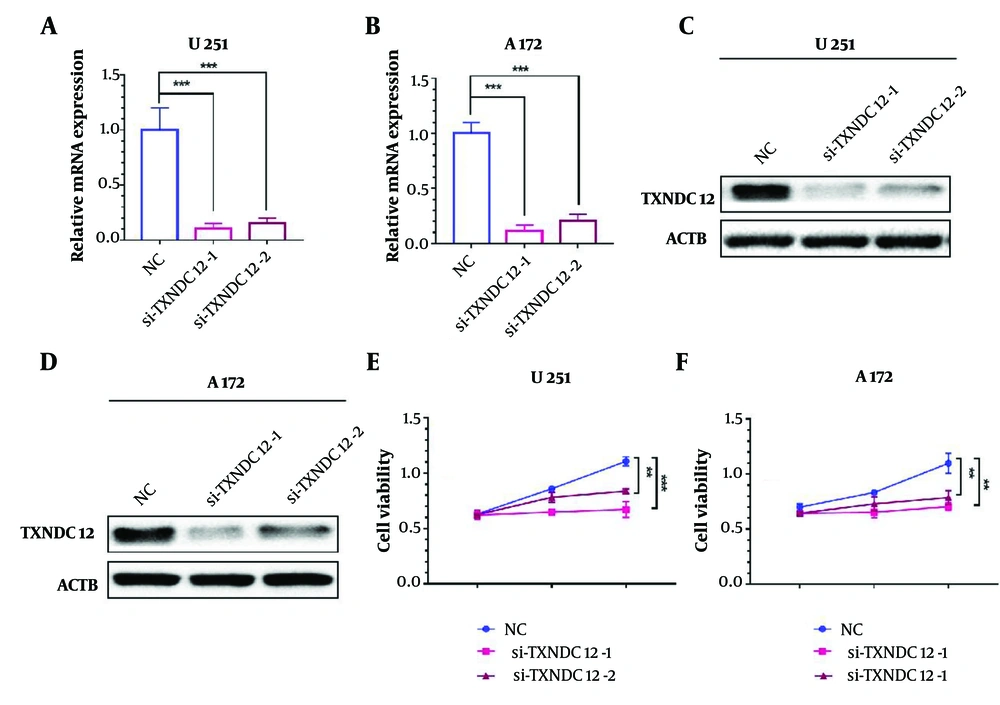
To investigate the mechanism of action of TXNDC12, we designed and synthesized two distinct small interfering RNAs (si-TXNDC12-1 and si-TXNDC12-2) and evaluated their efficacy in TXNDC12 knockdown in vitro. In the U251 cell line, si-TXNDC12-1 demonstrated a knockdown efficiency of 89.3%, while si-TXNDC12-2 exhibited 85% efficiency (Figure 4A). Similarly, in the A172 cell line, si-TXNDC12-1 achieved a knockdown efficiency of 88.3%, and si-TXNDC12-2 yielded 79.3% efficiency (Figure 4B). Western blot analyses revealed a significant reduction in TXNDC12 protein levels following mRNA disruption, with si-TXNDC12-1 exhibiting slightly higher efficacy than si-TXNDC12-2 (Figure 4C and D).
Interference with Thioredoxin domain containing 12 (TXNDC12) inhibits GBM cell viability. A, TXNDC12 mRNA levels in U251 cells transfected with two independent TXNDC12 siRNAs. B, TXNDC12 mRNA levels in A172 cells transfected with two independent TXNDC12 siRNAs. C, TXNDC12 protein levels in U251 cells transfected with si-TXNDC12-1 or si-TXNDC12-2. D, TXNDC12 protein levels in A172 cells transfected with si-TXNDC12-1 or si-TXNDC12-2. E, growth curves illustrating the effect of si-TXNDC12 transfection on U251 cells, plotted over time using OD 450 readings obtained through the CCK8 assay. F, growth curves demonstrating the impact of si-TXNDC12 transfection on A172 cells, plotted over time using OD 450 readings obtained through the CCK8 assay. ** P < 0.01; *** P < 0.001.
Subsequent cell viability assays conducted on U251 and A172 cells with TXNDC12 knockdown indicated a significant inhibition of cell viability compared to the control group over an extended period. After 72 hours, si-TXNDC12-1 demonstrated a cell viability inhibition rate of 39.5%, surpassing si-TXNDC12-2, which exhibited a rate of 24.5% (Figure 4E). Similarly, in the A172 cell line, si-TXNDC12-1 induced a cell viability inhibition rate of 35.8% after 72 hours, while si-TXNDC12-2 showed a rate of 28.3% (Figure 4F). Based on these findings, we can conclude that TXNDC12 promotes the metabolism of GBM and that suppressing its expression can reduce this promoting effect and decrease cell viability.
4.5. Knockdown of Thioredoxin Domain Containing 12 Inhibits Glioma Cell Proliferation
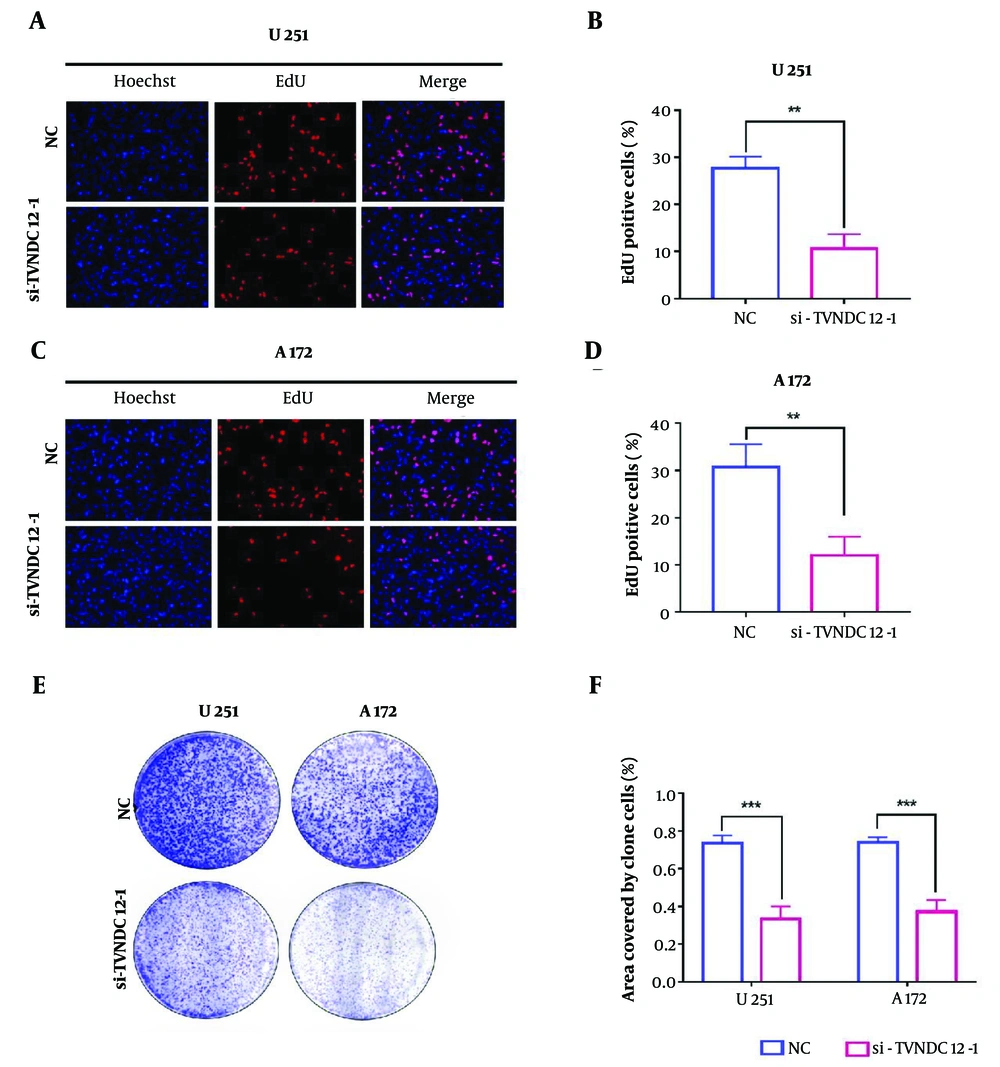
In an endeavor to delve deeper into the mechanisms underlying cell activity inhibition, we conducted phenotype experiments associated with TXNDC12 knockout. The EdU assay revealed a notable decrease in the number of cells in the proliferation phase (stained in red fluorescence) following TXNDC12 knockout in both U251 and A172 cell lines. In U251 cells, the knockout of TXNDC12 led to a reduction in the proportion of proliferating cells, with the percentage decreasing from 27.7% to 10.7% (as depicted in Figure 5A and quantified in Figure 5B). Similarly, in the A172 cell line, TXNDC12 knockout resulted in significant suppression of cell proliferation, with the proportion of proliferating cells decreasing from 30.7% to 12.0% (illustrated in Figure 5C and D). The outcomes of the colony formation assay unveiled a decrease in the number of clone colonies and a reduction in the size of the clone colonies following TXNDC12 knockout (Figure 5E). The total clone area of the U251 cell line decreased by approximately 54.5%, while the clone area of the A172 cell line decreased by approximately 49.9% (Figure 5F).
Knockdown of Thioredoxin domain containing 12 (TXNDC12) Inhibits GBM cell proliferation. A, fluorescence images of EdU assays performed on U251 cells transfected with si-TXNDC12-1. Nuclei were stained with DAPI (blue). Scale bar, 100 μm; B, statistical results of EdU assay in U251 cells; C, fluorescence images of EdU assays performed on A172 cells transfected with si-TXNDC12-1. Nuclei were stained with DAPI (blue). Scale bar, 100 μm; D, statistical results of EdU assay in A172 cells; E, representative images of colony-forming assays for U251 and P3-GBM cells transfected with si-TXNDC12-1; F, statistical results of the number of colonies shown in E. ** P < 0.01; *** P < 0.001
4.6. Inhibition of Thioredoxin Domain Containing 12 Leads to an Increase in Intracellular Reactive Oxygen Species
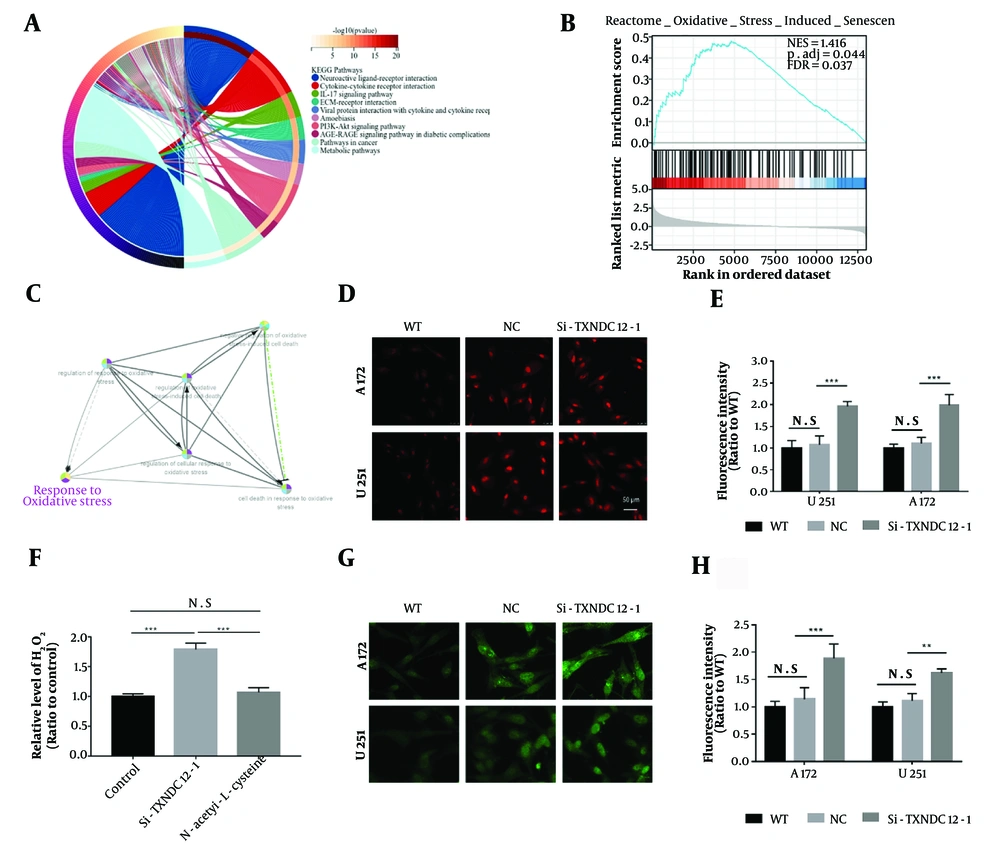
In order to further explore the mechanism of action of TXNDC12, we first utilized a database to predict its role within cells, which revealed a widespread function of TXNDC12 in the involvement of various signaling pathways within cells (Figure 6A). Further enrichment analysis of relevant pathways showed that oxidative-reductive imbalance played a predominant role in this process (Figure 6B and C).
Intracellular reactive oxygen species increase with Thioredoxin domain containing 12 (TXNDC12) loss. A, predicted cellular signaling pathways associated with TXNDC12; B, enrichment analysis depicting the correlation of TXNDC12 with the cellular oxidative stress pathway; C, schematic illustrating the mechanism of action of the cellular oxidative stress pathway influenced by TXNDC12; D, representative images displaying dihydroethidium (red) superoxide probe staining 48 hours post-transfection of cells with si-TXNDC12-1. Three images per group from triplicate experiments were quantified; E, statistical analysis of fluorescence intensities in A172 and U251 GBM cell lines transfected with si-TXNDC12-1 compared to their respective controls; F, H2O2 levels detected in U251 cells transfected with si-TXNDC12-1 and si-TXNDC12-2 for 48 hours; G, result of ROS fluorescent probe in A172 and U251 cells transfected with si-TXNDC12-1 for 48 hours; H, statistical analysis of green fluorescence intensities in G. N.S, no significance; ** P < 0.01; *** P < 0.001.
Excessive generation of reactive oxygen species (ROS), including hydrogen peroxide (H2O2), superoxide radicals (O2-), and hydroxyl radicals (-OH), coupled with diminished cellular ROS clearance capability, constitutes the primary drivers of oxidative stress within cells. Given that hydrogen peroxide is a byproduct of superoxide production, levels of superoxides can serve as an indirect indicator of hydrogen peroxide levels. To investigate superoxide levels, we employed a fluorescence superoxide probe (dihydroethidium, DHE). Upon transfection with si-TXNDC12-1, A172 and U251 cells exhibited a significant increase in fluorescence intensity, approximately twice as high as that of the control group (Figure 6D and E). Similarly, cells transfected with si-TXNDC12-1 displayed a 1.8-fold elevation in hydrogen peroxide (H2O2) levels compared to the control group. Upon treatment with a hydrogen peroxide scavenger (N-acetyl-1-L-cysteine), the H2O2 levels were significantly attenuated. Additionally, results obtained from the ROS fluorescence probe indicated that the green fluorescence intensity of cells transfected with si-TXNDC12-1 was approximately 1.85-fold higher than that of the control group (as illustrated in Figure 6G and H). These findings suggest that TXNDC12 may exert a crucial role in mitigating cellular ROS levels to uphold the balance of oxidative-reductive reactions within cells.
4.7. Knockdown of Thioredoxin Domain Containing 12 Inhibits the Growth of GBM in Vivo
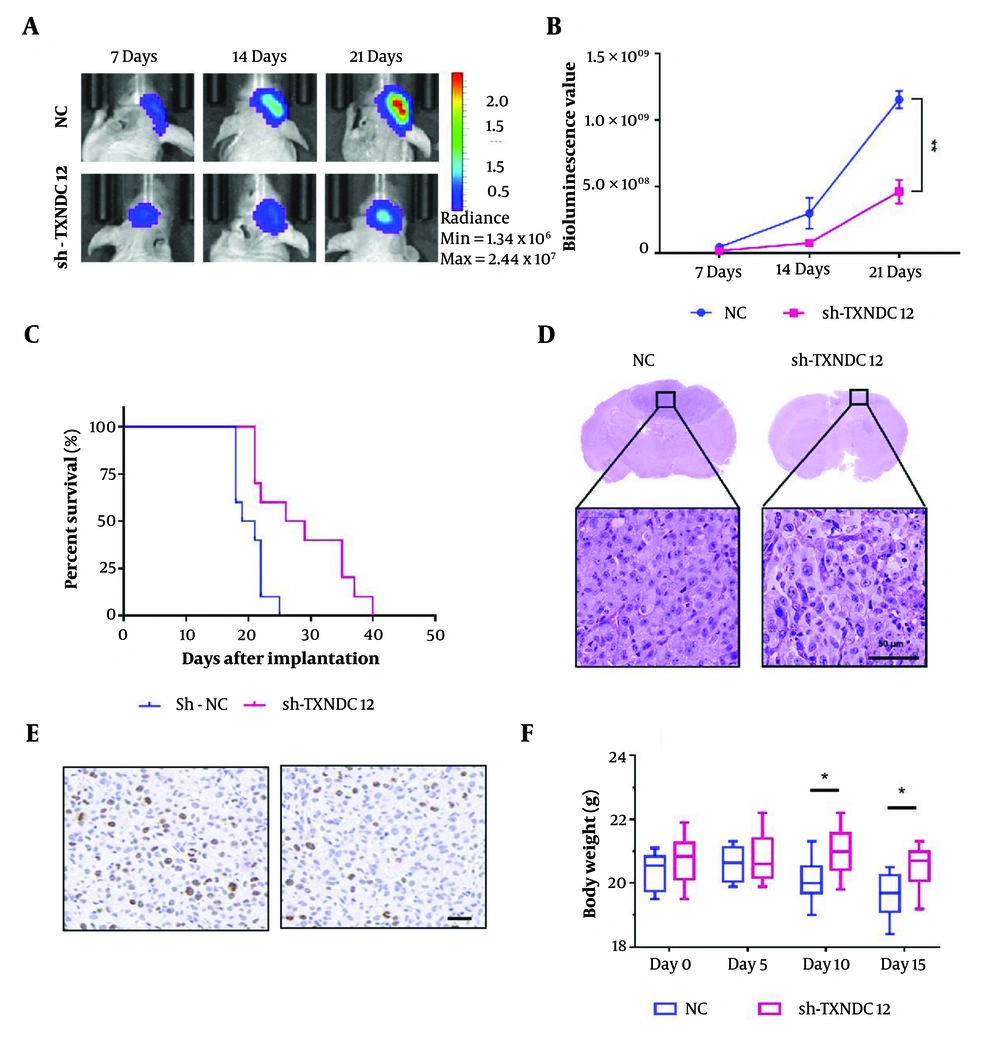
To investigate the impact of TXNDC12 on tumor growth in athymic nude mice, A172-sh-TXNDC12-1 and A172-NC cells expressing fluorescence were intracranially implanted into the brains of nude mice (10 mice per group). The growth of tumors was continuously monitored using bioluminescence imaging over a span of 21 days. By day 14, a notable discrepancy in bioluminescence values between the two groups of animals was observed, as depicted in Figure 7A. By day 21 post-implantation, the mean volume of A172-sh-TXNDC12-1 tumors had diminished by approximately 65% compared to the NC group (P < 0.01), as illustrated in Figure 7B. Kaplan-Meier analysis indicated a noteworthy increase in the overall survival of tumor-bearing animals from 20.3 days in the control group to 28.7 days in the knockdown group (P < 0.05), as shown in Figure 7C. The Histological examination further corroborated these findings, revealing that A172-sh-TXNDC12-1 tumors exhibited smaller sizes compared to NC tumors, with significant apoptotic activity observed in A172-sh-TXNDC12-1 tumor cells. Moreover, reduced cell proliferation was evident in the tumor tissue, as depicted in Figure 7D. Staining for Ki67 in the tumor tissue revealed that the expression of TXNDC12 could significantly inhibit tumor tissue proliferation, resulting in a significant reduction in the number of Ki67-positive cells. Additionally, mice suppressed in TXNDC12 expression were able to maintain a healthier body weight compared to the control group, without experiencing significant weight loss. In sum, the downregulation of TXNDC12 effectively inhibits the growth of glioblastoma multiforme tumors in vivo.
Suppression of TXNDC12 attenuates in vivo GBM Growth. A, tumor growth of luciferase-expressing A172-sh-TXNDC12-1 cells or A172-NC cells monitored at days 7, 14, and 21 after implantation using the IVIS-200 imaging system to detect bioluminescence; B, quantification of the bioluminescent signals from the orthotopic tumors in mice at days 7, 14, and 21; C, Kaplan-Meier analysis of overall survival of GBM-bearing mice; D, representative images of hematoxylin and eosin-stained sections from brains of orthotopic tumor-bearing nude mice. Scale bar, 100 µm; E, Ki67 expression between the experimental (right) and control (left) groups; F, body weight changes in experimental and control mice. * P < 0.05; ** P < 0.01.
5. Discussion
Despite the significant progress made in the basic research of gliomas over the past several decades, the median survival time of patients remains less than 15 months (21). The sluggish progress in developing chemotherapy drugs for gliomas primarily stems from the challenge of most drugs to penetrate the blood-brain barrier effectively. Additionally, escalating drug doses to overcome this barrier often results in substantial side effects that impede the patient's physical function (22, 23). Furthermore, the application of chemotherapy drugs also enhances the resistance of gliomas (24, 25). Therefore, investigating the underlying mechanisms of glioma cell biology and identifying novel treatment targets could pave the way for innovative approaches in glioma therapy.
Thioredoxin domain containing 12, a member of the thioredoxin superfamily, is a protein encoded by the TXNDC12 gene (19). The principal characteristic of this family member resides in its possession of a thioredoxin folding activity group, facilitating the catalysis of disulfide bond formation and isomerization (26). Moreover, the protein potentially functions in defending against reactive oxygen species (ROS). Through analysis of both databases and clinical glioma samples, this study revealed that elevated expression levels of TXNDC12 correlated with higher pathological grades, increased malignancy, and poorer prognosis in patients. Cell experiments further demonstrated that TXNDC12 promotes the proliferation of glioma cells, while its deletion significantly impedes glioma cell growth.
The role of reactive oxygen species (ROS) in cancer therapy is gaining increasing attention (27, 28). An expanding array of drugs that induce cellular oxidative stress by augmenting levels of reactive oxygen species are being utilized in clinical settings (29). However, a unified understanding of the role of oxidative stress in cancer therapy, particularly concerning the quantitative investigation of the effects of varying levels of reactive oxygen species in the body on the promotion or inhibition of cancer, remains elusive. Many drugs for treating cancer operate via oxidation, which can generally be divided into two categories: One category increases the level of ROS in the cells to induce tumor cell death, while the other category suppresses the cell's antioxidant enzyme system (30-32). This study furnished a theoretical foundation for glioblastoma treatment strategies focused on inhibiting the antioxidant enzyme system.
In GBM cells, there exists a delicate equilibrium between the oxidative and antioxidant systems. Disruption of this balance, characterized by an elevation in pro-oxidant levels or a reduction in antioxidant capacity, can precipitate an escalation in reactive oxygen species levels within the body, instigating a cascade of consequential alterations (33-35). In this study, we delved deeper into the role of TXNDC12 in governing the proliferation of glioblastoma cells. Thioredoxin domain containing 12 emerges as a pivotal player in preserving this delicate balance. Suppression of TXNDC12 expression prompts a notable elevation in reactive oxygen species content within glioblastoma cells, culminating in cellular apoptosis. In summary, this study highlights the significant elevation of TXNDC12 expression in glioblastoma patients, with a positive correlation to disease severity, indicative of poorer prognosis in patients with heightened TXNDC12 expression.
5.1. Conclusions
Here we report that TXNDC12 exerts a notable influence on the proliferation of GBM cells, TXNDC12 may represent a novel therapeutic target for the management of this devastating disease. In conclusion, this study provides new and important information about the role of TXNDC12 in GBM and underscores its potential for use in the development of new and effective treatments for this devastating disease. The findings of this study underscore the criticality of sustained research efforts and investment in the advancement of novel therapeutic approaches for glioblastoma multiforme and other types of brain tumors.

