1. Background
Acute myeloid leukemia (AML) is a type of blood malignancy generated by bone marrow hematopoietic stem cells, defined by clonal expansion and the accumulation of immature myeloid progenitors (1, 2). Acute myeloid leukemia is more common leukemia subtype in adults and male patients (3). The disease is highly heterogeneous with a variable prognosis and a high mortality rate (4, 5). The leukemogenesis mechanisms of AML is not clearly understood at the cellular and molecular level. In blood cancers, especially AML, aberrant gene expression is thought to contribute to most important properties of leukemia cells, including self-renewal, growth, and resistance to therapy (6, 7). Next-generation sequencing (NGS)-based RNAseq, has emerged as a powerful tool for discovering pathogenetic pathways and potential therapeutic targets for clinical intervention in AML (8, 9).
Competitive endogenous RNA (ceRNA) networks have represented a new version of RNA interaction and play important roles in a variety of biological processes and development of malignancies (10, 11). The different studies on the ceRNA network have reported that lncRNAs are involved in a wide range of biological process (12-14).
Research on the ceRNA network has resulted in notable development in the field of the ceRNA network's role in human disease, particularly cancers (15, 16). The imbalance of the ceRNA regulatory network is particularly important in various diseases, especially cancers (17). Through investigating the ceRNA network from several dimensions it is possible to identify prognostic biomarkers and provide information about the disease outcome (18). Identifying the development of leukemia cells from bone marrow stem cells is possible through the study of the ceRNA network, and new approaches for leukemia treatment can be provided in accordance with the regulation of the ceRNA network (13).
2. Objectives
The purpose of this study was to identify the key modules and hub genes that are associated with AML cancer through WGCNA based on high-throughput transcriptomic data.
3. Methods
3.1. Data Collection and Preprocessing
Transcriptomic RNA data and clinical data of 151 AML samples and corresponding 151 healthy controls were obtained from the TCGA data portal and GTEx Portal, respectively. RNA-seq data were normalized by applying the trimmed mean of M-values (TMM) method using the edgeR package (version 3.34.1) in R software. This normalization method is based on trimming of extreme log fold changes of the data to normalize the raw read counts based on the residual non-differentially expressed genes and subsequently count expression data of samples were used for differential expression analysis. In this investigation, the batch effect was eliminated using a function called combat from the “sva” R package (version 3.44.0).
3.2. Identification of Differentially Expressed Genes (DEGs)
In order to discover novel genes related to the pathogenesis of AML cancer, we used DESeq2 R package (version.1.28.1), edgeR package (version 3.34.1) and limma R packages (version.3.46.0) to screen differentially expressed genes (DEGs) between AML and normal specimens from the TCGA count data. The final DEGs for AML were chosen from the studied genes based on cut-off criteria |log2fold change (FC)| > 1 and a threshold P-value < 0.05.
3.3. Weighted Gene Co-Expression Network Analysis (WGCNA)
The obtained DEGs were subjected to weighted gene co-expression network analysis to find out the expression patterns between different genes by using the R package WGCNA (version 1.72 - 5). Genes with similar expression patterns were considered as a specific module and represented with a unique color. The similarity matrix between each pair of genes across all samples was calculated based on its Pearson’s correlation value. A topological overlap matrix (TOM) was calculated according to the corresponding soft-thresholding value (β) and generated by transforming the adjacency matrix.
To identify the modules, we used the TOM topological overlap matrix. This matrix represents the similarity between genes. In this study, after forming the adjacency matrix with the function called TOM similarity, we calculated the Tom dissimilarity and gene modules were identified by using the Dynamic Tree Cut algorithm and the minimum number of nodes were set at 15 to ensure high reliability.
3.4. Construction of CeRNA Network and Topology Analysis
According to the results of WGCNA, the relationship between miRNA, mRNA, and lncRNA, as well as their co-expression level and their location in a module were considered. The correlations between the expressions of the studied genes in AML samples were determined using the Pearson correlation test.
In addition, the mirWalk; version 3.0 web server was applied for the prediction of high-confidence miRNA-mRNA interactions. Starbase; version 3.0) was also used for miRNA and lncRNA interaction version 3.0. To confirm the crosstalk between miRNA, mRNA, and lncRNA, only those interactions are considered in which a reverse correlation was seen between the expression of miRNA and their target. To check the relationship between mRNAs and mRNA and lncRNAs, only their co-expression and their placement in a module were considered. The candidate key modules by ceRNA network analysis will be used for further investigations. Then, key genes were applied to the Enrichr database to find the important signaling pathways and dominant biological activities related to AML.
3.5. Statistical Analysis
All statistical analysis was performed using R statistical software version 4.2.1. P-value < 0.05 was considered statistically significant.
4. Results
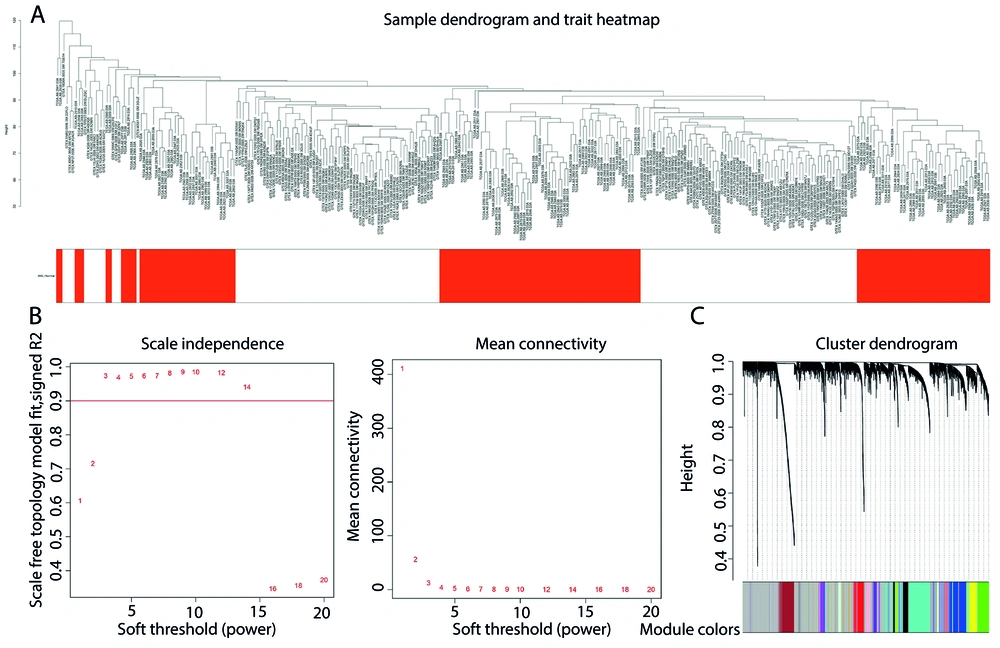
By bioinformatics analysis on 151 normal samples and an equal number of AML samples, the relationship between ceRNA network (miRNA-lncRNA-mRNA) in patients with AML was investigated in order to find the potential biomarkers for diagnosis and prognosis of patients. The results of cluster analysis of the samples are demonstrated in Figure 1A. After normalizing the samples, 32203 genes in AML patients obtained, based on a coefficient of variation above 0.3, in WGCNA package 5712 genes were identified. During the clustering process, no outliers were detected. Then, by setting the scale-free fit index (R2) to 0.9, the lowest β known as a soft-thresholding parameter, was determined for constructing the scale-free network. Subsequently the soft threshold value = 5, was chosen to establish the relationship matrix, which was then converted into an adjacency matrix (Figure 1B).
In the clustering tree results, we integrated modules with feature factors that exceeds 0.25 and next, establish the gene feature modules to get a total of 21 modules (Figure 1C).
A, sample tree diagram using hclust function; B, soft threshold power diagram including the calculation of the scale-free topology fitting index R2 using the R function pickSoftThreshold (left) and the effect of power values on the mean connectivity for various soft threshold (right); C, a clustering diagram of the gene modules based on TOM.
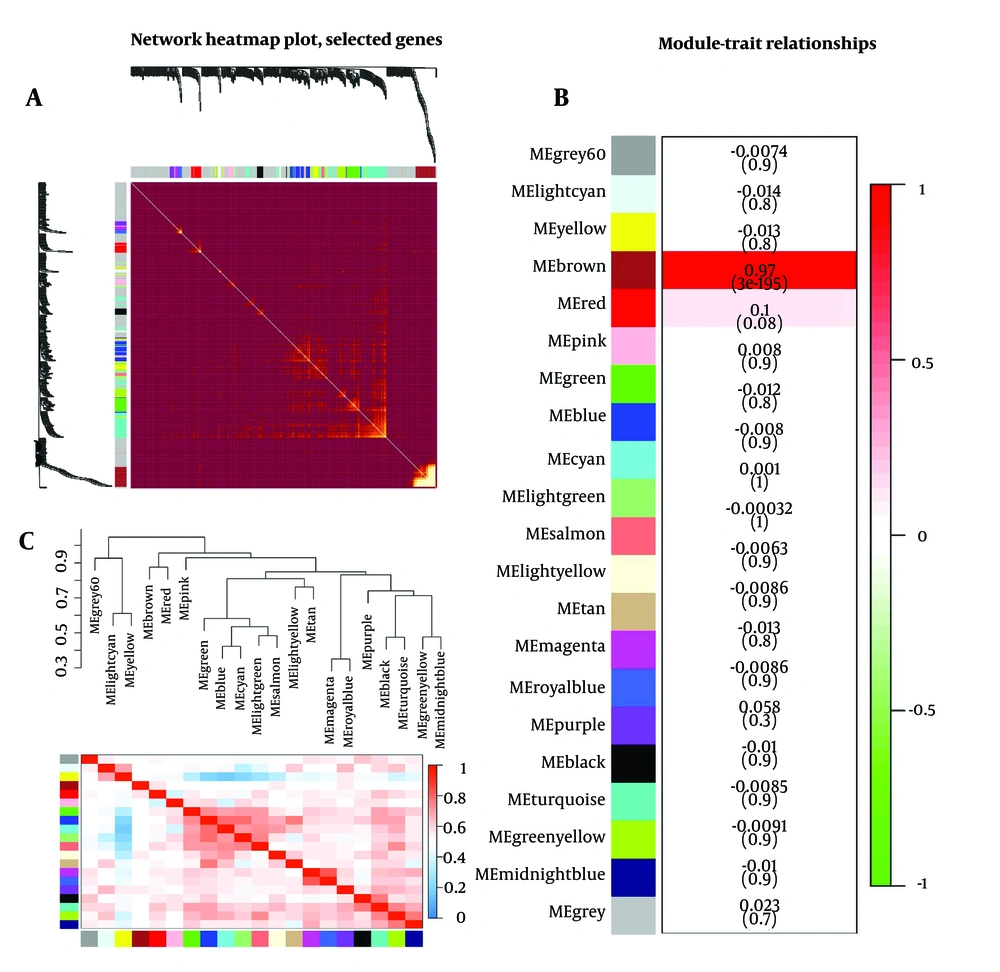
Using a heat map to depict the TOM plot between genes in the analysis, the TOM plot visualizes a few randomly selected genes from the network. The depth of red on a linear scale is positively correlated with the correlation strength between the pair of modules. In this diagram, the degree of correlation in each module was indicated with the genes that are part of it. The diagram is completed with module color and hierarchical clustering. Heatmap TOM plot is used to detect the significant module. In this diagram, brighter points indicate more correlation between modules. As it is clear, the brown module, which is seen as the brightest point, has the highest correlation and is known as module significant (Figure 2A).
The module-trait relationship analysis was performed to determine whether co-expression modules were associated with sample types and clinical traits. Modules that have a significant correlation with each other and their p-value are less than 0.05 and the number of genes in each module is less than 500 are selected, then the genes of the significant module were used for further analysis. In this study, the brown module contains 333 genes and the P-value is 3e-195 (Figure 2B).
The eigengene adjacency heatmap diagram is clustered based on the relationship of eigengene modules to each other. Each row and column in the heatmap corresponds to a specific eigengene module. In this diagram, the red color indicates a high correlation between modules. In the eigengene dendrogram, the modules with closer gene expression profiles are positioned next to each other (Figure 2C).
In the ceRNA network, based on gene significant, from more to less, we classified lncRNA, miRNA, and mRNA into two up/down regulated categories and displayed 5 genes that are effective in the development of AML (Table 1).
| Class and ID | MM | MM; P-Value | GS | GS; P-Value | logFC | FDR |
|---|---|---|---|---|---|---|
| Up-regulated miRNAs | ||||||
| hsa-miR-374B | 0.981855218 | 1.11E-218 | 0.972225292 | 2.92E-191 | 8.485439753 | 0 |
| hsa-miR-553 | 0.960649801 | 6.06E-169 | 0.960071394 | 5.18E-168 | 6.816417558 | 6.59E-289 |
| hsa-miR-3679 | 0.96432455 | 3.28E-175 | 0.959955432 | 7.93E-168 | 6.680402678 | 1.81E-261 |
| hsa-miR-548L | 0.969464217 | 3.55E-185 | 0.953682009 | 1.49E-158 | 6.594061612 | 4.83E-242 |
| hsa-miR-597 | 0.955137843 | 1.38E-160 | 0.948220919 | 1.80E-151 | 6.190802946 | 1.19E-208 |
| Down-regulated miRNAs | ||||||
| hsa-miR-3934 | -0.606328775 | 1.05E-31 | -0.61943744 | 2.17E-33 | -3.548432612 | 1.34E-57 |
| hsa-miR-4746 | -0.307826544 | 4.75E-08 | -0.313930202 | 2.48E-08 | -1.86647688 | 2.66E-14 |
| hsa-miR-466 | 0.317428523 | 1.70E-08 | 0.269936009 | 1.93E-06 | 2.71589394 | 4.03E-11 |
| hsa-miR-6722 | 0.301709693 | 8.97E-08 | 0.27415229 | 1.31E-06 | 2.599199935 | 1.28E-11 |
| hsa-miR-4490 | 0.296293169 | 1.55E-07 | 0.285128957 | 4.67E-07 | 2.065587209 | 3.26E-10 |
| Up-regulated PCGs | ||||||
| AMIGO3 | 0.913111 | 6.43E-119 | 0.921888378 | 1.46E-125 | 5.458302762 | 6.11E-157 |
| H2AC17 | 0.881605183 | 7.88E-100 | 0.91589004 | 6.08E-121 | 8.078990734 | 1.56E-193 |
| SPACA5 | 0.675389864 | 1.42E-41 | 0.661773239 | 2.03E-39 | 3.535747785 | 1.04E-41 |
| GPR21 | 0.637425619 | 7.77E-36 | 0.636444137 | 1.07E-35 | 3.777168751 | 1.04E-43 |
| OR13C3 | 0.673828205 | 2.55E-41 | 0.63418796 | 2.20E-35 | 4.469147958 | 1.23E-48 |
| Down-regulated PCGs | ||||||
| XBP1 | -0.971876591 | 1.85E-190 | -0.997894731 | 0 | -15.70125284 | 0 |
| TOMM6 | -0.971183807 | 6.76E-189 | -0.997077924 | 0 | -14.09616302 | 0 |
| TREX1 | -0.970110735 | 1.50E-186 | -0.995926999 | 1.49160388813268e-315 | -13.59756736 | 0 |
| TNFRSF6B | -0.958136786 | 5.41E-165 | -0.983590532 | 3.57E-225 | -10.39333051 | 0 |
| BOLA2 | -0.953411828 | 3.50E-158 | -0.978593042 | 5.12E-208 | -8.626907207 | 0 |
| Up-regulated lncRNA | ||||||
| GREP1 | 0.842836032 | 1.03E-82 | 0.853996969 | 4.00E-87 | 7.023802068 | 6.89E-138 |
| ZBTB20-AS2 | 0.856226484 | 4.75E-88 | 0.782646029 | 1.01E-63 | 5.58853582 | 6.20E-91 |
| LINC01596 | 0.75599725 | 3.73E-57 | 0.713794784 | 2.53E-48 | 4.764701088 | 6.71E-67 |
| LINC00345 | 0.625525279 | 3.37E-34 | 0.629264449 | 1.05E-34 | 3.529667834 | 2.39E-40 |
| RMRP | 0.560615196 | 2.15E-26 | 0.549247992 | 3.38E-25 | 4.308027951 | 8.49E-39 |
| Down-regulated lncRNA | ||||||
| LINC01609 | 0.308938492 | 4.23E-08 | 0.26194521 | 3.95E-06 | 1.204226246 | 1.64E-06 |
| LINC01707 | 0.298980341 | 1.18E-07 | 0.268930905 | 2.12E-06 | 1.502770803 | 1.19E-07 |
| LINC02270 | 0.29901038 | 1.18E-07 | 0.280420064 | 7.32E-07 | 1.111437138 | 2.09E-06 |
| LINC02309 | 0.306495832 | 5.46E-08 | 0.284827159 | 4.81E-07 | 1.289639017 | 2.64E-07 |
| LINC02243 | 0.297413658 | 1.39E-07 | 0.286466593 | 4.10E-07 | 1.08158053 | 2.75E-06 |
Abbreviations: MM, module membership; GS, gene significant; FDR, false discovery rate; PCG, protein coding gene.
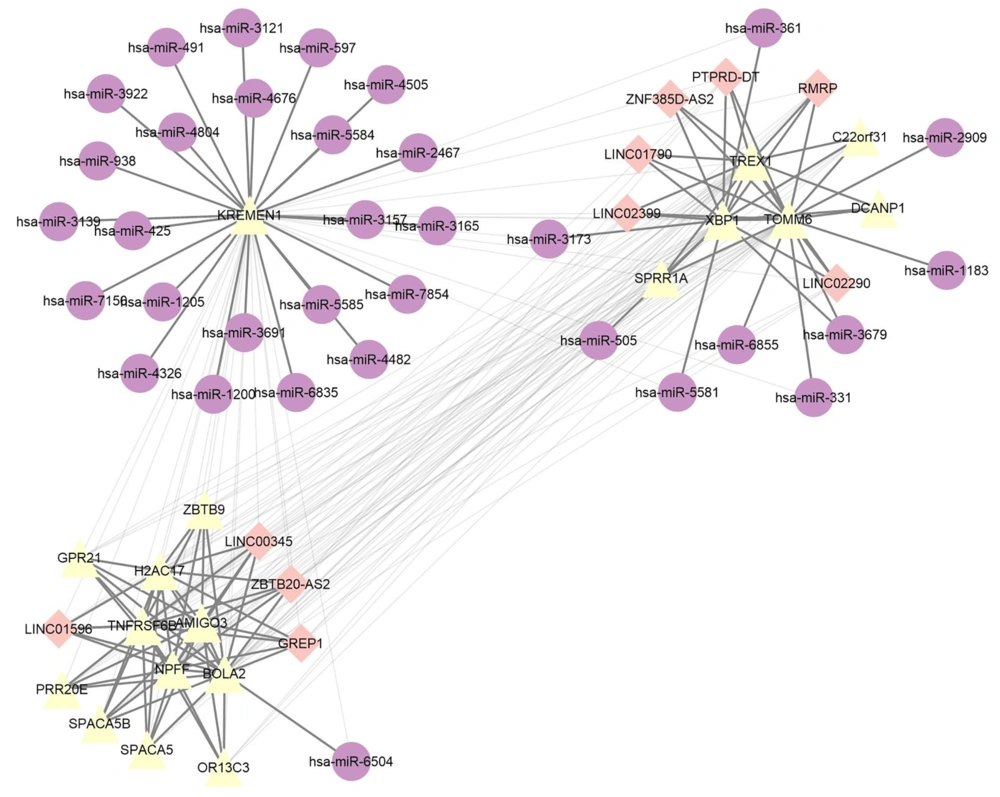
The interaction between lncRNA-miRNA-mRNA in ceRNA network is shown in Figure 3. Purple circles represent miRNAs, pink rhombuses represent lncRNAs, and yellow triangles represent mRNAs. By using the correlation between the ceRNA network in this graph, the key targets in the AML pathway are identified.
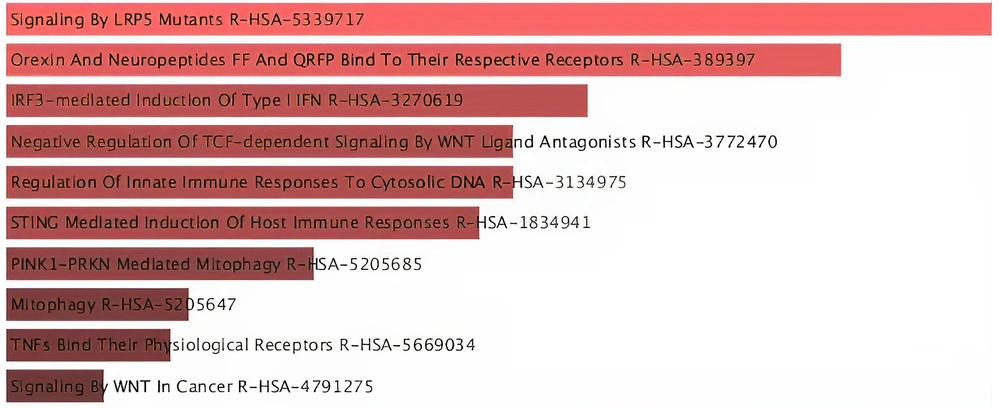
The results of pathways enrichment analysis of mRNAs in brown module according to the Enrichr web server are displayed in Figure 4. The pathways were sorted from top to bottom based on how significant that term is (P-Value < 0.05).
5. Discussion
Acute myeloid leukemia is the most common type of acute leukemia among the adult population and the second most common acute leukemia in children (19). In AML, the understanding of molecular pathways is very important for identifying accurate and potential biomarkers (19). Recent studies have focused on investigating biomarkers to diagnose the condition early and provide more optimal treatment strategies.
The development of ce-RNA (miRNA-lncRNA-mRNA) co-expression network has numerous advantages, including biomarker identification and expression in patient samples using low-cost approaches can be mentioned (13). The present study screens the differentially expressed genes using the WGCNA approach for early diagnosis and prognosis in patients. WGCNA is a system biology method used to identify co-expression networks of genes through expression profiles, including coding and noncoding RNA that are expressed differently (20).
Competing endogenous RNA (ceRNA) network are a set of lncRNAs, pseudogenes, circular RNAs (circRNAs) and mRNAs that compete with each other for miRNAs binding. This approach can reveal novel clinically relevant mRNA, lncRNA and miRNA as potential biomarkers (21, 22). Based on our studies, the significantly different expression levels of genes in AML were identified (Table 1).
A large number of studies have reported that lncRNAs are involved in a wide range of biological regulatory mechanisms such as chromatin remodeling, transcriptional or post transcriptional levels, and cancer pathogenicity (23, 24). In the current study, we analyzed and screened out 7 novel lncRNAs, that were involved in the development of AML which included two up regulated lncRNAs (LINC01596, LINC00345) and five down regulated lncRNAs (LINC01609, LINC01707, LINC02270, LINC02309, LINC02243).
Existing studies have shown that miRNAs mediated post-transcriptionally regulate gene leading to suppression or degradation of mRNAs by binding to microRNA response element (MRE). Its dysregulation involved in many cancer-related signaling pathways and pathological processes (25). By analyzing TCGA AML data, we have identified a novel down regulated miRNA (hsa-miR-6722) as candidate miRNA for further analysis. These AML cancer-specific non-coding RNAs may serve as potential new biomarkers in the diagnosis and predicting the prognosis of AML patients.
Furthermore, we identified two novel up-regulated protein-coding genes (GPR21, OR13C3).
The aforementioned genes are either newly identified as cancer biomarkers that have not been examined in prior research and their potential relevance in leukemia remains unexplored. Nonetheless, the biomarkers we will discuss are those that we have uncovered and whose significance in leukemia has already been examined; our research confirms these prior findings.
In agreement with our study, C Zhou et al showed that XBP1 protein coding, with down regulation, is involved in the development of AML (26). It is stated that the transcription factor JUN is frequently up regulated in different genetic subtypes of acute myeloid leukemia. JUN binds to the promoters of several UPR (unfolded protein response) effectors, such as XBP1 and ATF4, to activate their transcription and allow AML cells to properly control endoplasmic reticulum (ER) stress. Furthermore, we observed that inhibition of XBP1 induces cell apoptosis in AML and significantly delays the time of disease progression in the body. Therefore, the reduction of XBP1 expression is involved in the development of AML disease.
These findings reveal JUN's previously unknown role as a regulator of the UPR, as well as significant novel insights into how ER stress responses lead to AML, and highlight JUN and the UPR as potential therapeutic targets in this disease. According to our studies, XBP1 mRNA is involved in the development of AML with down-regulation (26).
A published real-time PCR study in 2021 claimed that the expression of hsa-miR-374B was significantly down regulated (P-value < 0.0001) in CLL patients. According to their study, hsa-miR-374B might be beneficial biomarker for CLL early detection. The decreased expression of this miRNA may indicate that they play a tumor suppressive role in CLL. As a result, these major changes, which occur in the early stages of the disease, can be considered them as potential biomarkers for CLL diagnosis (27). In our studies, hsa-miR-374B have been up regulated in AML patients.
In the study of Chang et al., the expression level of ZBTB20 was measured using real-time PCR and Western blot. According to this study, ZBTB20 gene has been overexpressed in AML patients' cells by reducing miR-582. Furthermore, by regulating the miR-582-3p/ZBTB20 locus, AML can be suppressed, which may provide a potential therapeutic approach for AML. Depletion of circ-SFMBT2/ZBTB20 inhibited AML cell proliferation, migration, invasion, and glycolysis, which led to apoptosis in AML cells. Circa-SFMBT2 stimulated miR-582-3p, while miR-582-3p inhibited AML growth by targeting ZBTB20. Knocking down circ-SFMBT2 suppresses AML progression by regulating the miR582-3p/ZBTB20 axis, indicating a prospective treatment strategy for AML. Based on the results obtained from our research, ZBTB20 has been up regulated in AML patients (28).
Additionally, in Masanori Ochi et al.'s 2020 studies in AML patients, ZBTB20 expression levels increased (29). Confirming to the results obtained from the gene interactions network, based on the GS level, has-mir-3679, which was one of the up-regulated miRNAs in our studies targeted TOMM6 and XBP1 that both of them are involved in the development of AML. In this network, has-mir-597, which was one of our 5 up-regulated miRNA, targets KREMEN1. Our research is the first study considered the relationship between the mentioned miRNA and the above genes.
Based on the results acquired from the enrichment analysis of protein-coding genes in brown module, several important signaling pathways involved in AML disease have been identified.
In the first pathway, P13K increases the activity of IRF-3 protein. IRF-3 is the main stimulator of interferon (STING) genes, which activates immune responses against tumors (30, 31). As a result of STING activation, the downstream pathways such as nuclear factor κB (NF-κB) signaling and autophagy are stimulated (32).
In the second pathway, genetic reduction of IRF3 significantly activates the proliferation of intestinal epithelial cells through the Wnt signaling pathway. When IRF3 is not expressed, it is associated with active β-catenin in the cytoplasm and prevents the nuclear transfer and cell proliferation of β-catenin. Therefore, IRF3 is considered a negative regulator of the Wnt/β-catenin pathway as well as a potential prognostic marker for Wnt-related tumorigenesis (33).
In the third pathway, The Frizzled and LRP5/6 receptors of the standard Wnt signaling pathway are activated through the β-catenin-TCF/LEF-dependent transcription mechanism, which causes the up-regulation of certain genes such as MYC, CCND1, LGR5. In cancer, the non-standard pathway of Wnt signaling interferes with TGFβ (transforming growth factor-β) signaling cascades, while the activation of TGFβ signaling network causes immune system escape (34).
In the last pathway, as a result of oxidative phosphorylation of ATP, reactive oxygen species (ROS) are produced, which leads to toxicity and cell death. PINK1 and PARKIN are two proteins that destroy mitochondria through mitophagy and thus maintain cell cohesion (35-37).
There were some limitations to our study. First, the predicted results are based on public data analysis by bioinformatics approaches and requires confirmation by experimental data. Second, the present work provides a comprehensive analysis of gene expression from TCGA data only. We suggest combining these results with the analysis of GEO datasets to more thoroughly comprehend and explore the underlying molecular mechanisms and clinical value of biomarkers involved in the development of AML.
5.1. Conclusions
Ultimately, we recognized a gene co-expression module correlated with AML and investigated the entailed hub genes. Furthermore, we identified numerous critical signaling pathways known to be implicated in AML. Our findings contribute to an improved comprehension of the tumorigenesis and progression of AML. Our discovery of biomarkers that have been previously investigated in several cancers and their contribution and significance, may significantly affect the prognosis and treatment of AML patients.


