


1. Background
Glioblastoma (GBM) represents one of the most common cancers affecting the central nervous system. Despite recent improvements in therapeutic methods, there is an immediate need to discover new and efficient treatment options for managing GBM, since the average survival duration ranges from 12 to 15 months (1). The progression of GBM is a complex process marked by numerous genetic and epigenetic alterations, including deletions and/or amplifications of chromosomal regions, loss of heterozygosity (LOH), single-nucleotide polymorphisms (SNPs), and uncontrolled promoter methylation, resulting in the downregulation of tumor-inhibiting genes or activation of oncogenic genes (1).
Recent molecular research suggests that microRNAs (miRNAs) act as either oncogenes or tumor suppressors. They are capable of regulating various cellular processes, including growth, migration, angiogenesis, cell death (apoptosis), and metastasis by regulating the expression of their associated genes (2, 3). The miRNAs are naturally occurring small RNA molecules (18 - 23 nucleotides) that control the expression of specific mRNAs by directly binding to their target sequences and regulating their transcription and translation processes. The miRNAs are emerging as novel prognostic biomarkers for GBM, which are associated with drug resistance, tumor metastasis, and recurrence. The miRNAs may function as potential oncogenic or tumor-suppressive molecules by regulating multiple oncogenic cellular signaling routes, including the PI3K/AKT and Wnt/β-catenin signaling pathways, as supported by accumulating evidence. It has been shown that the upregulation of canonical Wnt signaling has an essential function in the proliferation and advancement of tumor cells across different human cancers, including GBM, breast, colorectal, and liver cancers (4, 5).
The miRNAs regulate Wnt/-catenin signaling by downregulating tumor suppressor proteins such as GSK-3 and APC or inhibiting Wnt signaling downstream targets such as cyclin D1 and -catenin proteins (Table 1). Some of them, like miRNAs such as miR-144-3p, miR-138-2-3p, miR-146b-5p, miR-370, miR-181c, and miR-150-5p, have all been shown to inhibit GBM initiation and invasion by targeting catenin proteins (6-11). Recent findings indicate that the regulatory mechanism of miRNAs on canonical Wnt signaling may occur through the regulation of specific transcription factors, such as T-cell factor (TCF) (12). Further studies demonstrated that miR-24, miR-27a, and miR-92b have inhibitory effects on GBM cell growth and metastasis by suppressing TFs like TCF4, SOX7, or FBXW7 (12-15). However, additional research is needed to explore the regulatory roles of miRNAs, transcription factors, and mRNAs in GBM tumorigenesis. Microarray analysis shows the changes in all genes that are expressed at a given time point, and the analysis of these data has important results about gene interactions.
| Molecular Alteration | Target |
|---|---|
| Upregulation | |
| miR-19 | β-catenin/TCF4 |
| miR-21 | β-catenin and Sox2 |
| miR-22-3-p | β-catenin |
| miR-22-5-p | |
| miR-24 | β-catenin/TCF4 |
| miR-27a | β-catenin/TCF4 and SFRP1 |
| miR-92b | β-catenin/TCF4 and NLK |
| miR-106a-5p | APC |
| miR-135b | GSK-3 β |
| miR-296-3p | β-catenin |
| miR-603 | β-catenin, WIF1, and CTNNBIP1 |
| miR-1249 | APC2 |
| miR-4476 | APC |
| Downregulation | |
| miR-34a | GSK-3β |
| miR-101 | GSK-3β |
| miR-124a | IQGAP1 and β-catenin |
| miR-126-3p | β-catenin and Sox2 |
| miR-137 | EZH2 and β-catenin |
| miR-138 | AKT and MMP2 |
| miR-138-2-3p | β-catenin |
| miR-139-5p | Flt1 and β-catenin |
| miR-142-5p | Wnt3a and β-catenin |
| miR-144-3p | β-catenin |
| miR-146b-5p | β-catenin |
| miR-150-5p | β-catenin |
| miR-181c | β-catenin |
| miR-188 | β-catenin |
| miR-206 | Frizzled 7 |
| miR-211 | β-catenin |
| miR-320a | β-catenin, cyclin D1, and MMPs (2, 7) |
| miR-370-3p | β-catenin |
| miR-370 | β-catenin |
| miR-449b-5p | Wnt2b |
| miR-505-3p | AKT |
| miR-577 | LRP6 and β-catenin |
| miR-708 | β-catenin |
| miR-769-3p | ZEB2 |
| miR-1825 | CDK-14 |
List of the Dysregulated MicroRNAs Inhibiting Glioblastoma Tumorigenesis, Their Molecular Alterations, and Targets in the Wnt/β-catenin Signaling Pathway
2. Objectives
In this study, we identified Wnt-related differentially expressed genes (DEGs) controlled by miRNAs and transcription factors in GBM. This research helps in a more precise identification of gene interactions in GBM tumorigenesis, offering valuable information for future studies.
3. Methods
3.1. Literature and Database Mining
The initial selection of miRNAs associated with the Wnt/β-catenin signaling pathway was based on a previously published review article titled 'Regulatory role of miRNAs on Wnt/β-catenin signaling in tumorigenesis of glioblastoma' by Rahmani et al. (16). miRNAs were divided into 2 groups: Upregulated and downregulated miRNAs. The miRNA-targeted genes were identified using the miRDB database, an accessible resource containing annotated and published miRNA sequences, and miRNA-gene interactions were selected with a score of > 90.
3.2. Protein Network Analysis
In order to predict protein-protein interactions (PPIs), the STRING database version 11.5 was employed. This database compiles both direct and indirect interaction data. These interactions are sourced from computational methods, cross-species knowledge transfer, and curated information from primary literature. For further analysis and visualization of these complex networks, Cytoscape software (version 3.9.1), an open-source tool for visualizing biological networks, was utilized. Cytoscape provides a flexible framework for integrating various attribute data, making it a crucial tool for network analysis. To identify key hub proteins within the network, the Cytohubba plugin (version 0.1) was used, which includes multiple topological algorithms. These methods provide a comprehensive approach for identifying significant hub proteins in the network. The ranking of hub proteins, as shown in Tables 2 and 3, was determined based on their scores calculated using 3 topological algorithms: Maximal Clique Centrality (MCC), Degree, and Maximum Neighborhood Component (MNC) (within the CytoHubba plugin in Cytoscape. Higher-ranked proteins demonstrate greater centrality and potential regulatory significance within the PPI network.
| Hob Proteins | Method | Rank |
|---|---|---|
| FN1 | MCC/MNC/Degree | 2, 4, 4 |
| JUN | MCC/MNC/Degree | 3, 2, 1 |
| RHOA | MCC/MNC/Degree | 5, 3, 3 |
| PTEN | MNC/Degree | 1, 2 |
| SIRT1 | MNC/Degree | 5, 5 |
| CD44 | MCC | 1 |
| IGF1 | MCC | 4 |
| AGK | DMNC | 1 |
| BCLAF1 | DMNC | 2 |
| TRAK1 | DMNC | 3 |
| SGCE | DMNC | 4 |
| AEBP2 | DMNC | 4 |
Key Hub Proteins in Genes Modulated by Downregulated MicroRNAs
| Hob Proteins | Method | Rank |
|---|---|---|
| EGFR | MNC/Degree | 1, 1 |
| KRAS | MNC/Degree | 2, 2 |
| STAT3 | MNC/Degree | 3, 3 |
| SIRT1 | MNC/Degree | 4, 5 |
| GRIA2 | MNC/Degree | 5, 4 |
| SNAP25 | MCC | 1 |
| SYP | MCC | 2 |
| SLC17A7 | MCC | 3 |
| CPLX2 | MCC | 4 |
| SLC17A6 | MCC | 5 |
| PANK1 | DMNC | 1 |
| NCALD | DMNC | 1 |
| SV2B | DMNC | 3 |
| CCNJL | DMNC | 4 |
| GNS | DMNC | 5 |
Key Hub Proteins in Genes Modulated by Upregulated MicroRNAs
3.3. Functional and Pathway Enrichment Analysis
To better understand the roles and interactions of the identified genes, enrichment analyses were performed. Gene Ontology (GO) analysis was carried out using STRING version 11.5. The GO provides a comprehensive framework for annotating genes or gene products by examining 3 main domains: Biological processes (BPs), molecular functions (MFs), and cellular components (CC), giving insights into their functional roles and cellular locations. The Pathway analysis was conducted through KEGG enrichment using the STRING platform.
3.4. Analysis of the Network's Clusters
The network's nodes were grouped using CytoCluster (version 2.1.0) to facilitate the identification of significant clusters. For cluster analysis within the subnetwork, the identification of protein complexes was conducted using the integrated protein complex analysis (IPCA) technique. A threshold value of 2 was applied to define the clusters. STRING (version 11.5) was, then, employed to perform a detailed analysis of each cluster's genes, focusing on identifying the KEGG pathways associated with them (17, 18).
3.5. Promoter Motif Analysis of Hub Genes
To examine the promoter regions of hub genes, upstream flanking regions (UFRs) covering 1 kilobase pair (1 kbp) were obtained from the Ensembl database. These sequences were analyzed for motif identification using MEME Suite (version 5.5.2). The default settings were used, with specific adjustments to the P and E values, which were set to 0.01 for enhanced accuracy (19). To remove redundant motifs and detect known cis-regulatory elements (CREs), Tomtom (version 5.5.2) was applied, utilizing the JASPAR CORE 2022 database for reference (20). Additionally, the GoMo tool was employed to predict the potential biological functions of the identified motifs. This analysis provided deeper insights into the regulatory elements within the promoter regions of the hub genes (21).
4. Results
4.1. Protein-Protein Interaction Networks and Hub Analysis of Dysregulated MicroRNA-Targeted Genes
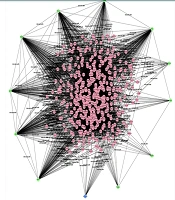
In this study, we analyzed the role of dysregulated miRNAs in regulating the Wnt/β-catenin signaling pathway in GBM. A total of 1 685 and 1 313 target genes were identified for downregulated and upregulated miRNAs, respectively. The gene interaction networks are illustrated in Figures 1 and 2. A variety of miRNAs show altered expression patterns in GBM, playing significant roles in the proliferation and spread of cancer cells by directly influencing specific oncogenes or tumor-suppressing genes in glioma (22, 23). These miRNAs contribute to GBM development by modulating key oncogenes and tumor suppressors. To better understand their impact, we conducted a network analysis using proteins with interaction scores above 90. Hub proteins were identified using the CytoHubba plugin in Cytoscape (Tables 2 and 3).
 presented by cytoscape software")
Network of proteins targeted by the downregulated microRNA (miRNA) presented by cytoscape software
 presented by cytoscape software")
Network of proteins targeted by the upregulated microRNA (miRNA) presented by cytoscape software
For downregulated miRNAs, key hub proteins included FN1, JUN, RHOA, PTEN, and SIRT1, identified by multiple topological algorithms (MCC, MNC, degree). Additional hubs like CD44, IGF1, AGK, and TRAK1 were detected by single algorithms. In the upregulated group, hub proteins such as EGFR, KRAS, STAT3, SIRT1, and GRIA2 were prominent, with other hubs including SNAP25, SYP, and PANK1.
Overall, 12 unique hub proteins were consistently identified, several of which (e.g., SIRT1, STAT3) appeared in both regulatory groups, suggesting central roles in the Wnt/β-catenin network and its crosstalk with other oncogenic pathways (Figures 3 and 4).
 shown in <a href=\"#A156834TBL3\">Table 3</a>.")
Subnetwork of hob proteins targeted by downregulated microRNA (miRNA) shown in Table 3.
 shown in <a href=\"#A156834TBL4\">Table 4</a>.")
Subnetwork of hob proteins targeted by upregulated microRNAs (miRNAs) shown in Table 4.
| Clusters | Ranks | Nodes | Edges | Functions |
|---|---|---|---|---|
| 1 | 1 | 28 | 249 | |
| Metabolism of inositol phosphate | ||||
| EGFR tyrosine kinase inhibitor resistance | ||||
| Endocrine resistance | ||||
| MAPK pathway | ||||
| ErbB pathway | ||||
| 2 | 2 | 26 | 216 | |
| Bacterial attack of epithelial cells | ||||
| Renal cell carcinoma | ||||
| EGFR tyrosine kinase inhibitor resistance | ||||
| Aldosterone-regulated sodium reabsorption | ||||
| T cell receptor pathway | ||||
| 3 | 3 | 26 | 199 | |
| EGFR tyrosine kinase inhibitor resistance | ||||
| Colorectal cancer | ||||
| FoxO pathway | ||||
| AGE-RAGE pathway in diabetic complications | ||||
| Apoptosis - multiple species | ||||
| 4 | 4 | 24 | 195 | |
| Adherens junction | ||||
| TGF-beta pathway | ||||
| AGE-RAGE pathway in diabetic complications | ||||
| Colorectal cancer | ||||
| Bacterial invasion of epithelial cells | ||||
| 5 | 5 | 24 | 204 | |
| EGFR tyrosine kinase inhibitor resistance | ||||
| Bacterial invasion of epithelial cells | ||||
| Renal cell carcinoma | ||||
| Aldosterone-regulated sodium reabsorption | ||||
| Central carbon metabolism in cancer |
Leading 5 Subnetwork Clusters from CytoCluster Analysis for Downregulated MicroRNA Targets
4.2. Functional and Pathway Enrichment Analysis
Subnetwork analysis is used to predict key pathways and significant processes within hub protein connections. In order to elucidate crucial pathways and processes in miRNA-targeted genes, hub protein interactions were subjected to subnetwork analysis. The GO database is one of the most comprehensive global resources for information on gene function, offering a basis for computational studies in large-scale molecular biology and genetic research (24). The GO analysis was conducted by examining BP, MF, and CC of the hub protein subnetwork (Figure 5). The Go analysis recognized 1,708 BPs, including positive regulation of BPs, negative regulation of cellular processes, regulation of developmental processes, positive cellular regulation, and regulation of multicellular organismal processes. In addition, 132 CCs were identified, including intracellular, nucleoplasm, nuclear lumen, intracellular organelle lumen, and protein-containing complex. Furthermore, 134 MFs were found, including protein binding, enzyme binding, MF regulator, and signaling receptor binding.
: Cellular component (CC); C, GO: Molecular function (MF); D, KEGG pathway enrichment for subnetwork genes modulated by downregulated microRNAs (miRNAs).")
A, Biological process; B, Gene Ontology (GO): Cellular component (CC); C, GO: Molecular function (MF); D, KEGG pathway enrichment for subnetwork genes modulated by downregulated microRNAs (miRNAs).
KEGG pathway analysis identified 162 pathways, encompassing pathways related to cancer, including PI3K-Akt signaling, FoxO signaling, axon guidance, and focal adhesion, enriched between subnetwork genes in interaction with the hub proteins targeted by downregulated miRNAs. As expected, cancer pathways are enriched in the group of downregulated miRNA-targeted genes, including important proliferation pathways such as PI3K and MAPK.
The GO analysis for the upregulated miRNAs revealed 1 075 BPs, such as localization control, positive regulation of biological activities, cell-to-cell communication, signaling pathways, and cellular process regulation. A total of 166 CCs were recognized, including cell junctions, synaptic regions (presynaptic and postsynaptic), and the plasma membrane. Furthermore, 109 MFs were identified, such as protein binding, enzyme interaction, MF regulation, and protein kinase association. Also, KEGG pathway analysis revealed that miRNAs are involved in targeting several pathways, such as cancer, PI3K-Akt, focal adhesion, and neurotrophin signaling, in genes influenced by upregulated miRNAs (Figures 5 and 6).
: Cellular component (CC); C, GO: Molecular function (MF); D, KEGG pathway enrichment for subnetwork genes modulated by upregulated microRNAs (miRNAs).")
A, Biological process; B, Gene Ontology (GO): Cellular component (CC); C, GO: Molecular function (MF); D, KEGG pathway enrichment for subnetwork genes modulated by upregulated microRNAs (miRNAs).
4.3. Analysis of the Network by Clusters
The organization of biological networks can be uncovered through cluster analysis, which is a crucial technique for detecting practical modules, forecasting protein complexes, and categorizing biomarkers within networks. In this study, subnetwork cluster analysis identified 817 clusters for downregulated miRNA-targeted genes and 706 clusters for upregulated miRNA-targeted genes, from which clusters ranked 1 to 5 were selected. As can be seen in Tables 4 and 5, the proteins that are often targeted by miRNAs with low expression are the proteins and pathways responsible for cell proliferation, angiogenesis, and carbon metabolism, such as HIF and TGF-beta. The reduction of miRNAs targeting these proteins causes an increase in these proteins, which increases the proliferation and growth of cells. On the contrary, the proteins that are targeted by miRNAs with higher expression target most of the pathways of cell connections and communication, and this disruption and reduction of cell communication can reduce the communication between cells, and the messages that prevent cell proliferation between cells are not transferred.
| Clusters | Ranks | Nodes | Edges | KEGG Pathway Enrichment of Nodes |
|---|---|---|---|---|
| 1 | 1 | 20 | 125 | |
| Nicotine addiction | ||||
| Synaptic vesicle cycle | ||||
| Glutamatergic synapse | ||||
| Retrograde endocannabinoid signaling | ||||
| GABAergic synapse | ||||
| 2 | 2 | 20 | 124 | |
| Nicotine addiction | ||||
| Synaptic vesicle cycle | ||||
| Glutamatergic synapse | ||||
| Retrograde endocannabinoid signaling | ||||
| GABAergic synapse | ||||
| 3 | 3 | 18 | 102 | |
| Nicotine addiction | ||||
| Synaptic vesicle cycle | ||||
| Glutamatergic synapse | ||||
| Retrograde endocannabinoid signaling | ||||
| 4 | 4 | 18 | 114 | |
| Nicotine addiction | ||||
| Synaptic vesicle cycle | ||||
| GABAergic synapse | ||||
| Retrograde endocannabinoid signaling | ||||
| 5 | 5 | 18 | 110 | |
| Nicotine addiction | ||||
| Synaptic vesicle cycle | ||||
| Glutamatergic synapse | ||||
| Retrograde endocannabinoid signaling |
Leading 5 Subnetwork Clusters from CytoCluster Analysis for Upregulated MicroRNA Targets
4.4. Promoter Motif Analysis of Hub Genes
Promoter motif analysis of the hub genes targeted by dysregulated miRNAs revealed several conserved CREs. For downregulated miRNAs (Figure 7), the identified motifs were predominantly associated with functions such as negative regulation of signal transduction, transcription corepressor activity, ion transport, and neuron fate commitment. These motifs may contribute to the suppression of tumor-inhibitory pathways when their targeting miRNAs are downregulated. In contrast, motifs identified in the upregulated miRNA-targeted hub genes (Figure 8) were enriched in regulatory functions such as transcription inhibition from RNA polymerase II promoters, signal transduction modulation, and inner ear morphogenesis. Notably, common motifs such as SP1, SP2, and ZN467 were shared across both groups, indicating potential shared regulatory mechanisms. Overall, these findings suggest that dysregulated miRNAs modulate the transcriptional landscape of GBM by targeting key regulatory motifs in promoter regions of critical genes involved in cell signaling, apoptosis, and differentiation (Figures 7 and 8).
-targeted hub proteins")
Promoter analysis of downregulated microRNA (miRNA)-targeted hub proteins
-targeted hub proteins")
Promoter analysis of upregulated microRNA (miRNA)-targeted hub proteins
5. Discussion
In this study, we explored the regulatory role of dysregulated miRNAs on the Wnt/β-catenin signaling pathway in GBM using a systems biology approach. Our analysis revealed that both upregulated and downregulated miRNAs target a wide array of genes within the Wnt signaling network, many of which are critically involved in tumorigenesis, cellular proliferation, and therapy resistance in GBM. Among the downregulated miRNAs, we identified key targets such as PTEN, RHOA, and SIRT1, which are known tumor suppressors. The reduced expression of these miRNAs may lead to overactivation of oncogenic pathways, thereby promoting glioma cell proliferation and invasion. In contrast, upregulated miRNAs were found to target genes like epidermal growth factor receptor (EGFR), KRAS, and STAT3, which are pivotal drivers in GBM progression. These findings highlight the dual and context-dependent roles of miRNAs as either oncogenes or tumor suppressors, depending on their expression levels and target genes.
The identification of hub proteins through PPI network analysis further emphasized the centrality of certain genes in the regulation of tumor-promoting signaling pathways. Proteins such as FN1, JUN, and STAT3 emerged as major nodes in the network, indicating that they may serve as effective therapeutic targets or biomarkers for GBM. In a recent study, Song et al. demonstrated that the upregulation of FN1 reduced the levels of protein tyrosine phosphatase receptor type M (PTPRM) through enhanced methylation, which subsequently led to increased STAT3 phosphorylation and the stimulation of GBM cell proliferation (25). Thompson illustrated how the transcription factor JUN collaborates with YAP-TEAD to promote tumor growth in GBM and also works alongside MRTF-SRF to intensify the activation of cancer-associated fibroblasts, matrix stiffening, and metastasis (26). Cui et al. explored the proliferation of glioma cells, finding that RhoA and COX-2 levels were elevated in brain glioma tissues (27). An animal study performed by Li et al. showed that RhoA protein has a tumor suppressor role in glioma cancer. They demonstrated that Pard3 controls the levels, localization within the cell, and transcriptional activity of RhoA. Experiments using mouse models demonstrated that elevated RhoA expression suppresses glioma cell proliferation in living organisms (28).
PTEN, a well-known tumor suppressor present in nearly all body tissues, has been shown to carry mutations in multiple cancer types, such as glioma, breast, and colorectal cancers. In addition to the role of this protein in causing or promoting the onset of cancers, Ma et al. showed that phosphorylation of PTEN at Y240, facilitated by FGFR, is key to radiation resistance and may serve as a promising target to improve radiotherapy outcomes (29).
In glioma tissues and cell lines, SIRT1 expression was significantly reduced, with elevated levels being linked to better prognosis in glioma patients. Therefore, this protein can be considered a tumor suppressor (30). Increased mRNA levels of EGFR, a type of receptor tyrosine kinase, have been detected in various cancer types and are thought to stimulate the growth of solid tumors (31).
KRAS, a key hub protein, functions as a central node for cellular signaling pathways that drive cell growth and proliferation. Mutations in this protein have been found in various cancer types, including colorectal, breast, prostate, and lung cancers (32). Around 90% of GBM tissues and cell lines showed STAT3 phosphorylation at Tyr-705 and Ser-727, which was positively associated with higher histopathological grades and decreased patient survival (33, 34).
Cluster analysis revealed distinct functional patterns for genes targeted by upregulated and downregulated miRNAs. In the case of downregulated miRNAs, enriched clusters were mainly associated with cancer-related pathways such as MAPK signaling, TGF-β signaling, and central carbon metabolism, suggesting that reduced miRNA expression may lead to the activation of oncogenic processes and enhanced cell proliferation.
In contrast, clusters of upregulated miRNA targets were enriched in synaptic signaling and neuronal communication pathways like glutamatergic synapse, GABAergic synapse, and endocannabinoid signaling. These findings imply that upregulated miRNAs may suppress genes involved in neural-like signaling, potentially affecting tumor–neuron interactions and microenvironmental dynamics.
Overall, the distinct clustering patterns highlight the dual role of miRNAs in GBM, influencing both intrinsic tumor behavior and its interaction with the neural microenvironment.
Promoter analysis demonstrated that certain regulatory elements are commonly found in both downregulated and upregulated miRNA-targeted hub gene groups (Figures 7 and 8). In downregulated miRNA targets, regulatory motifs were associated with anterior/posterior pattern formation, transcription corepression, and estradiol response. Conversely, motifs in upregulated miRNA targets were linked to inhibition of RNA polymerase II-driven transcription and signal transduction. More clearly, the reduction of miRNAs targeting corepressors reduces transcription inhibition and ultimately facilitates transcription and protein synthesis. Anterior-posterior patterning involves the regionalization process that forms distinct regions of cell differentiation along the anterior-posterior axis, leading to cellular polarity. The loss of cellular polarity has been documented in multiple types of cancer (35). Inhibiting transcription and signal transduction pathways can lead to enhanced protein synthesis and increased cell growth (36).
5.1. Conclusions
This study provides a systems-level understanding of how dysregulated miRNAs influence the Wnt/β-catenin signaling pathway in GBM. By integrating bioinformatics tools, we identified key hub genes such as PTEN, STAT3, KRAS, SIRT1, and FN1, which play central roles in tumor progression and resistance mechanisms. Our cluster and promoter motif analyses revealed distinct regulatory patterns for upregulated and downregulated miRNAs, linking them to critical pathways including MAPK, TGF-β, and synaptic signaling. These findings suggest that specific miRNAs and their target genes may serve as potential diagnostic biomarkers or therapeutic targets in GBM. The results of this study pave the way for future experimental validation and the development of miRNA-based precision therapies for GBM.
5.2. Study Limitations
One of the primary limitations of this study is the lack of laboratory validation of the findings. While our research provides valuable insights into the interactions between miRNAs and the Wnt/β-catenin signaling pathway, the conclusions drawn are largely based on computational analyses and existing literature. This approach has several implications; the findings are reliant on previously published data, which may have inherent biases or limitations. Without direct experimental validation, the accuracy and applicability of these results to clinical settings remain uncertain. Biological systems are complex and can exhibit variability that is not captured in computational models. Laboratory experiments can account for this variability and provide a more nuanced understanding of the biological mechanisms involved. To address this limitation, we recommend that future studies include laboratory experiments that validate the computational findings. This could involve in vitro and in vivo studies to confirm the roles of specific miRNAs and their target genes in the Wnt pathway.
