


1. Background
Cancer remains a global health challenge, with its incidence and impact varying across populations and groups due to multifactorial determinants like ethnicity. Differences in cancer occurrence among ethnic groups stem from a complex interplay of socioeconomic, environmental, behavioral, and biological factors, leading to well-documented differences. Examining ethnic trends in cancer mortality and incidence holds significance as it enables the quantification of health inequalities related to cancer between the most and least privileged social groups. Also, this analysis aids in pinpointing specific regions or demographics facing higher risks of cancer diagnosis and mortality, thereby highlighting the groups that could benefit from well-targeted medical and social interventions (1).
The number of new cancer cases in 2017 in Iran was 134,704 cases, 64,788 (48%) of which occurred in women and 69,916 (52%) occurred in men (2). The crude and age-standardized incidence rates of all cancers in the country's population are 166.54 and 168.56 per 100,000 people, respectively.
Iran's demographic landscape comprises numerous ethnicities, including but not limited to Fars, Azeris, Kurds, Lors, Balouchs, and Arabs, each with unique genetic backgrounds, lifestyles, and socio-economic contexts. These ethnic groups often exhibit distinct patterns in disease susceptibility, genetic predispositions, and differential exposures to environmental risk factors, contributing to disparities in health outcomes, including cancer incidence rates (3, 4).
In the exploration of cancer epidemiology, an interesting subject of research emerges in the association between the Human Development Index (HDI) and cancer incidence rates. The HDI, a composite measure encompassing factors such as life expectancy, education, and income, serves as an index of overall societal well-being and development. Understanding how this index correlates with cancer incidence offers valuable insights into the interplay between socioeconomic status, healthcare access, and cancer risk. While the association between higher development levels and increased cancer incidence in some contexts is well-documented, the nuances of this association, including variations across cancer types and geographical regions, need deeper investigation. This article delves into the interconnections between human development and cancer occurrence, shedding light on the implications for public health strategies and the pursuit of equitable cancer prevention and control measures globally.
2. Objectives
Considering the lack of resources in Iran, it seems to be a priority to design cost-effective interventions for different ethnic groups and regions of Iran. This investigation seeks to elucidate the association between ethnicity and cancer incidence rates in Iran, aiming to identify potential variations in cancer incidence among different ethnicities to help health policymakers make better decisions.
3. Methods
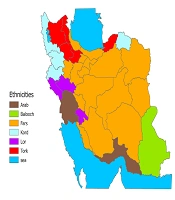
The data on cancer incidence are extracted from Iran's national cancer registration program for all cases of 12 common cancers in Iran, based on the national report of 2016. Iran's cancer registration program is an office in the Ministry of Health, Treatment, and Medical Education, and collects data on pathological samples from public, private, charity, and research centers of public, private, and charity hospitals and the death registry. Data are checked to remove duplicates. In this research, we will extract the age-standardized incidence rate of 12 common cancers in Iran in the form of a census in all provinces based on the national cancer report of 2016. We removed duplicate data and extracted the age-standardized incidence rate of 12 common cancers in Iran in all provinces based on the national cancer report of 2017. We considered each province as Fars, Azeri, Turkmen, Kurd, Lor, Arab, and Balouch based on the study of Basiri et al. (4). In Figure 1, the map of the races considered for each province is shown. In total, 2 Arab provinces, 1 Baloch province, 16 Fars provinces, 4 Kurdish provinces, 3 Lor provinces, and 5 Azeri provinces were considered.

Map of the dominant ethnicity of the Iran's provinces
To calculate the age-standardized incidence rates, the world standard population (18-year-old groups) has been used. For each province of Iran, ASR has been estimated based on its population. To determine the most common cancers in each population and to be able to compare with global reports, including the reports of the international agency for research on cancer (IARC), some groups of cancers have been merged and reported in subgroups. Colon and rectal cancers were merged and formed the "colorectal cancer" group. Cancers of lymphoid leukemia, leukemia, myeloid, and unspecified leukemia were merged and formed the "leukemia" group.
Poisson regression was performed for all cancers. The variables of dominant ethnicity (including Fars, Arab, Baloch, Kurdish, Lor, and Azeri ethnicities) and the province's HDI (numerically between 0 and 1000) were entered into the model. As the Fars ethnicity was the dominant ethnicity of the country, it was considered the reference ethnicity.
For this study, we used the Natural Breaks (Jenks) method to classify the data. Considering that at least 30 polygons (provinces in the case of this study) are needed to examine spatial autocorrelation, for all cancers whose data were available for at least 30 provinces (including all cancers, breast cancer, prostate, colorectal, skin, and stomach), Moran's I Spatial Autocorrelation Index was calculated. For cancers with statistically significant spatial autocorrelation, we conducted a hotspot analysis. A cancer hotspot refers to a geographical area where the incidence of cancer cases is significantly higher than the surrounding regions, and a coldspot is a geographical area where the incidence of cancer cases is significantly lower than the surrounding regions. We used the Getis-Ord Gi* statistic for each province. The resultant z-scores and P-values were used to indicate where features with either high or low values cluster spatially, and based on these, we determined the hotspots and coldspots.
Stata 11.0 and ArcGIS Pro 3.0 were used for the statistical and spatial analysis of data. An α lower than 0.05 is considered a statistically significant difference.
4. Results
According to the results obtained from the data of the national cancer registration system in 2016, the average standardized incidence rate for all cancers in Iran was 154.98 (standard deviation = 30.20) per 100,000 people. Among cancers, the highest incidence rate for breast cancer was 33.64 (standard deviation = 11.46) per 100,000 people, and the lowest incidence rate was for ovarian cancer at 5.21 (standard deviation = 1.31) (Table 1).
| Province | All Cancers | Breast | Prostate | Colorectal | Skin | Stomach | Lung | Bladder | Thyroid | Leukemia | Esophagus | Ovary | Uterine | Brain | Non-hodgkin's Lymphoma | Other/Unspecified |
|---|---|---|---|---|---|---|---|---|---|---|---|---|---|---|---|---|
| East Azarbaijan | 183.13 | 38.4 | 19.66 | 17.98 | 17.9 | 21.31 | 7.27 | 1.74 | 9.97 | 8.83 | 7.14 | 6.45 | 6.6 | 4.66 | - | 4.13 |
| West Azarbaijan | 18.31 | 27.54 | 18.51 | 14.64 | 18.37 | 23.58 | 13.78 | 8.59 | 3.29 | 6.72 | 1.99 | 4.76 | 4.4 | 8.22 | - | 9.72 |
| Ardabil | 164.14 | 24.94 | 11.23 | 17.28 | 14.24 | 28.13 | 1.36 | 5.56 | 5.34 | 6.24 | 11.93 | 5.57 | 3.42 | 6.58 | - | - |
| Isfahan | 192.98 | 51.92 | 22.95 | 18.2 | 22.4 | 9.34 | 7.8 | 1.47 | 11.32 | 13.47 | - | 7.78 | 7.66 | - | - | 7.32 |
| Alborz | 16.6 | 47.63 | 25.1 | 17.78 | 12.14 | 12.62 | 7.88 | 8.31 | 6.97 | - | 5.6 | 5.64 | 5.91 | - | 6.6 | |
| Ilam | 184.4 | 4.48 | 16.2 | 18.99 | 18.93 | 22.61 | 6.28 | - | 6.17 | 9.62 | 8.8 | - | 4.97 | 5.67 | 7.96 | 7.17 |
| Bushehr | 135.6 | 31.67 | 12.95 | 11.98 | 1.9 | - | 8.93 | 1.67 | 9.1 | 6.74 | - | 5.6 | 7.8 | 4.54 | 6.53 | |
| Tehran | 184.54 | 57.5 | 28.92 | 2.46 | 15.5 | 11.76 | 9.9 | 1.95 | 6.7 | - | - | 6.89 | 7.91 | 6.17 | - | 5.97 |
| Chaharmahal and Bakhtiyari | 157.43 | 24.78 | 18.78 | 13.31 | 19.28 | 1.49 | - | 15.57 | 11.98 | 6.45 | 5.7 | - | - | 4.77 | 5.14 | 6.34 |
| South Khorasan | 117.48 | 23.44 | - | 9.77 | 11.9 | 9.57 | 7.53 | - | - | 6.36 | 7.4 | - | 3.69 | 4.7 | - | - |
| Khorasan Razavi | 184.46 | 31.46 | 12.88 | 17.14 | 15.87 | 19.81 | 9.65 | 6.4 | - | 9.18 | 8.34 | - | 13.9 | 1.36 | - | 8.37 |
| North Khorasan | 129.59 | 16.62 | 6.35 | 1.92 | 16.74 | 13.99 | 5.38 | 5.59 | 4.16 | - | 1.4 | - | - | 5.71 | - | 8.16 |
| Khuzestan | 168.42 | 46.47 | 24.34 | 13.2 | 16.26 | 1.76 | 8.82 | 9.52 | - | 7.94 | - | - | 7.35 | 5.65 | 6.83 | 6.53 |
| Zanjan | 96.56 | 21.18 | 11.4 | 1.62 | 13.58 | 11.47 | 6.13 | 4.5 | 3.14 | - | 5.96 | 2.64 | - | - | 2.1 | 2.48 |
| Semnan | 138.36 | 4.9 | 15.5 | 15.9 | 13.7 | 12.79 | 6.44 | 9.17 | - | 6.74 | 4.46 | 4.83 | 7.4 | 5.86 | - | - |
| Sistan and Balouchestan | 88.19 | 14.21 | 4.72 | 5.66 | 5.75 | 7.77 | - | 4.63 | - | 3.24 | 4.41 | 4.53 | - | 3.58 | - | 6.56 |
| Fars | 185.1 | 44.46 | 25.3 | 13.1 | 15.1 | 1.27 | 9.48 | 1.78 | 11.29 | 11.98 | - | - | 7.5 | 8.64 | - | 7.71 |
| Qazvin | 139.3 | 3.96 | 13.42 | 14.59 | 14.48 | 12.39 | 9.63 | 7.27 | 4.9 | 4.62 | - | - | - | 5.81 | - | - |
| Qom | 186.2 | 39.47 | 22.82 | 18.53 | 15.22 | 13.34 | 8.63 | 12.61 | 1.98 | 13.32 | - | - | 6.61 | 5.17 | - | 16.26 |
| Kordestan | 136.3 | 25.55 | 11.55 | 1.29 | 17.98 | 14.89 | 6.26 | 4.28 | 3.74 | 5.57 | 7.78 | - | - | 5.42 | - | 7.24 |
| Kerman | 161.75 | 36.95 | 14.45 | 1.54 | 16.6 | 1.21 | 12.93 | 12.65 | 5.71 | 6.65 | - | - | 6.1 | 7.94 | - | 7.99 |
| Kermanshah | 158.53 | 16.67 | 11.85 | 11.71 | 14.3 | 1.73 | 8.8 | 5.95 | 5.86 | 8.88 | - | - | - | 5.14 | - | 1.98 |
| Kohgilouye and Boyerahmad | 144.4 | 2.53 | 15.1 | 1.43 | 19.26 | 17.62 | 7.17 | - | 17.13 | 7.9 | - | 4.39 | - | 5.23 | 4.91 | - |
| Golestan | 18.93 | 4.97 | 17.43 | 17.22 | 9.51 | 2.53 | 14.87 | 6.14 | - | 9.38 | - | - | 5.31 | 6.18 | - | - |
| Gilan | 175.86 | 47.97 | 24.6 | 19.31 | 11.81 | 16.5 | 8.59 | 9.41 | 1.25 | 8.98 | - | - | 7.8 | 5.99 | - | 4.17 |
| Lorestan | 101.29 | 17.71 | 7.12 | 8.76 | 8.8 | 1.69 | 4.28 | 6.6 | 3.35 | 3.58 | 3.6 | - | - | - | 6.76 | 5.95 |
| Mazandaran | - | 42.41 | 24.77 | 17.95 | 15.66 | 18.15 | 8.8 | 6.73 | 6.79 | 7.79 | - | - | 7.34 | - | 5.66 | 17.73 |
| Markazi | 149.87 | 36.64 | 15.79 | 15.39 | 14.34 | 11.41 | 8.16 | 7.91 | 6.13 | - | - | 4.4 | - | 7.1 | - | 12.5 |
| Hormozgan | 105.77 | 29.45 | 1.86 | 8.79 | 6.33 | 5.55 | 6.76 | - | 3.49 | 6.1 | - | - | 4.44 | - | 5.2 | |
| Hamedan | 136.55 | 26.49 | 17.53 | 12.2 | 13.3 | 12.88 | 8.84 | 7.25 | 4.61 | 6.46 | - | - | 4.2 | 5.51 | - | 5.66 |
| Yazd | 198.4 | 48.7 | 24.98 | 19.13 | 22.47 | 7.95 | 7.7 | 8.32 | 22.81 | 6.9 | - | - | 1.53 | 7.4 | 7.18 | |
| National Average | 154.98 | 33.64 | 16.5 | 14.22 | 14.74 | 13.97 | 8.47 | 8.35 | 7.68 | 7.62 | 7.45 | 5.21 | 6.56 | 6.15 | 5.7 | 7.78 |
Among the provinces of Iran, Yazd province, with a standardized incidence rate of 198.04, had the highest, and Sistan and Baluchistan province had the lowest incidence rate for all cancers, with a standardized incidence rate of 88.19 per 100,000 people.
In Figure 2, darker colors indicate higher standardized incidence rates for all cancers. As shown in the picture, the high standardized incidence rates for all cancers are concentrated in the center of Iran, and the provinces with lower standardized incidence rates are located in the southeast of the country.

Map of the average standardized incidence rate of all cancers in 2017
Among ethnicities, Fars ethnicity had the highest average standardized incidence rate for all cancers (165.23, standard deviation 24.26) while Baloch ethnicity had the lowest standardized incidence rate for all cancers (88.19) (Table 2).
| Cancer | Fars | Balouch b | Arab | Kurdish | Lor | Azeri |
|---|---|---|---|---|---|---|
| All cancers | 165.23 ± 24.26 | 88.19 | 137.10 ± 44.30 | 151.18 ± 23.2 | 143.12 ± 41.38 | 152.81 ± 36.0 |
| Breast | 39.45 ± 1.1 | 14.21 | 37.96 ± 12.3 | 21.60 ± 5.77 | 26.24 ± 12.41 | 31.29 ± 8.47 |
| Prostate | 19.53 ± 6.22 | 4.72 | 17.60 ± 9.53 | 12.7 ± 4.98 | 12.75 ± 4.89 | 14.56 ± 3.84 |
| Colorectal | 15.60 ± 3.40 | 5.66 | 11.0 ± 3.12 | 11.89 ± 1.92 | 12.73 ± 5.49 | 15.54 ± 3.4 |
| Skin | 15.33 ± 3.44 | 5.75 | 11.30 ± 7.2 | 16.85 ± 1.84 | 15.42 ± 6.36 | 13.94 ± 2.99 |
| Stomach | 12.47 ± 3.35 | 7.77 | 8.16 ± 3.68 | 15.80 ± 5.49 | 16.97 ± 5.99 | 18.77 ± 6.91 |
| Lung | 8.70 ± 1.51 | - c | 7.79 ± 1.46 | 8.38 ± 3.77 | 5.91 ± 1.48 | 9.65 ± 3.38 |
| Bladder | 9.81 ± 2.52 | 4.63 | 9.52 | 6.10 ± 1.81 | 6.6 | 6.75 ± 2.51 |
| Thyroid | 9.80 ± 4.83 | 4.0 | 3.49 | 4.26 ± 1.12 | 8.88 ± 7.28 | 5.84 ± 2.91 |
| Leukemia | 8.43 ± 2.61 | 3.24 | 7.2 ± 1.30 | 7.6 ± 1.68 | 6.76 ± 3.3 | 7.27 ± 2.23 |
| Esophagus | 6.48 ± 1.73 | 4.41 | - c | 9.72 ± 1.71 | 6.20 ± 3.68 | 8.34 ± 3.16 |
| Ovary | 5.70 ± 1.39 | 4.53 | - c | 4.76 ± | 4.39 | 4.89 ± 1.99 |
| Uterine | 7.25 ± 2.45 | - c | 5.90 ± 2.6 | 6.2 ± 2.80 | 4.97 | 4.93 ± 1.36 |
| Brain | 6.61 ± 1.67 | 3.58 | 5.65 | 6.12 ± 1.42 | 5.45 | 5.81 |
| Non-hodgkin's lymphoma | 5.69 ± 1.23 | - c | 6.83 | - c | 6.54 ± 1.54 | 2.10 |
| Other/unspecified | 8.60 ± 4.3 | 6.56 | 5.87 | 9.3 ± 1.66 | 6.56 | 3.31 ± 1.17 |
a The values are expressed as mean ± SD.
b Since the Baloch ethnicity was recognized as the dominant ethnicity only in Sistan and Baluchistan province, the average is equal to the numbers reported from this province and, for this reason, the standard deviation cannot be calculated either.
c There were no available cancer statistics for provinces where this ethnicity is the majority.
The average HDI for the whole country was 0.780 (standard deviation = 0.031), and Sistan Baluchistan province had the lowest (0.679), and Tehran and Alborz provinces had the highest (0.825) (Figure 3).
 map of the provinces")
Human Development Index (HDI) map of the provinces
For breast, prostate, colorectal, skin, and stomach cancers, Moran's I Spatial Autocorrelation Index was calculated (Table 3). Significant spatial autocorrelation was observed for colorectal and stomach cancers in the direction of clustering.
| Cancers | Moran’s I Index | Expected Value | z-Value | P-Value |
|---|---|---|---|---|
| All cancers | -0.17486 | -0.03333 | -1.38905 | 0.164817 |
| Breast | 0.05194 | -0.03333 | 0.83148 | 0.405698 |
| Prostate | 0.91708 | -0.03333 | 1.22092 | 0.222116 |
| Colorectal | 0.17855 | -0.03333 | 2.66211 | 0.038809 |
| Skin | -0.11817 | -0.03333 | -0.84243 | 0.399548 |
| Stomach | 0.18040 | -0.03448 | 2.57275 | 0.03966 |
Hotspot analysis was also performed (Figures 4 and 5). For stomach cancer, at a significant level of 95%, East Azarbaijan, West Azarbaijan, and Ardabil provinces were recognized as hotspots, and Kerman province as a coldspot. For colorectal cancer, at a significant level of 95%, Semnan, Tehran, Mazandaran, and Gilan provinces were recognized as hotspots, and Kerman and Sistan and Baluchistan provinces were also recognized as coldspots.

Map of hotspots and coldspots of stomach cancer in 2017

Map of hotspots and coldspots of colorectal cancer in 2017
Among the models, only the models related to all cancers, breast, prostate, colorectal, skin, and thyroid cancer were able to significantly predict the related cancer’s incidence. In the significant models, the Lor ethnicity was the only protective ethnicity for “all cancers” and “breast cancer”. The HDI was the only significant factor in all significant models, except for skin cancer (Table 4). The HDI was identified as a risk factor in all these models.
| Cancer | IRR | 95% Confidence Interval (Limit) (Lower/Upper) | P-Value | Goodness of Fit | |
|---|---|---|---|---|---|
| Pseudo R2 | P-Value | ||||
| All Cancers | 0.2125 | 0.0001 | |||
| Balouch | 0.89 | 0.67/1.17 | 0.39 | ||
| Arab | 0.90 | 0.80/1.03 | 0.13 | ||
| Kurdish | 1.10 | 0.99/1.23 | 0.08 | ||
| Lor | 0.90 | 0.81/1.00 | 0.05 | ||
| Azeri | 1.04 | 0.95/1.14 | 0.37 | ||
| HDI | 1.00 | 1.00/1.01 | 0.00 | ||
| Constant | 5.37 | 1.68/17.18 | 0.01 | ||
| Breast | 0.3048 | 0.0001 | |||
| Balouch | 1.04 | 0.54/2.00 | 0.895 | ||
| Arab | 1.16 | 0.90/1.48 | 0.249 | ||
| Kurdish | 0.80 | 0.62/1.05 | 0.106 | ||
| Lor | 0.73 | 0.58/0.93 | 0.009 | ||
| Azeri | 1.03 | 0.84/1.25 | 0.806 | ||
| HDI | 1.01 | 1.01/1.01 | 0.000 | ||
| Constant | 0.03 | 0.00/0.40 | 0.008 | ||
| Prostate | 0.2415 | 0.0001 | |||
| Balouch | 0.93 | 0.32/2.70 | 0.893 | ||
| Arab | 1.14 | 0.79/1.64 | 0.480 | ||
| Kurdish | 1.00 | 0.70/1.44 | 0.984 | ||
| Lor | 0.74 | 0.52/1.03 | 0.078 | ||
| Azeri | 1.03 | 0.77/1.38 | 0.820 | ||
| HDI | 1.01 | 1.01/1.02 | 0.000 | ||
| Constant | 0.00 | 0.00/0.09 | 0.001 | ||
| Colorectal | 0.1215 | 0.0019 | |||
| Balouch | 0.82 | 0.30/2.27 | 0.704 | ||
| Arab | 0.81 | 0.52/1.27 | 0.359 | ||
| Kurdish | 1.02 | 0.70/1.49 | 0.897 | ||
| Lor | 0.87 | 0.62/1.23 | 0.447 | ||
| Azeri | 1.21 | 0.90/1.62 | 0.200 | ||
| HDI | 1.01 | 1.00/1.01 | 0.006 | ||
| Constant | 0.06 | 0.00/3.18 | 0.168 | ||
| Skin | 0.0719 | 0.0503 | |||
| Balouch | 0.55 | 0.20/1.49 | 0.239 | ||
| Arab | 0.79 | 0.51/1.22 | 0.286 | ||
| Kurdish | 1.26 | 0.90/1.77 | 0.174 | ||
| Lor | 1.04 | 0.76/1.43 | 0.817 | ||
| Azeri | 1.00 | 0.74/1.34 | 0.974 | ||
| HDI | 1.00 | 1.00/1.01 | 0.177 | ||
| Constant | 1.17 | 0.03/49.25 | 0.936 | ||
| Stomach | 0.1153 | 0.0014 | |||
| Balouch | 0.58 | 0.23/1.46 | 0.249 | ||
| Arab | 0.65 | 0.39/1.08 | 0.097 | ||
| Kurdish | 1.23 | 0.87/1.76 | 0.244 | ||
| Lor | 1.35 | 0.99/1.85 | 0.058 | ||
| Azeri | 1.48 | 1.12/1.96 | 0.006 | ||
| HDI | 1.00 | 0.99/1.00 | 0.813 | ||
| Constant | 20.11 | 0.38/1060.50 | 0.138 | ||
| Lung | 0.0274 | 0.6036 | |||
| Balouch | |||||
| Arab | 0.88 | 0.52/1.52 | 0.657 | ||
| Kurdish | 0.94 | 0.59/1.50 | 0.790 | ||
| Lor | 0.68 | 0.41/1.11 | 0.124 | ||
| Azeri | 1.09 | 0.75/1.58 | 0.644 | ||
| HDI | 1.00 | 0.99/1.01 | 0.857 | ||
| Constant | 13.74 | 0.09/1989.63 | 0.302 | ||
| Bladder | 0.0836 | 0.0905 | |||
| Balouch | 0.56 | 0.16/2.04 | 0.381 | ||
| Arab | 0.98 | 0.51/1.89 | 0.951 | ||
| Kurdish | 0.67 | 0.39/1.15 | 0.144 | ||
| Lor | 0.64 | 0.28/1.49 | 0.302 | ||
| Azeri | 0.72 | 0.46/1.11 | 0.140 | ||
| HDI | 1.00 | 0.99/1.01 | 0.697 | ||
| Constant | 3.04 | 0.01/1124.23 | 0.713 | ||
| Thyroid | 0.1704 | 0.0002 | |||
| Balouch | 1.30 | 0.31/5.45 | 0.717 | ||
| Arab | 0.52 | 0.17/1.60 | 0.256 | ||
| Kurdish | 0.67 | 0.36/1.25 | 0.206 | ||
| Lor | 1.02 | 0.66/1.57 | 0.942 | ||
| Azeri | 0.79 | 0.47/1.32 | 0.371 | ||
| HDI | 1.01 | 1.00/1.02 | 0.025 | ||
| Constant | 0.00 | 0.00/3.76 | 0.116 | ||
| Leukemia | 0.0616 | 0.2637 | |||
| Balouch | 0.76 | 0.19/3.05 | 0.701 | ||
| Arab | 0.93 | 0.53/1.65 | 0.807 | ||
| Kurdish | 1.04 | 0.61/1.76 | 0.891 | ||
| Lor | 0.85 | 0.53/1.36 | 0.488 | ||
| Azeri | 1.00 | 0.64/1.56 | 0.997 | ||
| HDI | 1.01 | 1.00/1.01 | 0.104 | ||
| Constant | 0.08 | 0.00/22.19 | 0.380 | ||
| Esophagus | 0.0793 | 0.4382 | |||
| Balouch | 0.51 | 0.10/2.70 | 0.429 | ||
| Kurdish | 1.35 | 0.66/2.77 | 0.415 | ||
| Lor | 0.98 | 0.49/1.96 | 0.963 | ||
| Azeri | 1.23 | 0.69/2.21 | 0.481 | ||
| HDI | 1.00 | 0.98/1.01 | 0.672 | ||
| Constant | 61.03 | 0.00/2 × 106 | 0.438 | ||
| Ovary | 0.0378 | 0.8843 | |||
| Balouch | 3.84 | 0.16/90.38 | 0.404 | ||
| Kurdish | 1.73 | 0.32/9.46 | 0.527 | ||
| Lor | 1.10 | 0.33/3.67 | 0.883 | ||
| Azeri | 1.52 | 0.43/5.29 | 0.515 | ||
| HDI | 1.01 | 0.99/1.03 | 0.299 | ||
| Constant | 0.00 | 0.00/28842.37 | 0.397 | ||
| Uterine | 0.0422 | 0.5613 | |||
| Arab | 0.89 | 0.47/1.67 | 0.718 | ||
| Kurdish | 1.04 | 0.49/2.20 | 0.917 | ||
| Lor | 0.67 | 0.27/1.64 | 0.377 | ||
| Azeri | 0.78 | 0.42/1.44 | 0.431 | ||
| HDI | 1.00 | 1.00/1.01 | 0.316 | ||
| Constant | 0.26 | 0.00/174.26 | 0.686 | ||
| Brain | 0.0208 | 0.9133 | |||
| Balouch | 0.47 | 0.12/1.91 | 0.293 | ||
| Arab | 0.86 | 0.37/2.01 | 0.722 | ||
| Kurdish | 0.89 | 0.51/1.53 | 0.662 | ||
| Lor | 0.83 | 0.44/1.56 | 0.557 | ||
| Azeri | 0.86 | 0.53/1.40 | 0.536 | ||
| HDI | 1.00 | 0.99/1.01 | 0.775 | ||
| Constant | 16.79 | 0.03/9953.26 | 0.387 | ||
| Non-hodgkin’s lymphoma | 0.1101 | 0.3953 | |||
| Arab | 1.33 | 0.54/3.27 | 0.539 | ||
| Lor | 1.33 | 0.81/0.65 | 2.72 | ||
| Azeri | 0.53 | 0.95/0.09 | 2.97 | ||
| HDI | 1.01 | 1.00/0.99 | 1.03 | ||
| Constant | 0.01 | 1.68/0.00 | 1.07 × 10⁶ | ||
| Other/unspecified | 0.0878 | 0.0789 | |||
| Balouch | 1.25 | 0.38/4.14 | 0.710 | ||
| Arab | 0.75 | 0.40/1.39 | 0.359 | ||
| Kurdish | 1.26 | 0.77/2.08 | 0.357 | ||
| Lor | 0.79 | 0.45/1.41 | 0.431 | ||
| Azeri | 0.43 | 0.19/0.98 | 0.045 | ||
| HDI | 1.00 | 1.00/1.01 | 0.276 | ||
| Constant | 0.32 | 0.00/121.25 | 0.704 | ||
Abbreviation: HDI, Human Development Index.
5. Discussion
Our main goal in this study was to investigate the association between the age-standardized incidence of common cancers based on the national report of 2017 and ethnicities in Iran. For this purpose, the data from the national cancer registration system were used in 2017, and various analyses were performed to investigate the incidence of cancers and to evaluate the effect of ethnic and socioeconomic factors as HDI on them.
Understanding the association between the incidence of cancers and ethnicity is a critical aspect of public health research, as it can provide valuable insights into potential differences and risk factors. Surprisingly, our analysis showed no significant association between cancer incidence and ethnicity at this level. This finding is somewhat inconsistent with studies conducted at the individual level, as they have reported associations (often weak) between some cancers and ethnicity.
For example, in the study by Taheri et al., the incidence of breast cancer in Turkmen women was significantly lower (3). Also, concerning stomach cancer, Azeri and Kurdish ethnic groups were more prone to stomach cancer than others (5). No studies on the Iranian population were found for other cancers.
Several factors may have caused the difference observed in our study from previous studies. One of the significant challenges in investigating the association between cancer and ethnicity is the inherent heterogeneity in ethnic groups. Ethnicity is a complex construct including various genetic, cultural, and environmental factors. Individuals within an ethnic group may have diverse genetic backgrounds, lifestyle habits, and exposure to different environmental factors that lead to variations in cancer risk. By analyzing data at the county level, potential associations between cancer and specific ethnicities may be inadvertently downplayed. Also, associations observed at the individual level may not necessarily hold at the county level due to differences in population composition, cultural practices, access to health care, and environmental exposures.
Furthermore, publication bias should be acknowledged as a potential factor contributing to the apparent contradiction between our findings and those of individual-level studies. Studies with positive or significant findings are more likely to be published, while studies with results that are not statistically significant may be unpublished or ignored. This publication bias could distort our existing understanding of the association between cancer and ethnicity, potentially overestimating the strength of the association between cancer and ethnicity.
In conclusion, our study analyzed data from all provinces and did not show a significant association between different cancers and ethnicities. We attribute this finding to the complexity of the association, ecological fallacy, methodological differences, potential confounding variables, and limitations of data aggregation at the provincial level. To gain a comprehensive understanding of the association between cancer and ethnicity, future research should focus on targeted studies at the individual level, taking into account other factors that may influence cancer risk in specific ethnic groups. Such research will be critical for developing targeted interventions and reducing cancer disparities among different ethnic populations.
Among the built models that fit well, the HDI significantly predicts the incidence rate only in the models related to breast, prostate, colorectal, and thyroid cancers. In all models, the HDI was identified as a risk factor. One of the reasons that provinces with a higher HDI have a higher incidence of cancer can be demographic differences and high life expectancy in regions with a higher HDI. With increasing age, the probability of various cancers increases, and considering that more developed regions have an older population, the increase in cancer rates also increases in them. Also, more developed areas have better access to diagnostic facilities, and due to better referral and reporting, more cases are registered and reported in these areas. One of the factors that influences the HDI is education. In areas with higher HDI, people have higher education, and with higher education comes better heightened awareness, leading to more proactive healthcare-seeking behaviors, disparate lifestyle choices, and occupational exposures.
Our findings have been replicated in previous studies. In the study of Beiranvand et al., who investigated the association between the standardized incidence of breast cancer and the HDI in Iran, a significant positive correlation (0.61) was observed between this index and the incidence of breast cancer (6). In the study of Khazaei et al., a positive correlation was observed between the incidence and mortality of melanoma skin cancers and the incidence of non-melanoma skin cancers worldwide (7). Also, in the study of Hassanipour-Azgomi et al., a positive correlation was observed between prostate cancer and the HDI for the standardized incidence rate (0.475) globally (8). For colorectal cancer, a positive correlation with the HDI with the incidence rate (0.712) and mortality rate (0.628) was observed at the global level (9). Ghonche et al.'s article, which was conducted in Asian countries for colorectal cancer, confirms these findings (10). Also, a significant positive correlation (0.497) was found between the standardized incidence of thyroid cancer and the global HDI (11).
In our research, for stomach cancer in the northwest of the country (including East Azarbaijan, West Azarbaijan, and Ardabil provinces), hotspots and Kerman province were identified as coldspots. This finding was consistent with the results of Pakzad et al., who also identified the provinces of East Azerbaijan, West Azerbaijan, Ardabil, Zanjan, and Gilan as hotspots in the northwest of the country (12). Contrary to our findings, no coldspot was found in the mentioned article. For colorectal cancer, at a significant level of 95%, central and northern provinces (Semnan, Tehran, Mazandaran, and Gilan) were identified as hotspots, and southeastern provinces (Kerman and Sistan and Baluchistan) were also identified as coldspots. In the study that Pakzad et al. carried out on the spatial epidemiology of colorectal cancer in both men and women, men in Tehran and Mazandaran provinces, as well as women in Mazandaran, Qazvin, Qom, Tehran, and Isfahan provinces, were identified as hotspots (13). The identified gastric and colorectal cancer hotspots in our study require further investigation in future studies.
The study found no significant link between various cancers and ethnicity, possibly due to the study's ecological nature and the lack of individual-level data. Human Development Index is a composite index of life expectancy, education (mean years of schooling completed and expected years of schooling upon entering the education system), and per capita income indicators. It makes sense that this index appeared as a notable variable, tied to better cancer detection and reporting in higher-index provinces in our research.
Limitations included data access at lower levels than provinces and missing cancer data for certain provinces. Given Iran's diverse population, understanding the cancer-ethnicity association can aid policy and healthcare planning. Finally, it is suggested that studies with the principal goal of investigating the association between ethnicity and the occurrence of various types of cancers need to be designed in the future so that these associations can be shown better through individual-level data. By detecting these ethnic variations, targeted interventions, culturally sensitive healthcare policies, and personalized approaches can be developed to mitigate the burden of cancer and improve health outcomes across diverse ethnic populations in Iran.
