1. Background
Increasing evidence has recently reported that malignancies have originated from a small population of cancer cells termed cancer stem cells (CSCs), indicating main properties including self-renewal and pluripotency. CSCs have widely known to responsible for initiating and sustaining tumor growth in all cancers including CRC (1). According to several studies, CRC tumorigenic cell population could mainly identified by the expression of specific cell surface biomarkers such as CD133 (Prominin-1) (2, 3), CD44 (4, 5), CD166 (ALCAM) (4, 6), CD24 (7), EpCAM (ESA) (4), CD29 (7), nuclear β catenin (7), Lgr5 (7), Oct-4, Sox-2, Nanog, Lin-28, Klf-4, C-myc (8-10).
It has shown that ALDH 1 induced proliferation and differentiation of stem cells through oxidizes of retinol to retinoic acid (11). High ALDH1 activity has used to define stem cell populations in large number of cancers including human multiple myeloma, acute myeloid leukemia (12), pancreatic cancer (13) and breast cancer (14). Therefore, ALDH1 activity might be useful as a common biomarker for malignant stem cell populations (15).
More recently, it has reported that ALDH-1 as a useful biomarker for colon cancer stem cells (5, 16). Recent studies have shown that implantation of only 25 ALDH1+ colon cancer cells in NOD/SCID mice lead to tumor xenografts. Further isolation of colon cancer cells using a second marker (CD44 or CD133) has only modestly increased enrichment based on tumor-initiating ability (11). Therefore, ALDH1 has seemed to be a valuable biomarker for identifying and isolating human colonic SC during CRC development.
Based on existing evidence that cell lines have represented the tumors from which they have originally isolated (17, 18) and regarding the cumbersome accessibility to primary cancer cells isolated from patients, in this study we have selected a colon adenocarcinoma cell line, HT-29, as a model. To date, association of CSC markers such as CD44, EPCAM and CD24 have evaluated in HT-29 cell line however correlation between ALDH activity, as a novel biomarker in colon CSCs and tumorigenicity in this cell line have not investigated.
2. Objectives
In this study we have investigated stemness properties and colon CSCs markers in spheroid and parent cells of HT-29. Additionally in vivo xenografts assay has performed to evaluate tumorigenic potential of tumor spheroid cells.
3. Materials and Methods
3.1. Cell Line and Culture Conditions
In this experimental study, the human colonic adenocarcinoma cell line HT-29 (wild type, no: 300215) has purchased from Iranian Biological Resource Center (IBRC). Cells have cultured in Dulbecco’s modified eagle medium: nutrient mixture F-12 (DMEM/F-12, 1:1, GIBCO, USA) supplemented with 10% fetal bovine serum (FBS, GIBCO, USA) and 1% penicillin/streptomycin (Invitrogen, USA) in a humidified incubator (Memert, Germany) at 37°C and 5% CO2. Cells have suspended using trypsinization (0.25% trypsin/EDTA (GIBCO, USA) for 3 - 5 minutes)
3.2. Colonosphere Formation
For colonosphere formation, single-cell suspensions have cultured at a density of 15,000 to 20,000 cells/mL in ultra-low attachment 6 well plates (Getbiofil, UK) in serum-free medium containing DMEM/F-12, supplemented with 20 ng/mL EGF (Sigma, USA) , 10 ng/mL FGF (Millipore, USA) and 1% B27 (50X, Invitrogen, USA) (19). To determine the differentiation potential of spheroid cells, tumor spheres have cultivated without EGF and FGF-2 in the presence of 10% serum.
3.3. Extreme Limiting Dilution Analysis
Extreme limiting dilution analysis (ELDA) has carried out to evaluate self-renewal capacity as previously explained by Hu and Smyth (20). Briefly, single cell suspension has obtained from parent and spheroid cells have plated at concentration of 1000, 100, 10 cells and 1 cell per well in 0.2 ml of CSC medium in 96-well ultra-low attachment (Getbiofil, UK) and cultured for 7 days in a humidified incubator at 37°C and 5% CO2. The number of wells containing of colonospheres has counted after 7 days. The frequency of sphere forming cells in a particular cell type has determined using ELDA web tool at http://bioinf.wehi.edu.au/software/elda.
3.4. Evaluation of Surface Markers by Flow Cytometry
Single cell suspension from colonospheres and parent cells has stained according to standard protocol (19). Briefly, cells have detached by trypsin and re-suspended in PBS containing 1% BSA for 10 minutes on ice. Subsequently cells have washed and stained with anti-human/mouse CD44-APC (eBioscience, USA) and anti-human EPCAM-PE (Abcam, UK) for 20 minutes on ice. The cells have stained with rat IgG 2b isotype control APC (eBioscience, USA ) and mouse IgG 1 isotype control PE (Abcam, UK) have served as gating control. Flow-cytometry analysis was performed using FACS CantoII (BD, USA).
3.5. Measurement of Aldehyde Dehydrogenase (ALDH) Activity
Identification of ALDH+ cells have performed using the ALDEFLUOR kit (StemCell Technologies, Canada). To perform the assay, an aliquot of the activated substrate has added to the colonospheres and parent cells suspended in ALDEFLUOR Assay Buffer. An aliquot of this cell mixture has immediately transferred to a tube containing DEAB for the control. These mixtures have incubated for 30 - 60 minutes to allow conversion of the substrate to the fluorescent product. ALDH + cells have identified by comparing the fluorescence of test samples against background fluorescence from identical samples that have treated with the ALDH inhibitor diethylamino benzaldehyde (DEAB) by flow cytometry.
3.6. Real-Time PCR
Total RNA has extracted from the parent and colonosphere-derived cells using high pure RNA isolation kit (Roche, USA) according to the manufacturer’s instructions. cDNA has synthesized by Sensiscript ® Reverse Transcription Kit (QIAGEN, USA) from total RNA and stored at -20°C until use. Quantitative reverse transcriptase PCR has performed to quantify the expression of stemness genes including c-myc, Klf-4, Nanog, Oct-4, Sox-2 using LightCycler FastStart ® DNA Master PLUS SYBR GreenI (Roche, USA) according to the manufacturer’s protocol on Roche light cycler version 3.5 (Roche, USA) . As an internal control for the normalization of these genes, Hypoxanthine-guanine phosphor ribosyl transferase (HGPRT) have used. PCR amplification has conducted with the following conditions: 1 cycle pre-incubation at 95°C for 10 minutes, followed by 40 cycles: denaturation for 10 seconds at 95°C, annealing for 10 seconds at 60°C or 61ºC, and extension for 10 seconds at 72°C. The primer sequences and specifications have summarized in (Table 1). The relative amount of each mRNA has normalized to HGPRT. The fold-change from colonospheres relative to the control (parent) has calculated using 2-ΔΔCt method. Each sample has assayed in triplicate.
| Gene Name | Primer Sequences | Annealing Temperature | Product Length |
|---|---|---|---|
| F: 5’-AGCGACTCTGAGGAGGAAC-3’ | 60ºC | 184 bp | |
| R: 5’-CTGCGTAGTTGTGCTGATG-3’ | |||
| F:5’-GGACTGAGAGAAAGAAGAGGAG-3’ | 61ºC | 197 bp | |
| R: 5’-GAAAATCAGGCGAAGAATAAT-3’ | |||
| F: 5’-CGCCGTATGAGTTCTGTG-3’ | 61ºC | 284 bp | |
| R: 5’-GGTGATCCTCTTCTGCTTC-3’ | |||
| F: 5’-GCTAAGGACAACATT GATAGAAG-3’ | 60ºC | 127 bp | |
| R: 5’-CTTCATCACCAATTCGTACTTG-3’ | |||
| F: 5’-CCCAATTACCCATCCTTCC-3’ | 60ºC | 303 bp | |
| R: 5’-GTGCCTGGTCAGTTCATC-3’ | |||
| F: 5’-CCTGGCGTCGTGATTATGG-3’ | 60ºC | 125 bp | |
| R: 5’-TCAGTCCTGTCCATAATTAGTCC-3’ |
The Primer Sequences and PCR Conditions
3.7. In Vivo Tumorigenicity
Tumorigenicity has determined by subcutaneous injection of single-cell suspensions from colonosphere and parent cells in 6 to 8 week-old female C57BL/6 nude mice. Before injection, cells have prepared at 1:1 ratio of PBS: collagen (sigma, USA) in a total volume of 100 µL. 1 ×10³, 2.5 × 10³ and 5 ×10³ cells of colonospheres and 5 ×10⁵ and 1 × 10⁶ of parent cells have injected in nude mice There were 3 mice in each group. Mice have purchased from animal laboratory of Imam Khomeini Hospital and maintained under standard conditions according to the guidelines of the animal care committee of cancer institute. Animal studies have approved by the animal ethics committee from Tarbiat Modares university. When tumor size has reached ~1 cm3, usually 7 - 9 weeks after injection, mice have killed and tumors samples have obtained for pathology analysis and in vitro culture. Tumor volume has calculated by the following formula:
3.8. Statistical Analysis
Data have presented as means ± standard error of the mean (SEM). Statistical analysis has performed using GraphPad Prism 3.0 (GraphPad Software Inc, USA). The unpaired t-test has used to analyze the median value of expression between the groups. Statistical significance has determined at P < 0.05. All tests have performed in triplicate.
4. Results
4.1. Generation and Characterization of Colonospheres
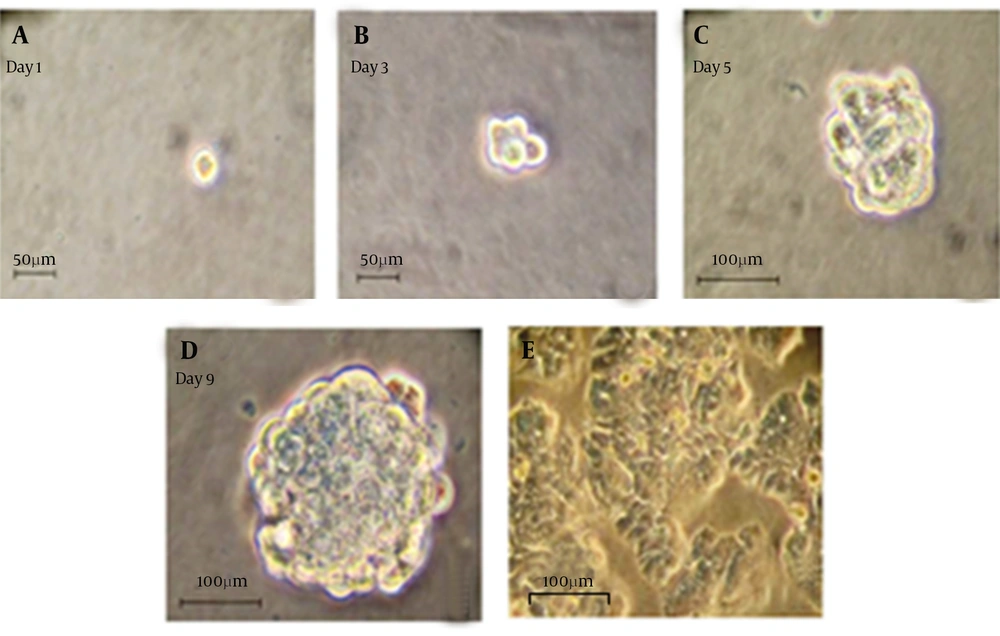
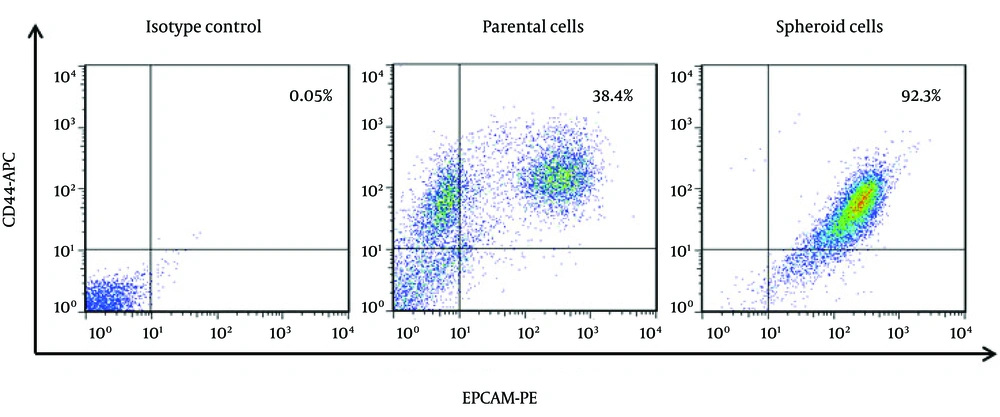
In this study, we have found that human HT-29 colonic adenocarcinoma cells could form spheroid colonies in a serum-free medium containing. To investigate the capability of colon spheres differentiation, these cells have cultivated in 10% FBS medium rather than EGF and FGF-2. In present serum, spherical undifferentiated cells have attached to the plate, and differentiated into adherent cells with epithelial cell morphology (Figure 1). In serum free condition, the expression levels of EpCAM and CD44 were significantly higher in spheroid than parent cells (P < 0.001) (Figure 2). The results have demonstrated that 92.3 ± 3.6% of these tumor spheroid cells were CD44+/EpCAM+, while parent cells only have expressed 38.4 ± 1.6% of CD44+/EpCAM+ markers.
(A-D): Representative photographs have been showing colon cancer cells expanded in vitro as undifferentiated spheres in serum-free medium containing EGF and FGF-2. Pictures have shown a typical colon sphere observed by the inverted phase contrast microscope. (e): Microscopically analysis of colon cancer spheres have cultivated in differentiation conditions (growth factors removal and addition of 10% FBS) for 7 days (200 ×).
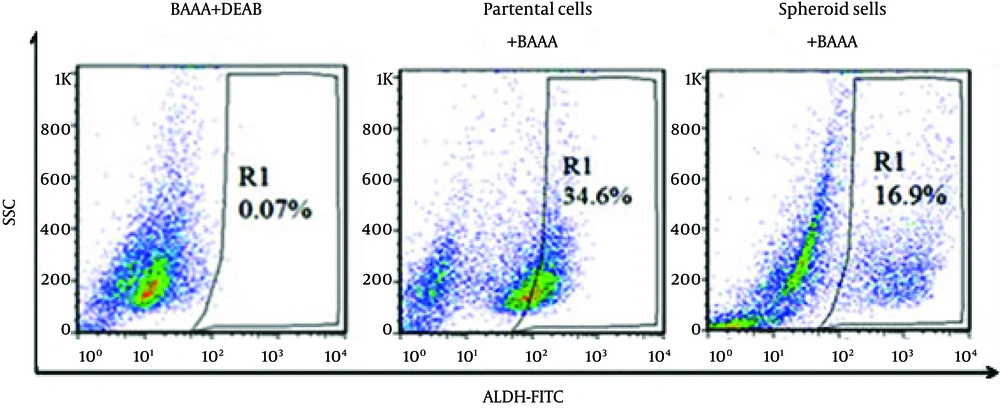
We have measured ALDH1 activity in colonospheres and parent cells-derived colonic HT-29 cell line. Interestingly, we have found that HT29 cells have exhibited substantially high levels of ALDH activity in the parent fractions in compared with the spheroid fractions. ALDH activity was 16.9 ± 1.2 in spheroid cells in comparison with 34.6 ± 2.3 in parental cells (P < 0.05) (Figure 3).
Representative Flow Cytometry Plots for the Analysis of ALDH Enzymatic Activity in Spheroid and Parental Cells in the Presence of ALDH Substrate (BAAA) (Left and Middle Plots, Respectively) and in the Parental Cells in the Presence of ALDH Enzyme Inhibitor Diethylaminobenzaldehyde (DEAB) (Right Plot)
We have evaluated the frequency of sphere-forming cells by doing an extreme limiting dilution analysis (ELDA) for spheroid and parent-derived HT-29 cells. The results have indicated that the frequency of spheroid formation in cell line -derived colonospheres were 6.4 fold higher than -derived the parent cells (P < 0.005) (Table 2). The findings have suggested that colonospheres have formed by the colon cancer cell have enriched population of CSCs.
| Number of Cells/Well | Number of Wells Plated | Number of Wells Showing Colonospheres | |
|---|---|---|---|
| 24 | 24 | 24 | |
| 24 | 24 | 22 | |
| 24 | 19 | 8 | |
| 24 | 9 | 2 | |
| 1.5 (1.3 - 1.7) | 1.32 (1.20 – 1.51) | ||
Extreme Limiting Dilution Analysis of Colonospheres Forming Frequency, by Parent and Colonospheres-Derived Cells of HT-29a
4.2. Stem-Like Features of Colonospheres In Vitro
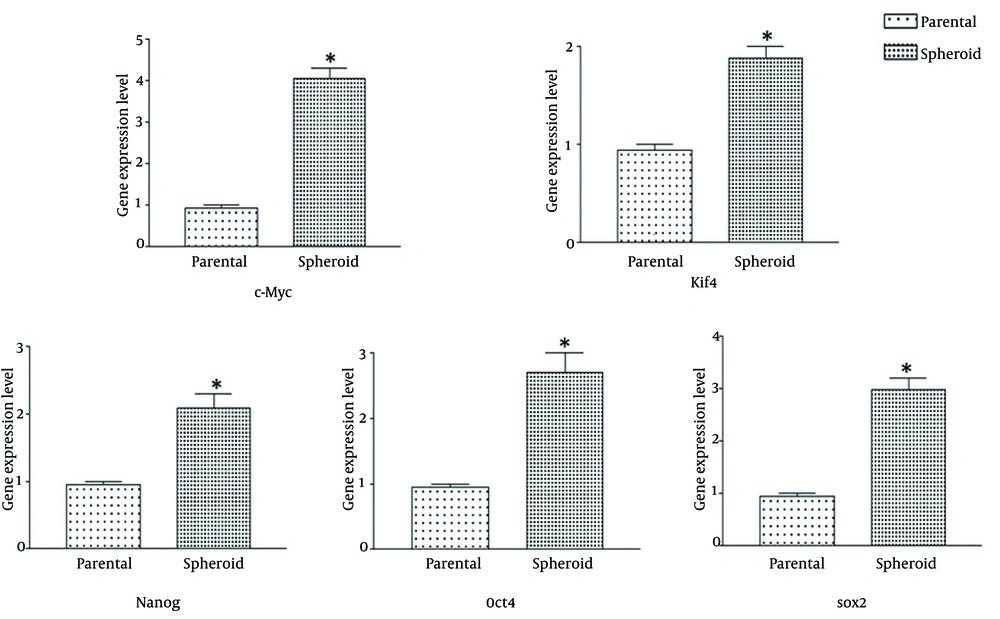
To study the molecular features of colon CSCs, the expression of genes has involved in stem cell related pathways has investigated by real-time PCR in colonospere and parental cells, as shown in (Figure 4).
In comparison with the parental cells, expression level of ‘‘stemness’’ genes, like Sox2, Oct4, Nanog, C-myc, and Klf4 have significantly increased in colonosphere cells (P < 0.05).
4.3. Colonospheres Can Generate Tumors Upon Xenotransplantation
To determine tumorigenicity in colonosphere and parental cells in vivo, nude mice have subcutaneously injected with either colonosphere or parent cells. The results have shown the ability of spheroid cells in tumor formation was significantly higher in comparison with parental cells (Figure 5A). The data have shown that as few as 2500 spheroid cells were sufficient to induce tumor growth, whereas 1 × 10⁶ of parental cells capable to form tumor (Table 3). Histological analyses have shown that tumors-induced of both xenografts have derived from spheroid and parental cells had the same character of original tumor (Figure 5B).
| Cell Type/Cell Number Injected | Tumor Incidence | Engraftment-Derived Spheres |
|---|---|---|
| 1 × 10³ | 0/3 | - |
| 2.5 × 10³ | 3/3 | Yes |
| 5 × 10³ | 3/3 | Yes |
| 5 × 10⁵ | 0/3 | - |
| 1 × 10⁶ | 3/3 | Yes |
Tumorigenicity of Colonospheres and Parental Cells From HT-29 Cell Lines in Nude Mice
(A) The photograph of a representative mouse has taken at 7 weeks after cell transplantation (B) Haematoxylin-eosin analysis of mouse xenografts have generated by spheres expanded in culture (400 ×). (C) Haematoxylin-eosin analysis of mouse xenografts have generated by parental cells expanded in culture (400 ×)
5. Discussion
Previous studies have demonstrated that in addition to primary tumors, established cancer cell lines might be contained a subpopulation of cells possessing CSCs properties (21, 22). In this research, we have identified and characterized CSCs in the colorectal cancer-derived cell line HT-29 through investigation of sphere formation and surface biomarkers. Studies have shown that under serum-free defined media, CSCs had ability to form floating spheroids (19). In consistent with previous observation, we have shown that in serum-free conditions HT-29 cell line could form spheroid colonies (colonospheres) and following exposure to 10% FBS differentiate into large and adherent cells , maintaining self-renewal capacity and differentiation potential.
Moreover, ELDA has resulted for survey functional CSCs in colonospheres has revealed that colonospheres has marked increasing frequency of cells with sphere-forming ability. Thus, it has suggested under extreme limited dilution and in serum-free conditions, spheroids could only formed from stem-like cells. Consequently, the formation of colonospheres with a very small number of HT-29 cell line has demonstrated enrichment CSCs in colonospheres (2, 7, 20).
Furthermore, we have shown that colonospheres have expressed the specifics markers including Sox2, Oct4, Nanog, C-myc and KLF4 which were important for stemness properties. In several studies have reported correlations between multi potent genes expression and stemness maintenance of human CSCs (8-10). Saigusa et al. has reported meaningful correlations among the expression level of OCT4, SOX2 and CD133 with distant recurrence, and poor prognosis of rectal cancer patients with preoperative chemo radiotherapy (9). Consistent with these results, Saiki et al. has also shown that lin-28 and SOX2 expression has highly associated with lymph node metastasis and Dukes stage (10).
Currently, several molecules have identified as markers for colon cancer stem cells such as CD133, CD44, CD166 and CD24 (2-6). Previous reports via flow cytometry analysis in tumor spheres and parent cells have shown associating between CD44 and EPCAM expression with colon CSCs. The results of present study has indicated significant expression of CD44 and EPCAM in colonospheres in comparison with parent cells so that colonospheres-derived cells were over 96% CD44+and EPCAM+. In line with these results, Kanwar et al. has shown that spheroid cells derived from HT-29 and HCT116 have higher expression of CD44 and EPCAM in comparison with parental cells (19). Thus these data strongly has indicated that colonospheres have generated under present conditions have mainly composed of CSCs.
More recently, ALDH1 has proposed as a promising new biomarker in normal and malignant human colonic SCs. Chu et al. has revealed that in vivo implantation of CD44hi ALDH+ colon tumor cells were significantly more tumorigenic than matched CD44hi ALDH- cells. Therefore, as few as 100 CD44hi ALDH+ cells could lead to tumor formation (5). In addition, Huang et al. (16) has shown that implantation of only 25 ALDH+ cancer cells have tumorigenicity in NOD/SCID mice. However, further isolation of cancer cells ALDH+ using CD44 or CD133 only modestly has resulted in tumor-initiating ability (11). Thus, we have suggested that ALDH1 activity could be a valuable biomarker for identifying CSC in colonosphere population. Controversy, our findings have revealed that colonospheres exhibit have decreased levels of ALDH1 activity in comparison with the corresponding parental cells. Nevertheless, low ALDH1 activity in colonospheres had no effect on their tumorigenic potential, so this population even has shown higher ability for initiating tumor, in comparison with parental cell with high ALDH1 activity in in vivo situation. Our results have shown that administration of 2500 colonospheres could be sufficient to initiate tumor growth in nude mice while 1 × 10⁶ of parental cells has needed to form tumor. It would be important to point out that results of primary tumor could not generalized to colonic cell line like HT-29. The present data has indicated that there was no correlation between ALDH activity and the tumorigenic capacity, and it could not be as a universal biomarker for identifying CSCs.
Expression of ALDH1 could be different in population of tumor cell lines indicating CSCs properties. For instance, recently Yuval Shaked et al. has demonstrated that spheroid of U-87MG, MCF7, and PANC1cell lines rather than their types of parental have increased levels of ALDH1 activity. It has also shown that ALDH activity in A549 and HT-29 cells was substantially high levels in the parental in comparison with the spheroid. However, higher expression of p21 and p53 has found in spheroid of HT-29, showing more angiogenic effects and resistant to chemotherapy than parent cells (23). A similar result has also reported by Yu et al. who have shown that high level expression of ALDH or the present of CD44 in CSCs of prostate cancer cell lines could not be relevant with tumorigenicity capacity, so that ALDHlo CD44– cells and ALDHhiCD44+cells has exhibited the same proliferative, clonogenic and metastatic capacity, indicating their potential importance for further exploration (24).
Moreover, ALDH- melanoma cells could be equally resistant to treatment and tumorigenic with ALDH+ which indicates the functional ‘‘marker’’ ALDH has not played an exclusive role in tumor initiation and/or in low response to therapy (25).
For the first time, our current experimental data have shown that ALDH activity has not appeared to specifically identify CSCs in HT-29 cell line. It could suggested that isolation of CSC–derived HT-29 cell line base on CD44 and EPCAM markers might be useful for characterization and further investigation of this cell line.


