1. Introduction
Since 1990, mortality and morbidity of cancer for both sexes declined mainly due to prevention and screening programs such as smoking control activity and mammography; however, breast cancer still remains a serious concern (1, 2). Breast cancer is the most common cancer of women in both developed and less developed countries. According to world health organization estimates, more than 508,000 people died in 2011 due to breast cancer and 58 % of deaths occur in less developed countries (3). Annually almost 90,000 new cases of cancer occur in the Iranian population (4) and cancer is the third most common cause of death after cardiovascular diseases and accidents (5, 6).
Place has been known as a fundamental component of epidemiological sciences (7), and studies have shown that there is a strong link between the health status and location where people are living (8). Although the spatial epidemiology of cancer using GIS in various aspect such as the clustering detection in developed countries is well understood, in developing countries such as Iran, despite limited available studies, it has not been studied sufficiently.
The aim of this study was to investigate spatial autocorrelation of breast cancer among Iranian provinces to answer whether the neighboring provinces tend to have similar incidence rates and how cluster on the basis of current spatial autocorrelation has been formed. Estimating variance of the incidence values using predictor maps was approached as well.
2. Methods
Age-standardized incidence rate (ASR) of breast cancer data from 2004 to 2009 were extracted from annual report of ministry of health and medical education (MOHME) (9). Demographic data for cases of breast cancer including age, gender, location and type of tumor for 2010 year was obtained from MOHME as well. Using population data of country provinces reported by the statistical center of Iran and WHO standard population, we calculated age-standardized incidence rates for 2010. Accordingly, the geographical distribution pattern and clustering of breast cancer were determined based on location. Moran’s index was used to measure the spatial autocorrelation (10). This index ranges between -1 and +1 and the farther away it is from zero, the stronger (positive or negative) the autocorrelation. A positive autocorrelation means that values in one area are similar to those in neighboring areas; whereas a negative autocorrelation means that if one area has a high incidence rate, the neighborhood areas have low incidence rates. Moreover, to deal with different spatial associations between the multiple blocks, local Moran’s index, known as the local index of spatial autocorrelation (LISA), was used. This index assigned specific values to each block and mapped them into four classes: high-high or hot spots (areas with a high rate surrounded by other areas with a high rate), low-low or cold spots (areas with a low rate surrounded by other areas with a low rate), low-high, high-low or outlier (areas with a low rate surrounded by areas with a high rate and vice versa). Getis-Ord index was calculated to detect hot and cold spots. This index mapped the blocks in hot and cold spots with different method and could not determine the outlier. Ordinary kriging method was used in order to estimate the variation in distribution of incidence rates from 2004 to 2010, and to show the probable increase or decrease in this distribution. Finally, the model estimates were used to create maps.
3. Results
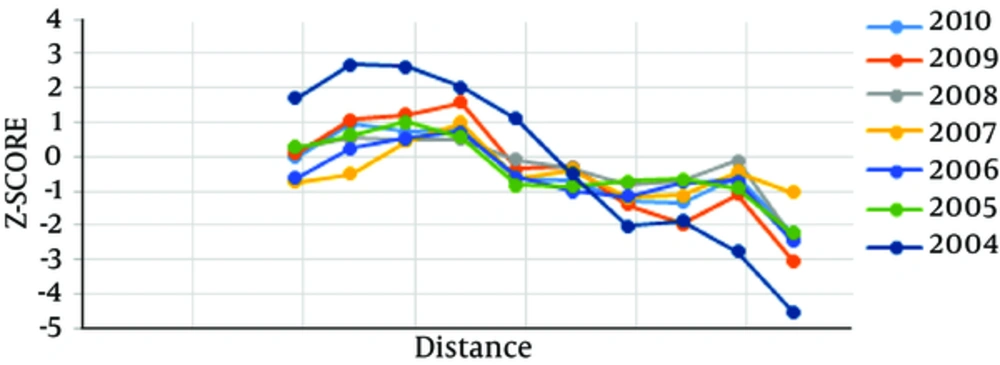
In summary, during the study period from 2004 to 2005, Isfahan and Yazd provinces had the highest ASR of breast cancer among the country’s provinces, and Tehran from 2006 to 2010 had the highest ASR. Sistan -va- Baluchestan, and Kohgiluyeh -va- boyerahmad had the lowest ASR rates over the study years (for more information refer to the annual reports of the ministry of health and medical education) (9). This study explored the spatial patterns and clusters of breast cancer in Iran, using global and local methods. Provinces were considered as the unit of analysis. Incremental spatial autocorrelation was used to determine the distance band (11). This method measures the spatial autocorrelation in increment distance and creates a graph of distance according to Moran’s index Z-score. Figure 1 shows the Moran’s index Z-score from 2004 to 2010 in each year and the first peak of the graph selected as distance band indicates distances at which clustering is most pronounced. Results of Moran’s global index for the selected distance band are shown in Table 1.
| Year | Moran’s I | Z-Score | P Value | Type of Spatial Pattern |
|---|---|---|---|---|
| 2004 | 0.092 | 2.408 | 0.016 | Clustered |
| 2005 | 0.010 | 1.107 | 0.268 | Random |
| 2006 | -0.013 | 0.606 | 0.544 | Random |
| 2007 | -0.020 | 0.388 | 0.697 | Random |
| 2008 | -0.016 | 0.312 | 0.754 | Random |
| 2009 | 0.010 | 1.354 | 0.175 | Random |
| 2010 | 0.029 | 1.112 | 0.266 | Random |
Analyzing Pattern of Age-Standardized Incidence Rates for Each Year of Study Period
Moran’s index for 2004 was positive and significant, which means the pattern of cancer incidence was clustered and provinces or blocks had values similar to those of their neighbors, but for other years it was not significant (Table 1).
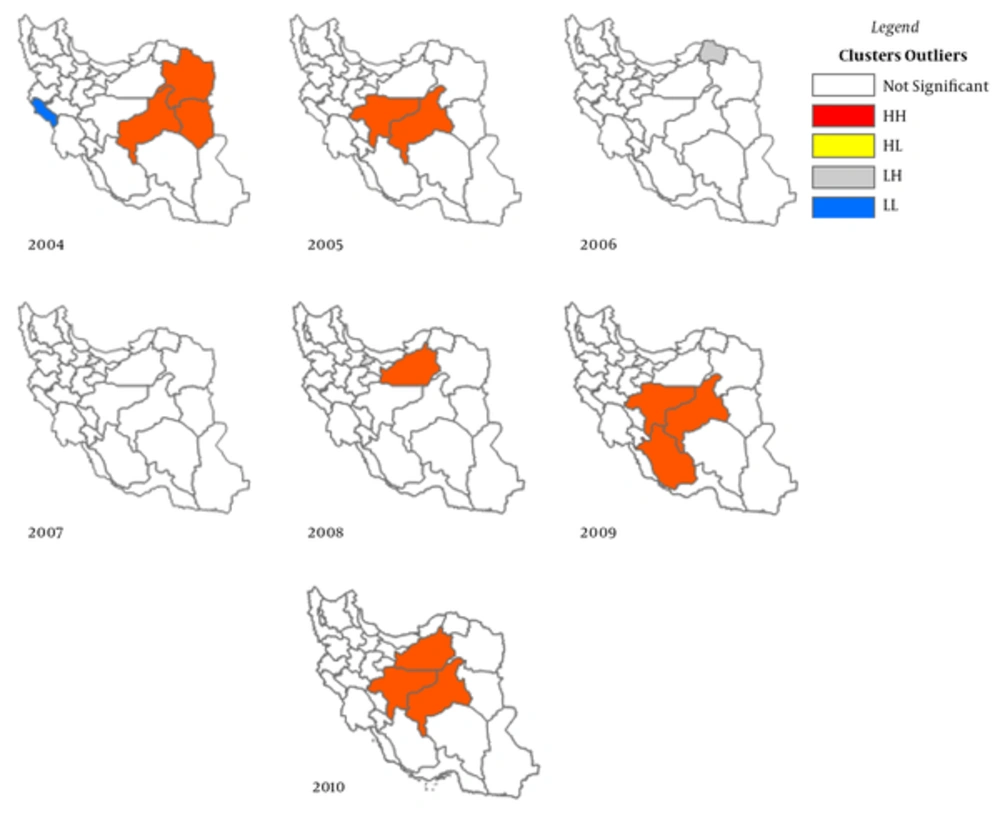
Figure 2 shows the results of local Moran index (LISA), hot and cold spot have had different patterns during the study, but often were located in eastern , north eastern and central areas of the country (approximately areas in UTM Zone 32N to UTM Zone 39N); for the other areas significant results were not found.
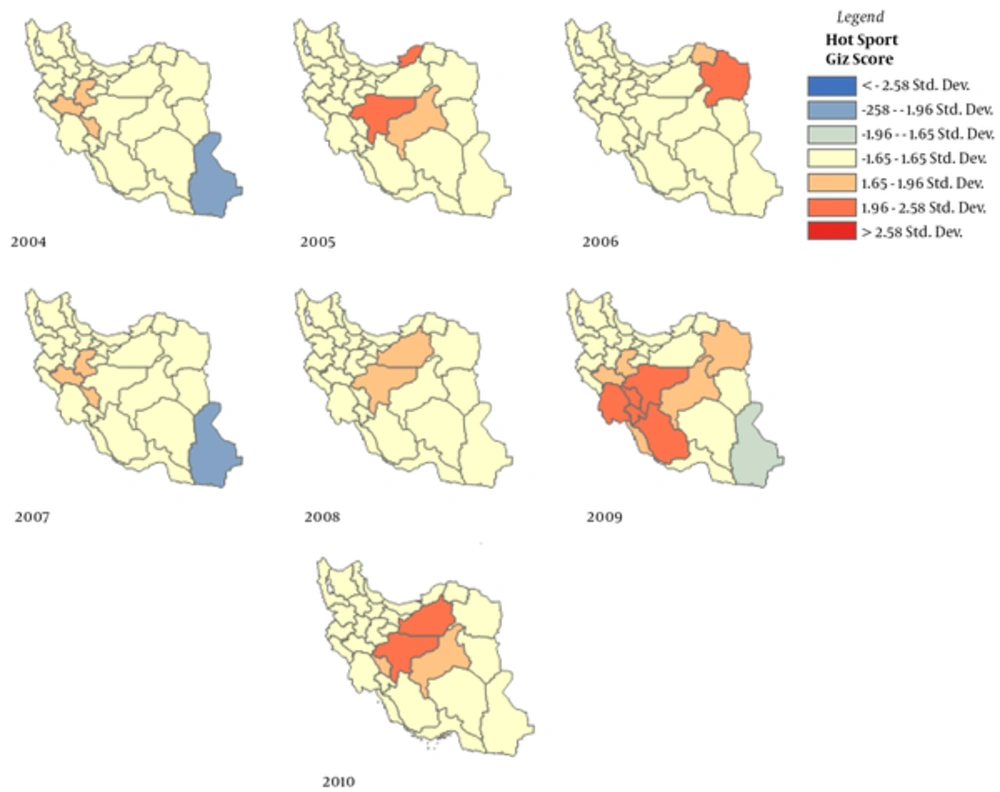
LISA index for two consecutive years 2006 and 2007 was not significant. Figure 3 shows the results of Getis-Ord index. However, the findings of this index are almost similar to those of the LISA, but in some years they included areas of southwest and northeast of the country (Figures 2 and 3).
Finally, ordinary kriging method results are shown in Figure 4. In prediction map incidence rates range from 0.06 to 101.15 for 2004 and from 20.85 to 329.68 for 2010, respectively. The incidence rates have increased, especially in the areas determined by clustering map indices. Figure 4 in comparison to Figure 2 revealed the approximate accuracy of the method in the forecast. Increase in incidence rates could indicate possible changes in risk factors of breast cancer from 2004 to 2010.
4. Discussion
In this study, the local and global indices were applied to verify the existence of spatial clusters in Iran. The results showed that there is relatively large geographical difference in significant clusters of the incidence rates between the areas of country. Local indices results show the existence of significant clusters in the eastern and north eastern areas of the country, which are likely to imply the presence of common predisposing factors is in these areas. Although in some cases have good performance but is not a good null hypothesis for very systematic and complex system such as environment and the health sciences (4, 12). However, up to this time except Goli et al study which determined spatial distribution of breast cancer with desired method in Fars province (13), there is not a national study that have explored significant clusters, or breast cancer pattern using geographical information system (GIS).
The limitations of this study were lack of access to cancer data in the years before and after the study period, failing to calculate the age-standardized rates (ASR) to the cities of the country due to lack of access to sufficient information to explain the more accurate breast cancer patterns and clusters. The null hypothesis used in determining methods of breast cancer clusters and patterns is based on complete spatial randomness. Although in some cases the performance is good, sciences is not a good null hypothesis for very systematic and complex system such as environment and health (14). A suitable solution is using Poisson kriging (15), factorial kriging or simulation methods (14) which are able to eliminate the regional background and population differences.
Results of this study can have some potential application including be a part of annual report of MOHME, help involved agencies to adopt proper control and prevention decisions about breast cancer and in conjunction with other methods such as spatial regression (16, 17) be a framework to explore other influencing factors on breast cancer incidence.
In conclusion, our findings revealed large differences between the geographic distribution of the breast cancer clusters in the East and North East regions of the country in comparison to other areas. Accordingly, this geographical diversity helps to better understand the determinants of breast cancer in Iran.


