


1. Background
Ovarian cancer is the 7th cause of cancer mortality and the 7th most common cancer in women throughout the world (1). A study on Iranian women indicated the increasing trends and the incidence of ovarian cancer mortality from 1999 to 2004 (2). The general mortality rate of ovarian cancer dramatically increased during these years from 0.01 to 0.75 per 100,000 and predicted rate for 2007, 2008, 2012, and 2013 indicated that it is going to be leveled off at the rate of 1.44 per 100,000 (2). The symptoms of ovarian cancer, which are often vague and the same as those found in other benign conditions, can be due to the adnexal masses (3, 4). Thus, the early detection, centralization, and specialization of ovarian cancer surgery are the most important factors associated with improving prognosis (5).
Although the ultrasound is applied to evaluate the women in terms of ovarian cancer, its specificity is low to determine whether a mass is malignant or benign. The specificity is improved, using Doppler ultrasound and a morphology index, but performance differs among various operators (6, 7). Currently, some markers are used to differentiate between patients with low and high risk of ovarian malignancies; these markers include human epididymis protein 4 (HE4), risk of malignancy index (RMI), cancer antigen125 (CA125), and risk of ovarian malignancy algorithm (ROMA) (8). Although CA125 is used as a tumor marker to diagnose the ovarian cancer in women suffering from a pelvic mass (4), its predictive power is inadequate. It is increased in about 80% of women with epithelial ovarian cancer, but only in 50% of women with early-stage disease (9). However, up to 20% of patients with ovarian cancer do not express CA125 (10). On the other hand, the specificity of CA125 is confined (11), and it can be enhanced in various pathological and physiological conditions as endometriosis, during menses, fibroid, pregnancy, peritoneum inflammatory diseases, and pleura (11-13).
Hence, in 1990, Jacobs et al. developed an RMI based on the serum level of CA125, menopausal status, and ultrasound parameters that categorizes patients into high- and low-risk groups (14). Several subsequent reports have validated the predicted levels of sensitivity and specificity (15, 16). However, the use of ultrasound imaging in the algorithm leads to variability in interpretation between users and centers (17). Recently, HE4 as a single marker has sensitivity and specificity values higher than CA125 (18). In 2009, another algorithm (ROMA), which can help differentiate benign pelvic masses from epithelial ovarian cancer, was proposed. Several studies have shown that ROMA (19) with high sensitivity and specificity than other markers can better predict a malignant ovarian mass (19, 20). The diagnostic accuracy of ROMA and HE4 is still controversial; Li et al. have demonstrated that HE4 is not better than CA125 to predict the ovarian cancer (8).
Predictive value of CA125 (PPV = 84%, NPV = 99%) and RMI (cut off = 200, PPV = 53%, NPV = 99%) in patients with a pelvic mass has been suggested in our previous studies (21). However, to our best knowledge, there is no data evaluating the use of HE4 and ROMA in an Iranian population with ovarian masses.
2. Objectives
The aim of this study was to compare the CA125, HE4, ROMA, and RMI values of patients suffering from an ovarian mass undergoing surgery.
3. Methods
3.1. Design and Study Subjects
This cross sectional study was conducted on 136 patients at the Ayatollah Rouhani Hospital of Babol University of Medical Sciences from October 2013 to September 2015 in Iran. All patients with diagnosis of abdominal mass were referred to the clinic of Ayatollah Rouhani Hospital. After obtaining consent, they were entered into the study. Patients with past or concomitant histories of malignancy were excluded from the study (n = 36 patients). After obtaining the consent, the sonography ultrasound was performed again as well as the paraclinical and tumor markers were measured for all patients in a single laboratory. Among them, 100 patients with the diagnosis of ovarian mass were eligible and enrolled. Ovarian masses in this study were classified according to the pathologic findings in two groups; benign tumors and high-risk tumors (low-malignant-potential and malignant). The study was approved by the Research Ethics Committee of Babol University of Medical Sciences (code: MUBABOL.REC.1393.20). An informed consent was obtained from all women.
3.2. Measurement of Tumor Markers
3.2.1. CA125 and HE4 Assays
Preoperative peripheral blood was collected to measure the serum CA125 and HE4. CA-125 was measured by ELISA (Enzyme-Linked-Immunosorbent-Assay) (Germany Roche kit in the same laboratory), and HE4 serum level was measured, using EIA.
3.2.2. RMI Calculations
RMI is calculated on the basis of criteria set by Jacobs, as follow: Ultrasound scans were scored as 1 point for each characteristic of below, intra-abdominal metastases, ascites, multilocular cyst, solid areas, and bilateral lesions (14).
3.2.3. ROMA calculations:
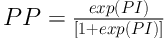
ROMA was calculated according to Moore et al. (18). Predictive index (PI) in women before and after menopause was calculated as follows:
In pre-menopausal women, (PI) = -12.0 + 2.38 × LN (HE4) + 0.0626 × LN (CA125)
In women after menopause, (PI) = -8.09 + 1.04 × LN (HE4) + 0.732 × LN (CA125)
The predicted probability (PP) was also calculated as follows:
3.3. Cut-Off Values
The optimum cut-off point of each of the above markers was calculated, using the receiver-operating characteristic (ROC) curve by Youden index that maximizes the sum of sensitivity and specificity or equivalently minimizes the sum of false positive and false negative errors.
3.4. Statistical Analysis
The data were analyzed, using SPSS 22 and STATA V.12. The specificity and sensitivity were calculated for RMI, CA125, ROMA, and HE4. The area under the ROC curve was identified as an indicator of diagnostic accuracy for each of the CA125, HE4, ROMA, and RMI markers with 95% confidence intervals (CIs). To determine the optimum cut-off point, the ROC curve for each marker (RMI, CA125, ROMA and HE4) was calculated, so that the data with the highest sensitivity and specificity were chosen as the cut-off point; therefore, the total false-positive and -negative error was minimal. The chi-square test was used for the association between categorical data and analysis of variance (ANOVA) model, performed for quantitative variables. For all of the statistical comparisons, P < 0.05 was statistically considered significant.
4. Results
The benign tumors included Para tubal cyst (n = 16), simple cyst (n = 23), endometrium (n = 6), fibrothecoma (n = 2), liomyolipoma (n = 2), leiomyoma (n = 1), serous cyst adenoma (n = 21), mucinous cyst adenoma (n = 8), and mature cystic teratoma (dermoid cyst) (n = 16). The high-risk tumors (low-malignant-potential and malignant) were composed of borderline papillary serous neoplasm (n = 2), well-defined adenocarcinoma (n = 1), papillary serous carcinoma (n = 1), well-differentiated endometriosis carcinoma (n = 2), endometriosis adenocarcinoma (n = 3), granolusa cell tumor (n = 1), serous carcinoma (n = 1), papillary serous cyst adenocarcinoma (n = 1), mucinous adenocarcinoma (n = 1), high grade infiltrating carcinoma (n = 1), carcino sarcoma (n = 1), steroid cell tumor (n = 1), and HCC (n = 1).
The median age of participants was 42.51 years. The mean and median age of patients and CA125, HE4, RMI, and ROMA serum levels were significantly different between malignant and benign tumors in the overall assessment (P < 0.001). The characteristics of the studied population, including menopausal status, age, RMI, CA125, ROMA, and HE4 values are illustrated in Table 1. In 100 patients with statistical analysis, 78 cases were pre-menopausal (78%) and 22 post-menopausal women (22%).
| Age | CA125, U/mL | HE4, Pm | RMI | ROMA, % | |
|---|---|---|---|---|---|
| Benign | |||||
| Total | |||||
| Mean ± SD | 40 ± 8.92 | 33.05 ± 31.02 | 45.69 ± 17.52 | 46.86 ± 77.11 | 8.41 ± 8.95 |
| Median (range) | 37 (31 - 73) | 23 (1.0 - 158.9) | 42.1 (1.0 - 102) | 23 (0.0 - 378) | 5.43 (1.51 - 53.17) |
| Pre-M | |||||
| Mean ± SD | 37.39 ± 5.86 | 32.86 ± 30.92 | 42.84 ± 14.62 | 38.16 ± 60.08 | 6.31 ± 4.71 |
| Median (range) | 36 (31 - 50) | 22.30 (1.1 - 158.9) | 41.6 (1.0 - 98.5) | 23 (0.0 - 378) | 4.95 (1.51 - 31.37) |
| Post-M | |||||
| Mean ± SD | 55.42 ± 8.43 | 34.16 ± 32.94 | 62.56 ± 23.78 | 98.37 ± 134.03 | 31.37 ± 20.84 |
| Median (range) | 56 (45 - 73) | 27.70 (1.7 - 1.1) | 63.80 (33 - 102) | 37.48 (0.0 - 378) | 1.68 - 53.17) |
| Malignant | |||||
| Total | |||||
| Mean ± SD | 54.76 ± 15.60 | 359.27 ± 578.76 | 259.90 ± 382.17 | 1595.12 ± 3431.36 | 51.51 ± 33.48 |
| Median (range) | 54 (32 - 58) | 108 (16 - 2067) | 147 (29 - 1636) | 217 (0.0 - 13860) | 22.66 (6.09 - 98.62) |
| Pre-M | |||||
| Mean ± SD | 40.29 ± 8.48 | 449.97 ± 738.11 | 162.58 ± 144.4 | 657.97 ± 896.68 | 43.38 ± 37.11 |
| Median (range) | 38 (32 - 51) | 108 (16 - 2075) | 98.50 (43.40 - 436.90) | 217 (16 - 2057) | 31.37 (6.09 - 95.01) |
| Post-M | |||||
| Mean ± SD | 64.90 ± 10.37 | 295.78 ± 470.54 | 328.2 ± 483.01 | 2251.14 ± 4385.73 | 57.20 ± 31.42 |
| Median (range) | 66 (52 - 85) | 132.50 (24 - 1540) | 148.50 (29 - 1636) | 238.50 (0.0 - 13860) | 51.34 (9.43 - 98.62) |
Abbreviations: Post-M, post-menopause; Pre-M, pre-menopause.
The mean and median age of the participants was significantly different between the pre- and post-menopausal women in benign and malignant conditions separately (P < 0.001). A significant difference between mean and median of HE4, RMI, and ROMA serum levels was observed between the pre- and post-menopausal women with benign mass (P < 0.01). Nevertheless, the mean and median CA125 had no significant difference between the pre- and post-menopausal females in malignant or benign conditions. In addition, the mean and median HE4, RMI, and ROMA serum levels in women with malignant mass were not significantly different between the pre- and post-menopausal women. Although all 4 tumor markers in pre-menopausal women had statistically significant differences between malignant and benign masses, only RMI and ROMA in post-menopausal women were significantly different between malignant and benign masses.
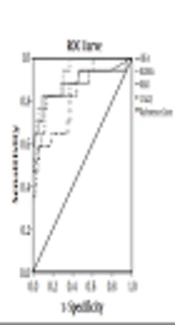
The ROC curves for RMI, CA125, ROMA, and HE4 were calculated to compare the accuracy of the 4 methods (Figure 1). Table 2 represents the sensitivity, specificity, PPV, NPV, and odds ratio established for CA125, HE4, RMI, and ROMA in both pre-and post-menopausal women at the optimal identified cut-off value for each method. The greatest AUC was related to ROMA values (0.92), as compared to the ROC values for the HE4 (0.88), RMI (0.85), and CA125 (0.83) in overall assessment. AUC for pre-menopausal women was 0.85 for CA125, 0.89 for HE4, 0.85 for RMI, and 0.91 for ROMA. For post-menopausal women, the AUC was 0.78 for CA125, 0.82 for HE4, 0.79 for RMI, and 0.85 for ROMA.
| Optimal Cut-off | |||||||
|---|---|---|---|---|---|---|---|
| ROC - AUC (SE), [95% CI] | Cut-off Value | Sen (%) | Spe (%) | PPV (95% CI) | NPV (95% CI) | Odds Ratio (95% CI) | |
| All patients | |||||||
| CA125 | 0.83 (0.054), [0.725 - 0.937] | 99.70 | 58 (35 - 82) | 94 (89 - 99) | 67 (43 - 91) | 92 (86 - 98) | 92 (86 - 98) |
| HE4 | 0.88 (0.059), [0.769 - 1] | 66.95 | 82 (64 - 100) | 90 (84 - 97) | 64 (44 - 84) | 96 (92 - 100) | 91 (85 - 98) |
| RMI | 0.85 (0.061), [0.738 - 0.973] | 72.48 | 82 (64 - 100) | 86 (78 - 93) | 54 (35 - 73) | 96 (91 - 100) | 96 (91 - 100) |
| ROMA | 0.92 (0.032), [0.866 - 0.991] | 28.13 | 76 (56 - 97) | 95 (91 - 100) | 76 (56 - 97) | 95 (91 - 100) | 64.18 (14.25 - 289.04) |
| Pre-M | |||||||
| CA125 | 0.85 (0.085), [0.685 - 1] | 99.70 | 71.4 (38 - 100) | 94.4 (89 - 100) | 56 (23 - 88) | 97 (93 - 100) | 41.88 (32.69 - 51.06) |
| HE4 | 0.89 (0.061), [0.779 - 1] | 66.95 | 71.4 (38 - 100) | 95.8 (91 - 100) | 63 (29 - 96) | 97 (93 - 100) | 56.67 (44.20 - 69.13) |
| RMI | 0.85 (0.079), [0.698 - 1] | 86.88 | 71.4 (38 - 100) | 90.1 (83 - 97) | 42 (14 - 70) | 97 (93 - 100) | 22.86 (17.90 - 27.82) |
| ROMA | 0.91 (0.047), [0.827 - 1] | 24.4 | 57.1 (20 - 94) | 98.6 (96 - 100) | 80 (45 - 100) | 96 (91 - 100) | 93.33 (7.83 - 1111.55) |
| Post-M | |||||||
| CA125 | 0.78 (0.099), [0.588 - 0.978] | 64.52 | 60 (30 - 90) | 83.3 (62 - 100) | 75 (45 - 100) | 71 (48 - 95) | 7.50 (4.58 - 10.42) |
| HE4 | 0.82 (0.104), [0.621 - 1] | 74.20 | 80 (55 - 100) | 66.7 (40 - 93) | 67 (40 - 93) | 80 (55 - 100) | 8 (4.87 - 11.13) |
| RMI | 0.79 (0.101), [0.595 - 0.989] | 79.25 | 80 (55 - 100) | 73 (46 - 99) | 73 (46 - 99) | 82 (59 - 100) | 12 (7.20 - 16.80) |
| ROMA | 0.85 (0.09), [0.674 - 1] | 27.7 | 90 (71 - 100) | 75 (51 - 100) | 75 (51 - 100) | 90 (71 - 1000) | 27 (2.34 - 311.17) |
Abbreviations: CI, confidence interval; Post-M, post-menopause; Pre-M, pre-menopause; ROC/AUC, area under the ROC (receiver operating characteristic) curve; SE, standard error; Sen, sensitivity; Spe, specificity.

ROC curves for CA125 and HE4, RMI, and ROMA algorithm: A, overall, B, pre-menopausal, and C, post-menopausal
The ROC curves were compared through a pairwise comparison method, and there were no differences between the 4 methods. The ROC-AUC of CA125 did not significantly differ from that of HE4, RMI, or ROMA for all malignant tumors compared with benign tumors in the pre- and post-menopausal women.
5. Discussion
In this study, the results indicated that CA125, HE4, RMI, and ROMA values were useful methods to differentiate malignant tumor from benign gynecologic conditions. Surgery on patients with suspected malignant mass should be accomplished at a tertiary center by gynecologic oncologists to increase the prognosis in patients (5, 22-24). Hence, an accurate referral of patients with ovarian mass is crucial. In order to diagnose malignant tumors before surgery, several studies have been conducted to identify preoperative malignant masses (8, 17, 20, 21, 25). In this study, we investigated the role of CA125, HE4, RMI, and ROMA serum levels, using ROC analysis for assessing the likelihood of malignancy in Iranian women with ovarian mass living in Mazandaran, Iran.
In this study, the optimal cut-off point associated with ROMA was 24.4% and 27.7% for pre- and post-menopausal patients, respectively. The pre-menopausal ROMA cut-off value in our study compared to other studies was higher, whereas the post-menopausal value was similar to that reported by Moore et al. (17). The cut-off values reported by Anton et al. (8) and Van Gorp et al. (26) were 39.68% and 35.9% for post-menopausal women, respectively, which was higher than those in our study. These different results may be due to the greater heterogeneity of histologic types and classification of tumors observed in the different studies. The use of diverse CA125 kits may have led to these differences.
The ROMA marker in many studies was measured in pre- and post-menopausal patients. Anton et al. found that ROMA in women before menopause at the cut-off point of 13.1 had sensitivity and specificity of 77.8% and 69%, while in women after menopause at the cut-off point of 27.7, the sensitivity and specificity were 72.2% and 81.1%, respectively (8). In this study, the sensitivity and specificity of pre-menopausal ROMA at the standard cut-off point of 13.1 were 71.4% and 91.5%, respectively as well as in standard cut-off points of 27.7 for post-menopausal women, the sensitivity was 90% with a specificity of 75%. The sensitivity and specificity of pre-menopausal ROMA at the standard cut-off point in the current study were different from those in the study of Anton et al. Perhaps, the reason for this difference is that the LMP tumors were classified as low-risk in the study of Anton et al., whereas in the present study, the LMP tumors were classified as a high-risk group.
Sandri et al. reported the sensitivity and specificity of 87.5% and 75%, and 0.92 AUC for HE4 (20). However, in this study, the sensitivity, specificity, and AUC at the cut-off point of 66.95 for HE4 were calculated as 82%, 90%, and 0.88, respectively. The two studies have little difference on sensitivity, but the specificity of this study was higher than that of the study of Sandri et al. In addition, the AUC in their study was higher than that in our study. The sensitivity and specificity of 94.4% and 63.2% for HE4 were found in a study of Karlsen et al.. Thus, the present study and the study of Sandri et al. compared to the study of Karlsen et al. on the HE4 marker had less sensitivity and more specificity (27). The difference in the kits used in various studies can justify the difference in the results.
In the present study, the greatest AUC was associated with ROMA values (0.92) as compared to RMI (0.85) and other methods in overall assessment, which is similar to the studies by Moore et al. (ROMA and RMI, 0.91, 0.84, respectively) and Sandri et al. (20) 0.93 for ROMA and 0.92 for HE4. Although, Anton et al. stated that the greatest AUC was related to the RMI values (0.85) as compared to ROMA values (0.82) (8).
Pairwise comparison of ROC-AUCs represented that there was no significant statistical difference between the 4 methods in this study for all patients and pre- and post-menopausal women. In a study conducted by Anton et al., the ROC curves were compared and no differences were found between the 4 methods. Pairwise comparison of ROC-AUCs showed that only the difference between HE4 and ROMA values (P = 0.03) was significant in the overall assessment of post-menopausal women (P = 0.05) (8). Van Gorp, in 2011, reported that the ROC-AUC of CA125 was not significantly different from that of HE4 or ROMA for all malignant diseases compared with benign diseases; differences were only observed between HE4 and ROMA. For pre-menopausal patients, again only the pairwise comparison between HE4 and ROMA was significant. In the post-menopausal population, there was a significant difference between CA125 and HE4 with ROMA compared to HE4 (26). In general, for the whole group of patients and pre- or post-menopausal patients separately, ROMA did not act significantly better than CA125 alone (P = 0.15, P = 0.522, P = 0.60), respectively.
The limitation of this study was the expensive laboratory kits, leading to the decrease of the sample size and weakness in the analysis of the RMI because for calculation of RMI, we needed ultrasound scans. Therefore, the RMI greatly depends on the individual skills of radiologists in the interpretation of the morphological characteristics of the ovarian mass.
5.1. Conclusions
In conclusion, the evaluation of four methods to differentiate the ovarian masses (CA125, HE4, RMI, and ROMA) illustrated that the first ROMA and, then, HE4 despite small variations, had the best accuracy of AUC-ROC compared with RMI and CA125 in all the patients, and in each group of pre- and post-menopausal patients. ROMA had the best specificity and sensitivity at optimal cut-off in both whole population and post-menopausal patients of the 4 methods.
