Interpretation of Tongue Squamous Cell Carcinoma via Protein-Protein Interaction Network Construction and Analysis

authors:

avatar Mona Zamanian Azodi ORCID 1 , avatar Mostafa Rezaei-Tavirani ORCID 2 , * , avatar Majid Rezaei-Tavirani ORCID 3 , avatar Vahid Mansouri 2 , avatar Reza Vafaee 1

Hearing Disorders Research Center, Shahid Beheshti University of Medical Sciences, Tehran, Iran
Proteomics Research Center, Shahid Beheshti University of Medical Sciences, Tehran, Iran
Faculty of Medicine, Iran University of Medical Sciences, Tehran, Iran

how to cite: Zamanian Azodi M, Rezaei-Tavirani M, Rezaei-Tavirani M, Mansouri V, Vafaee R. Interpretation of Tongue Squamous Cell Carcinoma via Protein-Protein Interaction Network Construction and Analysis. Int J Cancer Manag. 2018;11(1):e62004. https://doi.org/10.5812/ijcm.62004.

Abstract

Background:

Tongue squamous cell carcinoma is one of the prominent cancers in the oral cavity. Molecular investigations based on interaction analysis can be promising towards providing a better resolution of malignant neoplasms. Here, the protein-protein interaction network of tongue cancer is studied.

Methods:

The protein-protein interaction network was constructed by the application of Cytoscape 3.5.1 and the related algorithms. Centrality analysis via the degree, betweenness, and closeness centralities was conducted.

Results:

The result indicated that there are seven chief proteins in the network foundation. Moreover, enrichment evaluation suggested two associated biological processes including Response to UV-A, Response to interlukin-7, cellular response to alcohol, and catenin import into nucleus process using CluePedia.

Conclusions:

It can be concluded that the identified central panel proteins and their related biological processes can shed light on the neoplasm mechanisms and are worth pursuing for clinical approaches.

1. Background

Tongue Squamous Cell Carcinoma (TSCS) is one of the important aggressive head and neck cancers whose management and treatment is challenging (1). This tumor is frequent in people with chronic smoking, drinking, and betel squid chewing habits. The clinical symptoms are mostly apparent at the late stage of the disease when the chance of mortality is high; in addition to this, there is a high possibility of recurrence of malignancy after the treatment interventions (2, 3). Despite improvement of disease research and management, these measures are still inadequate due to the disease complexity (3). So, a need for reaching a more sophisticated method of disease management is needed. In this light, biomarker investigation is helpful to better understand the nature of the disease and consequently to achieve novel prognosis and treatment approaches. Transcriptomic, microRNA profiling and proteomics are the most recent high-throughput evaluations of TSCS (2, 4, 5). Specifically, proteins as the fundamental acting parts of living organisms have a definite place in molecular research. Many abnormal phenotypes and disease onset and developments are linked to the proteins’ behaviors (6). Furthermore, interpretation of interaction of these fundamental elements can provide additional knowledge about the whole system malfunctions. In the other words, organism functions are facilitated through complex molecular interactions (7). In a protein-protein interaction network, there are complex interactions between proteins where any alteration in this level can promote an abnormal phenotype such as a disease condition (8). In fact, any small modifications in these agents may affect the molecular interaction arrangements and biological processes that are known as key for normal functions (9). In this regard, network analysis is a useful tool to introduce the crucial proteins as essential elements of the network among numerous proteins. This is possible via topological evaluation of the each protein (10). Degree, betweenness, and closeness are used frequently as the important centrality parameters (11). Degree is the number of the edges that are ended to a node (protein) and the node with a high value of degree is called hub (12). Betweenness value for node T in a network including N nodes is calculated as ratio of G phrase divided by the number of the possible paired nodes excluding the T node (13). Where G is sum of the ratio of the shortest paths between a paired node, where a node acts as bridge in those divided by the all shortest paths between these two nodes. The node characterized by high value of betweenness is known as bottleneck node. Closeness, the other centrality parameter of a node T, is equal to inverse of average of shortest paths between the node T and the other nodes (14). These highlighted parameters via topological analysis may play a considerable role in disease mechanisms (15). Therefore, in this study by the application of protein-protein interaction network, an attempt is made to provide a preliminary knowledge of interaction pattern and to introduce crucial interacting biomarker panel of tongue squamous cell carcinoma.

2. Methods

The protein-protein interaction network was constructed and analyzed by Cytoscape 3.5.1 and its applications. In a way that the network query was by STRING DB V 10.5 (http://string-db.org/), Plug-in. Three different sources are applicable through string DB including protein query, PubMed query, and disease query (16). The latter one was used for the network construction and a confidence score of interaction was set to 0.4. The topological understanding of the network was by the application of Network Analyzer, which is a well-integrated application in Cytoscape (17). Three critical centrality parameters were focused for the network evaluation including degree (K), betweenness centrality, and closeness centrality. Nodes with highest values of degree and betweenness centrality are considered as hub and bottleneck elements, respectively (10). Following the topological analysis, the important nodes were targeted for enrichment examination and action type identification via ClueGo + CluePedia Plug-ins. STRING Action File available in the CluePedia Panel was the source for action query. The action type analyses were activation and inhibition which are assigned with different colors. The statistical method for scoring the actions was kappa statistics which is customizable from 0 to 1 and it can be shown as thick and thin lines. Here, it is set to 0.5 (medium) cut off for any kinds of actions. Gene ontology analysis of the essential elements was based on biological process identification. Clusters of terms are connected with the assigned kappa scores in biological processes analysis. The higher the kappa score, the higher the possibility of terms’ linkage. The assigned statistical criteria are as below:

Kappa score = 0.4, Corrected P value < 0.05

Number of genes per term = 3, Percentage for the queried terms = 4

Grouping level: Min = 2, Max = 8

P value correction method: Bonferroni step down. Enrichment/depletion test: two-sided (enrichment/depletion) test based on hypergeometric distribution (18, 19).

3. Results

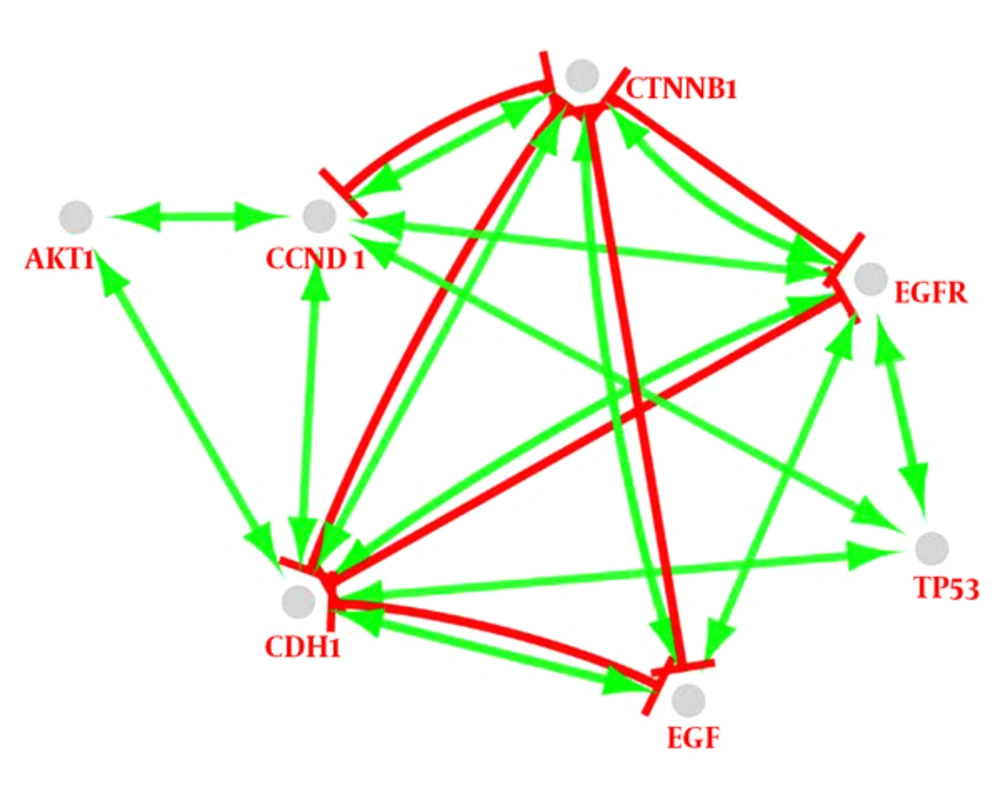
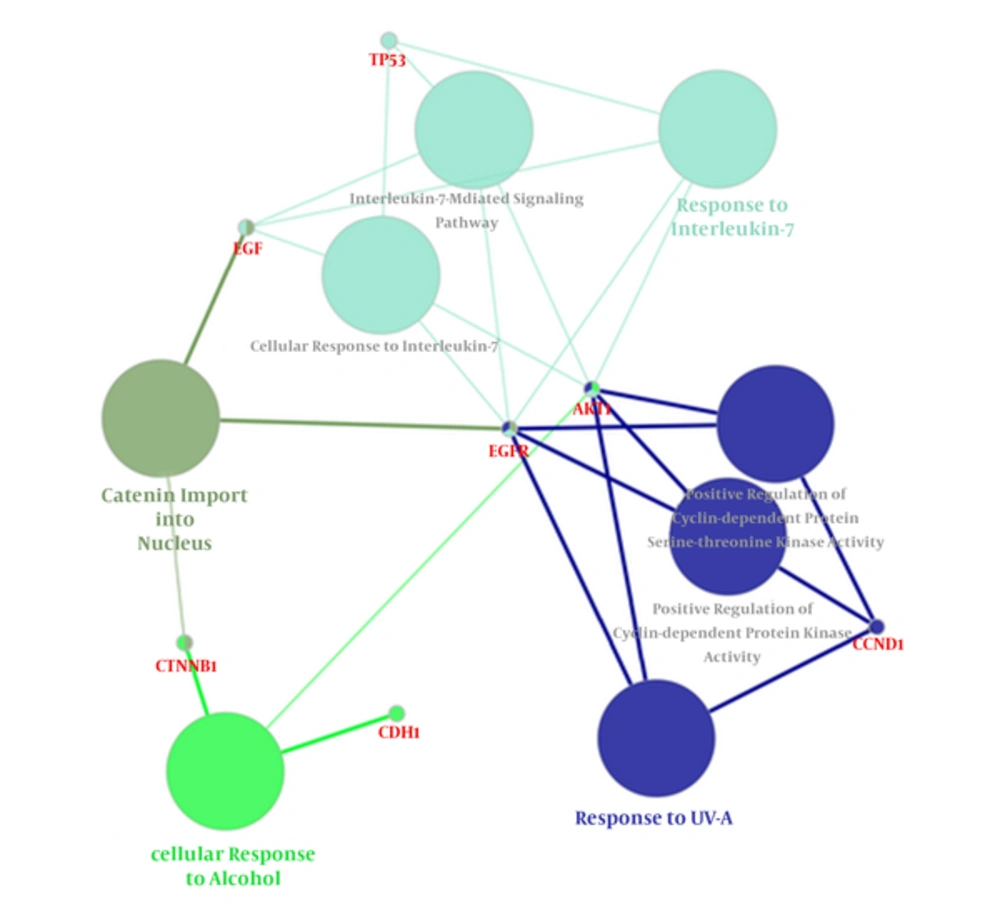
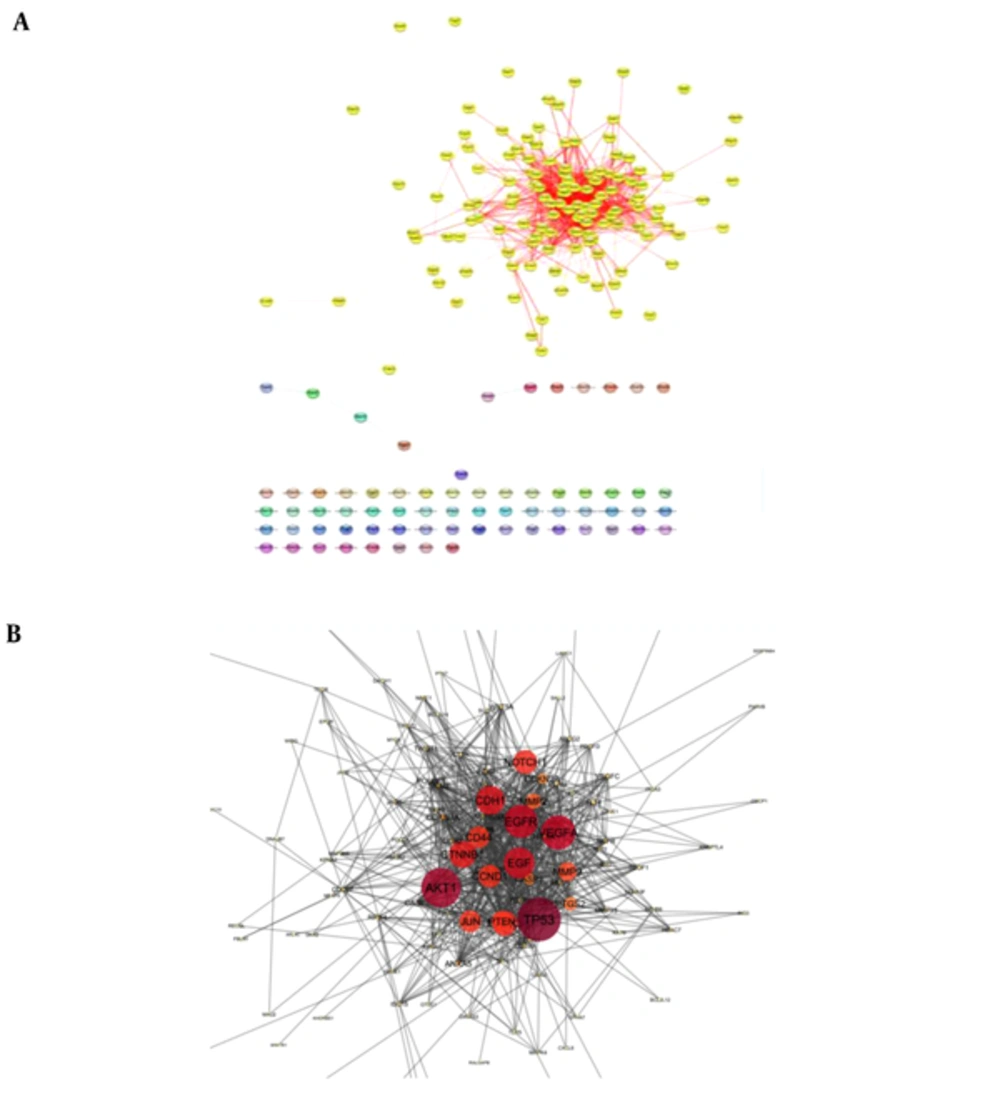
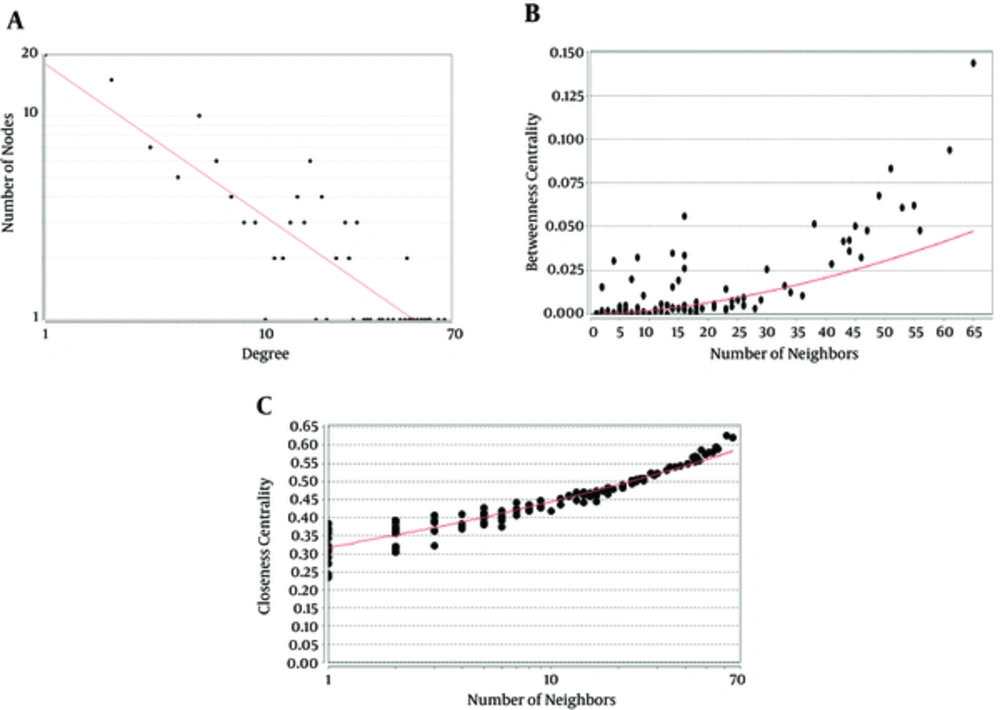
Following the network query for 200 related proteins in tongue squamous cell carcinoma via string DB, Cytoscape, a subnetwork of connected nodes was extracted (Figure 1). Analyzing the distribution of important parameters of the network including degree, betweenness, and closeness centrality is presented in Figure 2. The finding corresponds to the scale free network. Cut offs for degree, betweenness centrality and closeness centrality were determined based on average + 2SD (20). In the mentioned article, the applied method was only suggested for degree value, but here we have adjusted it for other centrality values as well. By this method the suitable number of nodes were selected. So the critical nodes were selected by degree, betweenness, and closeness values above 45, 0.05, and 0.56, respectively (Table 1). Interaction type analysis can provide further information about the central proteins’ behavior in the constructed network (Figure 3). Enrichment analysis based on biological process of the crucial proteins, as it is shown in the Figure 4, can provide information related to disturbed processes and their roles in the disease pathogenicity. The reason for choosing only critical proteins for gene ontology analysis was to determine the more essential biological processes.

Table 1.

The List of Central Proteins in the Constructed Network Analyzed Based on Degree, Betweenness Centrality, and Closeness Centralitya

RowNameDescriptionD(K)BCCCDS
1TP53Tumor protein p53650.140.621.30
2AKT1V-akt murine thymoma viral oncogene homolog 1610.090.620.94
3EGFREpidermal growth factor receptor550.060.600.80
4EGFEpidermal growth factor530.060.580.70
5CDH1Cadherin 1, type 1, E-cadherin (epithelial)510.080.571.66
6CTNNB1Catenin (cadherin-associated protein), beta 1, 88kDa490.070.571.34
7CCND1Cyclin D1450.050.561.02
A, A network of tongue squamous cell carcinoma including 132 interacting and 68 isolated nodes is presented. The connected elements are highlighted in yellow while the individuals are in different ranges of colors. B, the main connected component including 132 nod and 923 edges is illustrated.
A Scale Free Network: Nodes Are Shown as Black Circles and the Red Line Indicates the Power Law. A, Degree distribution, Correlation: 0.94 and R-squared: 0.76; B, Betweenness Centrality distribution, Correlation: 0.85 and R-squared: 0.45 and C, Closeness distribution, Correlation: 0.95 and R-squared: 0.86.
A Nested Pathway Network View Obtained from CluePedia, STRING Action File YU is Shown. The green and red colors code activation and inhibition, respectively. The cut off for these action scores was set to 0.5.
Clusters of Biological Processes Related to Central Elements of the PPI Network. Different groups are coded with specific colors. Response to UV-A, Response to interlukin-7, cellular response to alcohol, and catenin import into nucleus process are the identified significant processes with their corresponding central proteins of the network. Kappa score = 0.4, Corrected P value < 0.05.

4. Discussion

Network medicine is a relatively new discipline that applies different algorithms to provide a better understanding of molecular concept of different diseases including cancer (9). Cytoscape as one of the most popular software for network construction (see Figure 1) and characterization is selected for the present study. With regard to the complex structure of interacting map, more information can be reachable through topological assessments. For this reason, the connecting nodes were examined for the further study by the relevant plug-ins. Node distribution analysis (Figure 2) indicates a scale free mode of the network. In scale free networks, the nodes play different roles in the network and can be ranked as crucial and ordinary nodes in the studied network (21). The trend in degree, betweenness, and closeness centralities distribution implies on noteworthy distance of limited numbers of proteins from the other ones. Considering calculated cut offs for assessing centrality parameters based on designed method (22), seven proteins including TP53, AKT1, EGFR, EGF, CDH1, CTNNB1, and CCND1 were purposed as indicated in Table 1. These proteins were reviewed by literature survey all of which were confirmed to have significant associations in TSCS by many studies (23-28). As it will be discussed, these proteins have been known to have noteworthy participation in many malignancies. Therefore, a panel of them may be more promising in tongue cancer screening. The important role of TP53 in prognosis of TSCC is discussed in details (29). However this protein is related to almost all of the cancer types (30). Based on previous investigations, dysregulation of AKT1 is linked to TSCC. Its role in lymph node metastasis is highlighted. Correlation between AKT1 and reduced overall survival of the cancer patient is also reported (31, 32). There is compelling evidence about involvement of EGF and EGFR in numerous cancers such as colorectal, breast, osteosarcoma, and gastric cancers (33-35). Increment of gene expression of EGFR in oral tongue squamous cell carcinoma was reported by M. Ryott et al. (2009) (25). The linkage of CDH1 is studied in the several cancers including TSCC (36-38). The prominent roles of CTNNB1 in nasopharyngeal carcinoma, tongue cancer cell growth, migration and invasion, initiation of some colon carcinomas and melanomas and prostate cancer are reported in some studies (28, 39-41). There is a correlation between leukemia, primary head and neck squamous cell carcinoma including tongue cancer, and lung cancer with CCND1 expression (42-45).

As it is shown in the Figure 3, there is a complex inhibitor or activator interaction between the seven key genes. TP53 and AKT1 are activated merely by the other genes directly or indirectly but the other genes are activated and also inhibited. Since TP53 activation can induce apoptosis or cell-cycle arrest (46), it seems that the elements of biomarker panel are organized against cancer progress and development. Additionally, these proteins are in condensing interactions as indicated in Figure 3. CDH1 and CTNNB1 have most actions in this network. In spite of the key role of CTNNB1 in the interaction with other genes, it does not have a direct relationship with TP53 and AKT1. However, an investigation indicates that TP53 mutation frequently is accompanied by CTNNB1 mutation (47).

In Figure 4, gene ontology properties of the recognized central proteins based on biological process are illustrated. Response to UV-A, response to interlukin-7, cellular response to alcohol, and catenin import into nucleus were assigned to our top central proteins. That is, these processes may undergo vast modifications as the central proteins dysregulate. The connection of these processes with tongue cancer can be explained in a way that, among these processes, only Response to UV-A has not yet been addressed by any previous studies. Cellular response to alcohol supports the fact that alcohol has some links to this type of cancer as was previously reported about the role of alcohol in oral cancers (48). Association of interleukins with tongue squamous cell carcinoma has been previously reported (49, 50). As mentioned earlier, Catinin contributed to tongue cancer development and invasion; therefore, catenin import into nucleus relation can be justified (28).

In conclusion, the introduced potential biomarker panel and their associated biological processes in this study can be important for more evaluation and consequently for the tongue squamous cell carcinoma treatment goals.
Acknowledgements

References

  • 1.

    Jones AS, Rafferty M, Fenton JE, Jones TM, Husband DJ. Treatment of squamous cell carcinoma of the tongue base: irradiation, surgery, or palliation? Ann Otol Rhinol Laryngol. 2007;116(2):92-9. [PubMed ID: 17388231]. https://doi.org/10.1177/000348940711600203.

  • 2.

    He QY, Chen J, Kung HF, Yuen AP, Chiu JF. Identification of tumor-associated proteins in oral tongue squamous cell carcinoma by proteomics. Proteomics. 2004;4(1):271-8. [PubMed ID: 14730689]. https://doi.org/10.1002/pmic.200300550.

  • 3.

    Azimi H, Khajehahmadi S, Rahpeyma A. Tongue squamous cell carcinoma, a clinical study. Iran J Pathol. 2014;9(1):28-32.

  • 4.

    Ye H, Yu T, Temam S, Ziober BL, Wang J, Schwartz JL, et al. Transcriptomic dissection of tongue squamous cell carcinoma. BMC Genomics. 2008;9:69. [PubMed ID: 18254958]. https://doi.org/10.1186/1471-2164-9-69.

  • 5.

    Wong TS, Liu XB, Chung Wai Ho A, Po Wing Yuen A, Wai Man Ng R, Ignace Wei W. Identification of pyruvate kinase type M2 as potential oncoprotein in squamous cell carcinoma of tongue through microRNA profiling. Int J Cancer. 2008;123(2):251-7. [PubMed ID: 18464261]. https://doi.org/10.1002/ijc.23583.

  • 6.

    Asadzadeh Aghdaee H, Mansouri V, Peyvandi AA, Moztarzadeh F, Okhovatian F, Lahmi F, et al. Topological and functional analysis of nonalcoholic steatohepatitis through protein interaction mapping. Gastroenterol Hepatol Bed Bench. 2016;9(1):23-8. [PubMed ID: 28224024].

  • 7.

    Zamanian Azodi M, Rezaei Tavirani M, Arefi Oskouie A, Hamdieh M, Derakhshan MK, Ahmadzadeh A, et al. Fluoxetine regulates ig kappa chain c region expression levels in the serum of obsessive compulsive disorder patients, a proteomic approach. Iran J Pharm Res. 2017;16(3):1264-71. [PubMed ID: 29201116].

  • 8.

    Zamanian Azodi M, Rezaei Tavirani M, Nejadi N, Arefi Oskouie A, Zayeri F, Hamdieh M, et al. Serum proteomic profiling of obsessive compulsive disorder, washing subtype, a preliminary study. Basic Clin Neurosci. 2017;8(4):307-16. [PubMed ID: 29158881]. https://doi.org/10.18869/nirp.bcn.8.4.307.

  • 9.

    Safari-Alighiarloo N, Taghizadeh M, Rezaei-Tavirani M, Goliaei B, Peyvandi AA. Protein-protein interaction networks (PPI) and complex diseases. Gastroenterol Hepatol Bed Bench. 2014;7(1):17-31. [PubMed ID: 25436094].

  • 10.

    Abbaszadeh HA, Peyvandi AA, Sadeghi Y, Safaei A, Zamanian Azodi M, Khoramgah MS, et al. Er, YAG laser and cyclosporin a effect on cell cycle regulation of human gingival fibroblast cells. J Lasers Med Sci. 2017;8(3):143-9. [PubMed ID: 29123635]. https://doi.org/10.15171/jlms.2017.26.

  • 11.

    Safaei A, Rezaei Tavirani M, Arefi Oskouei A, Zamanian Azodi M, Mohebbi SR, Nikzamir AR. Protein-protein interaction network analysis of cirrhosis liver disease. Gastroenterol Hepatol Bed Bench. 2016;9(2):114-23. [PubMed ID: 27099671].

  • 12.

    Zali H, Rezaei Tavirani M. Meningioma protein-protein interaction network. Arch Iran Med. 2014;17(4):262-72. [PubMed ID: 24724603].

  • 13.

    Safari Alighiarloo N, Taghizadeh M, Tabatabaei SM, Shahsavari S, Namaki S, Khodakarim S, et al. Identification of new key genes for type 1 diabetes through construction and analysis of protein protein interaction networks based on blood and pancreatic islet transcriptomes. J Diabetes. 2017;9(8):764-77. [PubMed ID: 27625010]. https://doi.org/10.1111/1753-0407.12483.

  • 14.

    Okamoto K, Chen W, Li XY. Ranking of closeness centrality for large scale social networks. Lecture Notes in Computer Science. 5059. America: Springer; 2008. p. 186-95.

  • 15.

    Ozgur A, Vu T, Erkan G, Radev DR. Identifying gene disease associations using centrality on a literature mined gene-interaction network. Bioinformatics. 2008;24(13):277-85. [PubMed ID: 18586725]. https://doi.org/10.1093/bioinformatics/btn182.

  • 16.

    Szklarczyk D, Morris JH, Cook H, Kuhn M, Wyder S, Simonovic M, et al. The STRING database in 2017, quality controlled protein protein association networks, made broadly accessible. Nucleic Acids Res. 2017;45(D1):362-8. [PubMed ID: 27924014]. https://doi.org/10.1093/nar/gkw937.

  • 17.

    Assenov Y, Ramirez F, Schelhorn SE, Lengauer T, Albrecht M. Computing topological parameters of biological networks. Bioinformatics. 2008;24(2):282-4. [PubMed ID: 18006545]. https://doi.org/10.1093/bioinformatics/btm554.

  • 18.

    Bindea G, Mlecnik B, Hackl H, Charoentong P, Tosolini M, Kirilovsky A, et al. ClueGO: a Cytoscape plug-in to decipher functionally grouped gene ontology and pathway annotation networks. Bioinformatics. 2009;25(8):1091-3. [PubMed ID: 19237447]. https://doi.org/10.1093/bioinformatics/btp101.

  • 19.

    Bindea G, Galon J, Mlecnik B. CluePedia Cytoscape plugin: pathway insights using integrated experimental and in silico data. Bioinformatics. 2013;29(5):661-3. [PubMed ID: 23325622]. https://doi.org/10.1093/bioinformatics/btt019.

  • 20.

    Safari Alighiarloo N, Rezaei Tavirani M, Taghizadeh M, Tabatabaei SM, Namaki S. Network based analysis of differentially expressed genes in cerebrospinal fluid, (CSF) and blood reveals new candidate genes for multiple sclerosis. PeerJ. 2016;4:2775. [PubMed ID: 28028462]. https://doi.org/10.7717/peerj.2775.

  • 21.

    Albert R. Scale free networks in cell biology. J Cell Sci. 2005;118(21):4947-57. [PubMed ID: 16254242]. https://doi.org/10.1242/jcs.02714.

  • 22.

    Zamanian-Azodi M, Rezaei-Tavirani M, Rahmati-Rad S, Hasanzadeh H, Rezaei Tavirani M, Seyyedi SS. Protein-Protein Interaction Network could reveal the relationship between the breast and colon cancer. Gastroenterol Hepatol Bed Bench. 2015;8(3):215-24. [PubMed ID: 26328044].

  • 23.

    Leedy DA, Trune DR, Kronz JD, Weidner N, Cohen JI. Tumor angiogenesis, the p53 antigen, and cervical metastasis in squamous carcinoma of the tongue. Otolaryngol Head Neck Surg. 1994;111(4):417-22. [PubMed ID: 7524005]. https://doi.org/10.1177/019459989411100405.

  • 24.

    Massarelli E, Liu DD, Lee JJ, El-Naggar AK, Lo Muzio L, Staibano S, et al. Akt activation correlates with adverse outcome in tongue cancer. Cancer. 2005;104(11):2430-6. [PubMed ID: 16245318]. https://doi.org/10.1002/cncr.21476.

  • 25.

    Ryott M, Wangsa D, Heselmeyer-Haddad K, Lindholm J, Elmberger G, Auer G, et al. EGFR protein overexpression and gene copy number increases in oral tongue squamous cell carcinoma. Eur J Cancer. 2009;45(9):1700-8. [PubMed ID: 19332367]. https://doi.org/10.1016/j.ejca.2009.02.027.

  • 26.

    Katoh K, Nakanishi Y, Akimoto S, Yoshimura K, Takagi M, Sakamoto M, et al. Correlation between laminin-5 gamma2 chain expression and epidermal growth factor receptor expression and its clinicopathological significance in squamous cell carcinoma of the tongue. Oncology. 2002;62(4):318-26. [PubMed ID: 12138239]. https://doi.org/10.1159/000065063.

  • 27.

    Diniz-Freitas M, Garcia-Caballero T, Antunez-Lopez J, Gandara-Rey JM, Garcia-Garcia A. Reduced E-cadherin expression is an indicator of unfavourable prognosis in oral squamous cell carcinoma. Oral Oncol. 2006;42(2):190-200. [PubMed ID: 16249116]. https://doi.org/10.1016/j.oraloncology.2005.07.010.

  • 28.

    Li S, Jiao J, Lu Z, Zhang M. An essential role for N-cadherin and beta-catenin for progression in tongue squamous cell carcinoma and their effect on invasion and metastasis of Tca8113 tongue cancer cells. Oncol Rep. 2009;21(5):1223-33. [PubMed ID: 19360298].

  • 29.

    Xie X, Clausen OP, De Angelis P, Boysen M. The prognostic value of spontaneous apoptosis, Bax, Bcl-2, and p53 in oral squamous cell carcinoma of the tongue. Cancer. 1999;86(6):913-20. [PubMed ID: 10491515].

  • 30.

    Petitjean A, Achatz MI, Borresen-Dale AL, Hainaut P, Olivier M. TP53 mutations in human cancers: functional selection and impact on cancer prognosis and outcomes. Oncogene. 2007;26(15):2157-65. [PubMed ID: 17401424]. https://doi.org/10.1038/sj.onc.1210302.

  • 31.

    Ji M, Wang W, Yan W, Chen D, Ding X, Wang A. Dysregulation of AKT1, a miR 138 target gene, is involved in the migration and invasion of tongue squamous cell carcinoma. J Oral Pathol Med. 2017;46(9):731-7. [PubMed ID: 28122142]. https://doi.org/10.1111/jop.12551.

  • 32.

    Jia LF, Huang YP, Zheng YF, Lyu MY, Wei SB, Meng Z, et al. miR-29b suppresses proliferation, migration, and invasion of tongue squamous cell carcinoma through PTEN-AKT signaling pathway by targeting Sp1. Oral Oncol. 2014;50(11):1062-71. [PubMed ID: 25127200]. https://doi.org/10.1016/j.oraloncology.2014.07.010.

  • 33.

    Leek RD, Hunt NC, Landers RJ, Lewis CE, Royds JA, Harris AL. Macrophage infiltration is associated with VEGF and EGFR expression in breast cancer. J Pathol. 2000;190(4):430-6. [PubMed ID: 10699991]. https://doi.org/10.1002/(SICI)1096-9896(200003)190:4<430::AID-PATH538>3.0.CO;2-6.

  • 34.

    Lee JA, Ko Y, Kim DH, Lim JS, Kong CB, Cho WH, et al. Epidermal growth factor receptor: is it a feasible target for the treatment of osteosarcoma? Cancer Res Treat. 2012;44(3):202-9. [PubMed ID: 23091447]. https://doi.org/10.4143/crt.2012.44.3.202.

  • 35.

    Lieto E, Ferraraccio F, Orditura M, Castellano P, Mura AL, Pinto M, et al. Expression of vascular endothelial growth factor (VEGF) and epidermal growth factor receptor (EGFR) is an independent prognostic indicator of worse outcome in gastric cancer patients. Ann Surg Oncol. 2008;15(1):69-79. [PubMed ID: 17896140]. https://doi.org/10.1245/s10434-007-9596-0.

  • 36.

    Peinado H, Olmeda D, Cano A. Snail, Zeb and bHLH factors in tumour progression: an alliance against the epithelial phenotype? Nat Rev Cancer. 2007;7(6):415-28. [PubMed ID: 17508028]. https://doi.org/10.1038/nrc2131.

  • 37.

    Sato F, Meltzer SJ. CpG island hypermethylation in progression of esophageal and gastric cancer. Cancer. 2006;106(3):483-93. [PubMed ID: 16362978]. https://doi.org/10.1002/cncr.21657.

  • 38.

    De Schutter H, Geeraerts H, Verbeken E, Nuyts S. Promoter methylation of TIMP3 and CDH1 predicts better outcome in head and neck squamous cell carcinoma treated by radiotherapy only. Oncol Rep. 2009;21(2):507-13. [PubMed ID: 19148529].

  • 39.

    Palacios J, Gamallo C. Mutations in the beta-catenin gene (CTNNB1) in endometrioid ovarian carcinomas. Cancer Res. 1998;58(7):1344-7. [PubMed ID: 9537226].

  • 40.

    Xia H, Ng SS, Jiang S, Cheung WK, Sze J, Bian XW, et al. miR-200a-mediated downregulation of ZEB2 and CTNNB1 differentially inhibits nasopharyngeal carcinoma cell growth, migration and invasion. Biochem Biophys Res Commun. 2010;391(1):535-41. [PubMed ID: 19931509]. https://doi.org/10.1016/j.bbrc.2009.11.093.

  • 41.

    Gerstein AV, Almeida TA, Zhao G, Chess E, Shih Ie M, Buhler K, et al. APC/CTNNB1 (beta-catenin) pathway alterations in human prostate cancers. Genes Chromosomes Cancer. 2002;34(1):9-16. [PubMed ID: 11921277].

  • 42.

    de Boer CJ, Kluin-Nelemans JC, Dreef E, Kester MG, Kluin PM, Schuuring E, et al. Involvement of the CCND1 gene in hairy cell leukemia. Ann Oncol. 1996;7(3):251-6. [PubMed ID: 8740788].

  • 43.

    Callender T, el-Naggar AK, Lee MS, Frankenthaler R, Luna MA, Batsakis JG. PRAD-1 (CCND1)/cyclin D1 oncogene amplification in primary head and neck squamous cell carcinoma. Cancer. 1994;74(1):152-8. [PubMed ID: 8004570].

  • 44.

    Betticher DC, Heighway J, Hasleton PS, Altermatt HJ, Ryder WD, Cerny T, et al. Prognostic significance of CCND1 (cyclin D1) overexpression in primary resected non-small-cell lung cancer. Br J Cancer. 1996;73(3):294-300. [PubMed ID: 8562333].

  • 45.

    Mineta H, Miura K, Takebayashi S, Ueda Y, Misawa K, Harada H, et al. Cyclin D1 overexpression correlates with poor prognosis in patients with tongue squamous cell carcinoma. Oral Oncol. 2000;36(2):194-8. [PubMed ID: 10745172].

  • 46.

    Bertheau P, Plassa F, Espie M, Turpin E, de Roquancourt A, Marty M, et al. Effect of mutated TP53 on response of advanced breast cancers to high-dose chemotherapy. Lancet. 2002;360(9336):852-4. [PubMed ID: 12243922]. https://doi.org/10.1016/S0140-6736(02)09969-5.

  • 47.

    Pfaff E, Remke M, Sturm D, Benner A, Witt H, Milde T, et al. TP53 mutation is frequently associated with CTNNB1 mutation or MYCN amplification and is compatible with long-term survival in medulloblastoma. J Clin Oncol. 2010;28(35):5188-96. [PubMed ID: 21060032]. https://doi.org/10.1200/JCO.2010.31.1670.

  • 48.

    Rivera C, Venegas B. Histological and molecular aspects of oral squamous cell carcinoma (Review). Oncol Lett. 2014;8(1):7-11. [PubMed ID: 24959211]. https://doi.org/10.3892/ol.2014.2103.

  • 49.

    Cohen RF, Contrino J, Spiro JD, Mann EA, Chen LL, Kreutzer DL. Interleukin-8 expression by head and neck squamous cell carcinoma. Arch Otolaryngol Head Neck Surg. 1995;121(2):202-9. [PubMed ID: 7840929].

  • 50.

    Avadhani AV, Parachuru VP, Milne T, Seymour GJ, Rich AM. Multiple cells express interleukin 17 in oral squamous cell carcinoma. J Oral Pathol Med. 2017;46(1):39-45. [PubMed ID: 27294336]. https://doi.org/10.1111/jop.12465.